
ABSTRACT
Clinical relevance
Corneal epithelial healing after refractive surgery is a clinically significant issue, especially for surface ablation procedures, and this can be monitored using optical coherence tomography (OCT).
Background
The aim of this work is to investigate the corneal epithelial thickness and irregularity by OCT after transepithelial photorefractive keratectomy (t-PRK) and analyse its correlation with visual and refractive outcomes.
Methods
Patients aged ≥18 years with myopia, with or without astigmatism, who underwent t-PRK between May 2020 and August 2021 were included. All participants were subjected to complete ophthalmic examinations and OCT pachymetry at every follow-up visit. Patients were followed up at 1 week and 1, 3, and 6 months postoperatively.
Results
A total of 67 patients (126 eyes) were enrolled in this study. One month postoperatively, spherical equivalent refraction and visual acuity achieved preliminary stability. However, central corneal epithelial thickness (CCET) and standard deviation of the corneal epithelial thickness (SDcet) took 3–6 months to progressive recovery. Patients with higher baseline spherical equivalent refraction were associated with slower epithelial recovery. At every follow-up time point, a significant superior-inferior difference in the minimum corneal epithelial thickness area was observed. Higher stromal haze was correlated with higher spherical equivalent refraction (both baseline and residual) but had no relation with visual outcomes. There was a significant correlation between higher CCET with a better uncorrected distance visual acuity and lower corneal epithelial thickness irregularity.
Conclusions
CCET and SDcet measured by OCT seem to be a good auxiliary indicator for reflecting the status of corneal wound recovery after t-PRK surgery. However, a well-designed randomised control study is needed to confirm the study results.
Introduction
The concept of transepithelial photorefractive keratectomy (t-PRK) surgery was first introduced in the 1990s.Citation1 The original, classic two-step t-PRK process comprises ablation of the corneal epithelium via laser phototherapeutic keratectomy, followed by stromal ablation via photorefractive keratectomy (PRK).Citation2,Citation3 A single-step method was launched in 2007, as the Amaris laser platform (SCHWIND eye-tech-solutions GmbH, Kleinostheim, Germany).
Surface ablation procedures, such as conventional PRK or t-PRK, prevent the flap-related complications of laser in situ keratomileusis and provoke a lower rate of postoperative corneal ectasia.Citation4–6 However, conventional surface ablation procedures are associated with significant postoperative pain, slower visual recovery, and corneal stromal hazing, dissuading patients from undergoing surgery.Citation7,Citation8 Corneal epithelial healing after surgery is a clinically significant issue, especially for surface ablation procedures. The average time for re-epithelialization after t-PRK surgery is approximately 2–3 days.Citation9–11 A faster epithelial healing rate in t-PRK compared to conventional PRK methods was noted in previous studies; nevertheless, this did not result in better visual or refractive outcomes.Citation7,Citation9–12
In contrast to corneal re-epithelialization, the recovery of corneal epithelial thickness takes 3–6 months, with the stable thickness achieved between 3 and 12 months after refractive surgery.Citation13,Citation14 Postoperative epithelial hyperplasia and stromal wound healing have been suggested to be responsible for postoperative refractive regression.Citation15–19 A significant correlation has been reported between changes in spherical equivalent and epithelial thickness, from before surgery to 6 months postoperatively, in the paracentral and peripheral zones after PRK for myopia.Citation13
Clinical methods of corneal epithelial thickness measurement include in vivo confocal microscopy, very high-frequency digital ultrasound, optical coherence tomography (OCT), and Scheimpflug tomography. Among these technologies, OCT provides a noncontact and wider area of measurement, which is more applicable for investigating the corneal epithelial thickness healing patterns.Citation20 The corneal epithelial thickness mapping by OCT has shown high repeatability and reproducibility and is equivalent to other measuring techniques.Citation21–24 The aim of this study is to evaluate the corneal epithelial thickness and irregularity by OCT after t-PRK in myopic eyes and analyse its correlation with patients’ visual and refractive outcomes.
Methods
Participants and ophthalmic examinations
Patients aged ≥ 18 years with low, moderate, or high spherical equivalent (defined as ≥ −3.00 dioptres (D), < −3.00 D and ≥ −6.00D, and < −6.00D, respectively) and with or without astigmatism who underwent t-PRK in the Tri-Service General Hospital, Taipei, Taiwan, between May 2020 and August 2021, were included in this retrospective, non-randomised, clinical study. Corneal astigmatism was further classified into three types based on which degree the steepest meridian lies [against-the-rule (ATR): 0°–30° and 150°–180°; with-the-rule (WTR): 60°–120°; oblique astigmatism (OA): 31°–59° and 121°–149°].
This study adhered to the tenets of Declaration of Helsinki and was approved by the Institutional Review Board of Tri-Service General Hospital (TSGHIRB No.: A202105167). The requirement for patient informed consent was waived. All study procedures were performed following the relevant guidelines and regulations.
The exclusion criteria were preoperative corrected distance visual acuity (CDVA) less than 6/6, unstable refraction within a 3-month follow-up period preoperatively, severe ocular surface disease (dry eye disease, keratoconus, corneal opacity, corneal dystrophy, vernal keratoconjunctivitis, herpetic keratitis, and other ocular surface infections or inflammation), eyelid abnormalities or dysfunctions, any posterior segment abnormality, as well as the history of previous eye surgery, pregnancy, and systemic disorders such as diabetes mellitus, hypertension, and autoimmune diseases.
Patients were advised to discontinue contact lenses wearing for at least 4 weeks before the preoperative examinations and surgery. All patients underwent complete preoperative and postoperative ophthalmic examinations, including preoperative CDVA, postoperative uncorrected distance visual acuity (UDVA), manifest and automated refractions, slit-lamp biomicroscopy, non-contact tonometry, corneal topography (Orbscan; Bausch & Lomb, Inc., Laval, Canada), and OCT pachymetry (Avanti RTVue XR; Optovue, Inc., Fremont, CA, USA). Patients were arranged for outpatient follow-up visits at 1 week and at 1, 3, and 6 months postoperatively (each follow-up time point is defined as the time period from the surgical day [day 0]).
Epithelial thickness measured by optical coherence tomography
All eligible participants underwent OCT pachymetry at baseline and every follow-up visit. The measurement at 1 week follow-up was done after removal of the bandage contact lens and rest for at least 30 minutes. The OCT pachymetry report contained both a corneal pachymetry map and an epithelium map. Each image was assessed by the treating physician (CML or THW), and images with a signal strength index of < 30 were excluded from further analysis.
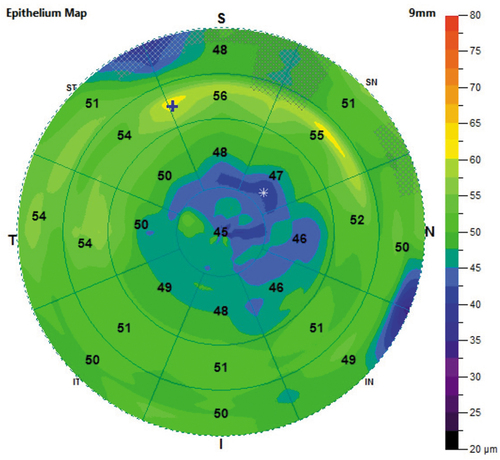
Epithelium maps consist of 25 sectors, including a 2-mm radius central zone and eight octants equally distributed within paracentral (2–5 mm), mid-peripheral (5–7 mm), and peripheral (7–9 mm) annular zones. The mean epithelial thickness was shown within each sector in epithelium maps. The areas of minimum and maximum thickness were indicated with symbols on the map (). Epithelium statistics within the central 7 mm, including superior and inferior (2–7 mm) mean thickness, minimum (min) and maximum (max) thickness, standard deviation of the corneal epithelial thickness (SDcet), and the difference between the minimum and the maximum thickness (min-max), were calculated and exported on the report of OCT pachymetry. The irregularity of corneal epithelial thickness was reflected by the min-max and SDcet on the epithelium map.
Figure 1. An example of epithelium map from the OCT pachymetry report. The epithelium maps were drawn according to the default colour-coded scale. It consists of 25 sectors, including a 2-mm radius central zone and eight octants equally distributed within paracentral (2–5 mm), mid-peripheral (5–7 mm), and peripheral (7–9 mm) annular zones. Mean epithelial thickness was shown within each sector and the area of minimum and maximum thickness were indicated as * and + on the map, respectively.
Surgical procedure and postoperative regimen
All surgeries were performed by one of the two experienced cornea specialists (CML or THW) using the SCHWIND Amaris 1050RS laser system with SmartPulse technology (SmartSurfACE procedure). The ablation was based on algorithms calculated using the ORK-CAM (ORK-Custom Ablation Manager) software planning module. All procedures were performed with at least a 6.50-mm ablation zone. Topical anaesthesia with proparacaine hydrochloride 0.5% eye drops (Alcaine; Alcon, Inc., Geneva, Switzerland) was first applied to the ocular surface.
Corneal epithelial removal and spheroelliptical ablation of stroma were performed in a single step using an excimer laser with one ablation profile. After ablation, mitomycin-C 0.02% was applied to the stromal bed for 12–30 s, depending on the patient’s refractive error (12 s, 20 s, and 30 s for low, moderate, and high spherical equivalent group, respectively), followed by balanced salt solution irrigation. A bandage contact lens (PureVision2; Bausch & Lomb, Inc.) was placed to cover the ocular surface and removed at the 1-week follow-up visit.
Postoperatively, topical levofloxacin 0.5% (Cravit; Santen, Inc., Osaka, Japan) four times a day, and nepafenac 0.1% (Nevanac, Alcon, Inc.) three times a day were applied for 1 week. In addition, fluorometholone 0.1% (Flumetholon, Santen, Inc.) four times a day and preservative-free artificial tears [Optive Fusion® Lubricant Eye Drops (Unit Dose), Allergan Pharmaceuticals (Pty), Ltd.] every 2 h during the daytime were prescribed after surgery and gradually tapered over 3 months.
Statistical analyses
The main outcome measurements of the study included central corneal epithelial thickness (CCET), SDcet, visual acuity (VA; logMAR), and spherical equivalent refraction at baseline and several postoperative time points (1 week, 1 month, 3 months, and 6 months from day 0) after t-PRK surgery. Unless stated otherwise, all parameters were assumed to be at the specific time point. The Kolmogorov-Smirnov test was used to test the normality of all variables. Categorical variables are reported as numbers and percentages, and continuous variables are reported as mean ± SD. Continuous variables were compared using an independent Student’s t-test; Pearson’s chi-squared and Fisher’s exact tests were used to evaluate the differences in categorical variables.
A generalised estimating equation was used to calculate the parameters. Correlation analyses between CCET, SDcet, and haze with refraction, UDVA, and OCT pachymetry parameters were expressed as Spearman’s rank correlation coefficient. Statistical significance was defined as a p-value<0.05. All statistical analyses were performed using the IBM Statistical Package for the Social Sciences (SPSS) Statistics for Windows, Version 22.0. (IBM Corp., Armonk, NY, USA).
Results
A total of 67 patients (126 myopic eyes) who underwent t-PRK surgery at the Tri-Service General Hospital between May 2020 and August 2021 were retrospectively reviewed. These 67 patients included 41 men (61.2%) and 26 women (38.8%), with a mean age of 26.79 years (SD, 6.92; range, 18–50). Eight patients received t-PRK only in one eye. There were 40, 62, and 24 eyes with low, moderate, and high spherical equivalent refractions, respectively. All of the included eyes achieved a baseline CDVA of 6/6 or higher.
shows the baseline demographic characteristics among the low, moderate, and high spherical equivalent groups. There was no significant difference between the preoperative CCET, type of astigmatism, and age between the groups. However, patient sex, sphere power, cylinder power, and spherical equivalent refraction were statistically different among groups.
Table 1. Baseline characteristics of myopic eyes that underwent transepithelial photorefractive keratectomy, according to spherical equivalent degree (n = 126).
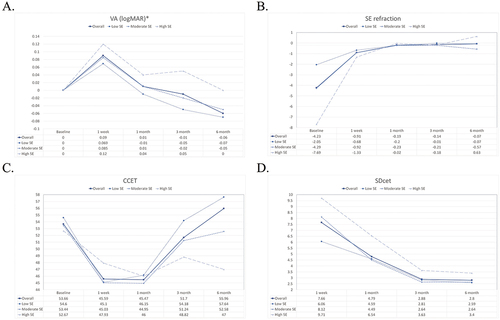
summarises the overall changes in VA, refraction, CCET, and other parameters of OCT pachymetry at every follow-up visit, from baseline to 6 months postoperatively. As this study focused on the postoperative corneal epithelial remodelling, the baseline OCT parameters (except CCET) were not recorded. The mean CCET after surgery was significantly lower than that at baseline, up until 6 months postoperatively. The postoperative UDVA was relatively stable at 1 month and significantly superior to the baseline CDVA at 6 months.
Table 2. Changes of visual acuity, refraction, central corneal epithelial thickness, other parameters of OCT pachymetry, and haze from baseline to 6 months postoperatively.
All refractive parameters, including sphere power, cylinder power (except 1st week), and spherical equivalent refraction, showed a significant decrease from the baseline at every postoperative follow-up time point. The spherical equivalent refraction showed no statistical difference at the 1-month, 3-month, and 6-month time points. Considering other parameters of OCT pachymetry, the superior mean, inferior mean, and minimum corneal epithelial thickness gradually increased from 1 week to 6 months after refractive surgery.
The min-max and SDcet gradually decreased postoperatively; they were significantly lower at the 3-month and 6-month points as compared to the 1-week and 1-month points. The temporal changes of VA, spherical equivalent refraction, CCET, and SDcet are presented in .
Figure 2. The temporal changes of visual acuity, A: spherical equivalent refraction, B: central corneal epithelial thickness, C: and standard deviation of corneal epithelial thickness, D: Solid line, dotted line, short-dashed line, and long-dashed line represent values of the overall, low SE, moderate SE, and high SE group, respectively.
A subgroup analysis comparing postoperative parameters between the low, moderate, and high spherical equivalent groups at different follow-up time points (1-week, 1-month, and 3-month) was also performed. The results are presented in . At 1-week postoperatively, the mean CCET, UDVA, and spherical equivalent refraction showed no significant difference between groups. The min-max and SDcet were significantly lower in the low spherical equivalent group than in the moderate and high groups. The cylinder power and maximum epithelial thickness were highest in the high spherical equivalent group.
Table 3. Postoperative variables at 1 week, 1 month, and 3 months among different spherical equivalent groups.
At 1-month postoperatively, both UDVA and SDcet showed significant improvement in the low and moderate spherical equivalent groups than in the high group. At the 3-month follow-up examination, the UDVA, cylinder power, superior mean, min-max, and SDcet were significantly improved in the low and moderate spherical equivalent groups than in the high group. The CCET, inferior mean, and minimum epithelial thickness were significantly improved in the low spherical equivalent group than in the other groups. Furthermore, the percentage of haze was also significantly lower in the low spherical equivalent group than in the high group.
shows the correlation analysis among CCET, SDcet, and haze with logMAR UDVA, refraction, and OCT pachymetry parameters at the 3-month follow-up examination. LogMAR UDVA and SDcet were significantly negatively correlated with CCET (ρ = −0.340, p = 0.001, and ρ= −0.206, p = 0.045, respectively). Spherical equivalent refraction (baseline) and all other OCT pachymetry parameters, including superior mean, inferior mean, minimum, maximum, and min-max epithelium values showed a significant positive correlation with CCET (ρ = 0.372, 0.780, 0.862, 0.696, 0.591, and 0.211, respectively; all p < 0.001 except for min-max with a p-value of 0.040).
Table 4. Correlation between central corneal epithelial thickness, standard deviation of corneal epithelial thickness, and haze with postoperative variables at 3-month follow up.
SDcet had a significant positive correlation with sphere power (residual), and maximum epithelium thickness (ρ = 0.251, p = 0.017; and ρ = 0.412, p < 0.001, respectively). Furthermore, the cylinder power (residual), spherical equivalent refraction (baseline), CCET, superior mean, minimum, and min-max of epithelial thickness were significantly negatively correlated with SDcet (ρ=-0.288, p=0.006; ρ=-0.308, p = 0.002; ρ=-0.206, p = 0.045; ρ = -0.269, p = 0.008; ρ=-0.582, p < 0.001; and ρ=-0.934, p < 0.001, respectively). As for haze, sphere power (residual), spherical equivalent refraction (residual), spherical equivalent refraction (baseline), and inferior mean epithelial thickness were significantly negatively correlated with haze (ρ=-0.321, p = 0.001; ρ=-0.307, p = 0.002; ρ=-0.410, p < 0.001; and ρ=-0.224, p = 0.031, respectively).
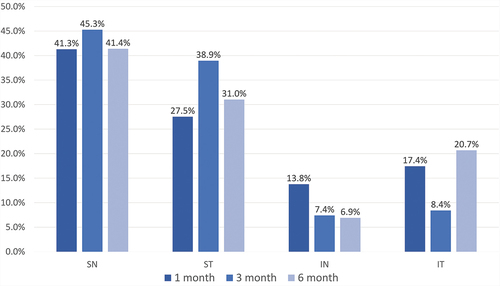
To evaluate the recovery of corneal epithelial thickness over different areas, the OCT epithelium map was further divided into four quadrants (superior-nasal [SN], superior-temporal [ST], inferior-nasal [IN], and inferior-temporal [IT]) and the minimum epithelial thickness area of all studied eyes was recorded. At each follow-up time point, the percentage of the minimum epithelial thickness area in four quadrants was calculated. showed the results obtained at the 1, 3, and 6-month follow-up examination. The percentage, from higher to lower, was SN, ST, IT, and IN with significant differences between any two groups at all follow-up time point (all p < 0.05). The proportion of baseline astigmatism types at 1, 3, and 6-month follow-up within each quadrant of the minimum corneal epithelial thickness was analysed, which showed no statistical difference (see Table S1).
Figure 3. The percentage of minimum corneal epithelial thickness area in four quadrants at 1, 3, and 6-month follow up time points.
Discussion
The healing process of the corneal epithelium involves the integration and cooperation between epithelial proliferation, differentiation, cell adhesion, migration, and apoptosis, which are orchestrated by a myriad of cytokines.Citation25–27 Epithelial renewal enables the integrity of the corneal structure and maintains its smooth surface and refractive function. As showed, an immediate decrease in the spherical equivalent refraction was observed after t-PRK. The condition became stable after the 1-month follow-up examination. However, a significantly lower CCET was observed at 1 week, 1 month, and 3 months compared to baseline CCET. The cornea returned to its preoperative corneal epithelial thickness at >3 months postoperatively, which is consistent with previous findings.Citation13,Citation14
The postoperative UDVA showed no difference with baseline CDVA after 1 month and was significantly better than baseline at the 6-month follow-up examination. The condition may be a result of wavefront refractive procedures to reduce higher‐order aberrations and improve visual quality. However, a Cochrane review concluded that no important difference in the clinical outcomes was observed between wavefront versus conventional refractive surgery at 6 and 12 months postoperatively.Citation28 Further comparison studies of pre-operative CDVA and post-t-PRK UDVA are required to provide more information. Except for VA, all the other OCT pachymetry parameters showed greater improvement at 6 months than at earlier follow-up time points. All of these findings suggest that, as expected, it takes a longer time for the corneal epithelium to return to its preoperative structural status after t-PRK than what it needs to recover from an epithelial wound.
A subgroup analysis based on different baseline spherical equivalent refractions was performed. A higher CCET and maximum epithelial thickness were observed in the high spherical equivalent group at 1 week, with the condition progressively reversing thereafter. This may result from temporary epithelial hyperplasia, which occurs in the early postoperative months after refractive surgery.Citation17 Another possible mechanism is the tendency of the epithelium to fill depressions and reduce any corneal asymmetry after surgery.Citation29 At the 3-month follow-up examination, the high spherical equivalent group showed a poorer recovery status in CCET, UDVA, cylinder power, superior average, inferior average, minimum, min-max of corneal epithelial thickness, SDcet, and haze than the other groups, which implies a slower epithelial wound healing in higher baseline spherical equivalent refraction eyes. However, the high spherical equivalent group reached an average of 0.05 logMAR UDVA and −0.18 residual spherical equivalent refraction at 3-months, which is clinically satisfactory.
A correlation analysis was also performed in this study. At 3-months postoperatively, CCET and SDcet were significantly correlated to each other and they both showed a significant correlation with spherical equivalent refraction (baseline). Patients with a higher refractive error at baseline would have a lower CCET and higher SDcet at 3 months postoperatively. Both CCET and SDcet were also correlated with superior average, minimum, maximum, and min-max of corneal epithelial thickness. These findings suggested that CCET and SDcet were important and valuable parameters for estimating corneal wound recovery and remodelling status after t-PRK.
A higher CCET was correlated to a better visual outcome. Higher haze was correlated with higher sphere power (residual), higher spherical equivalent refraction (residual), higher spherical equivalent refraction (baseline), and lower inferior mean corneal epithelial thickness. Many studies have shown a higher rate of stromal haze in high preoperative spherical equivalent patients who underwent PRK.Citation30–33 Nevertheless, patients with haze developed only grade 0.5 to grade 1 haze in this study, which may be the reason why the haze showed no correlation with patients’ visual outcomes.
Interestingly, a significant superior-inferior difference in the minimum corneal epithelial thickness area on the OCT pachymetry test was found at every follow-up time point. The percentage of the SN region was significantly higher among the four quadrants. A further analysis of the proportions of baseline astigmatism types in each of the four quadrants failed to find any statistical significance.
Several explanations are possible. First, gravity may cause an inclination of the corneal migration towards the inferior region. The gravitational force over the tear film, which contains a biochemically complex mixture of factors, would cause a greater tear volume to remain over the inferior meniscus for a long time.Citation34–36 Second, the corneal sub-basal nerve plexus is arranged in a radiating pattern (whorl-like complex), converging towards an area approximately 1–2 mm inferior to the central cornea.Citation37 The distribution of corneal nerves may have an influence on the remodelling of corneal epithelium.Citation38 Third, the mechanical effect of the eyelids over the ocular surface, either the upper eyelid coverage or the shear forces during blinking, may influence corneal epithelial growth.Citation39,Citation40
This is thought to be the first study to demonstrate the corneal epithelial remodelling after t-PRK by OCT epithelium map. However, this study had some limitations. First, the study included participants from a single centre and had a non-randomised retrospective study design. The sample size was small and the follow-up period was short. Nevertheless, most of the corneal remodelling and epithelial thickening occurred within 3–6 months after the refractive surgery, whereas the stability of epithelial thickness has been observed between 3 and 12 months.Citation13,Citation14
Another limitation is that all study participants were from the Taiwanese population, were relatively young, and a statistical difference was noted initially in the sex of the three spherical equivalent groups. Finally, it remains unclear how the warpage effect of contact lens wearing can influence the OCT measurement results at the 1 week follow-up examination as the contact lens was removed at that time point.
Conclusions
Spherical equivalent refraction and VA achieved preliminary stability 1 month after t-PRK. In contrast, CCET and SDcet took 3–6 months to progressive recovery. The high baseline spherical equivalent group was found to have a slower recovery postoperatively, and a correlation between higher spherical equivalent refraction (baseline) with lower CCET, higher SDcet, and higher haze incidence at 3 months was noted. The SN area was revealed to be the slowest area of corneal epithelial thickness recovery among four quadrants, and an apparent superior-inferior difference was noted in t-PRK.
Higher stromal haze was correlated with higher spherical equivalent refraction (both baseline and residual) but had no relation to visual outcome. This might have been attributed to the fact that all participants developed only low-grade haze in this study. A significant correlation was also observed between higher CCET with better UDVA and lower corneal epithelial irregularity.
Both CCET and SDcet measured by OCT seem to be a good auxiliary indicator for reflecting the status of corneal surface irregularity and wound recovery after t-PRK surgery. A well-designed randomised control study is needed to confirm the study results.
Supplemental Material
Download MS Word (29 KB)Disclosure statement
No potential conflict of interest was reported by the author(s).
Supplementary material
Supplemental data for this article can be accessed online at https://doi.org/10.1080/08164622.2023.2197107
Data availability statement
The original contributions presented in the study are included in the article/supplementary materials. Further inquiries can be directed to the corresponding author.
Additional information
Funding
References
- Alio JL, Ismael MM, Artola A. Laser epithelium removal before photorefractive keratectomy. Refract Corneal Surg 1993; 9: 395. doi:10.3928/1081-597X-19930901-16.
- Adib-Moghaddam S, Soleyman-Jahi S, Sanjari Moghaddam A et al. Efficacy and safety of transepithelial photorefractive keratectomy. J Cataract Refract Surg 2018; 44: 1267–1279. doi:10.1016/j.jcrs.2018.07.021.
- Jun I, Kang DSY, Arba-Mosquera S et al. Clinical outcomes of transepithelial photorefractive keratectomy according to epithelial thickness. J Refract Surg 2018; 34: 533–540. doi:10.3928/1081597X-20180618-02.
- Randleman JB, Woodward M, Lynn MJ et al. Risk assessment for ectasia after corneal refractive surgery. Ophthalmology 2008; 115: 37–50. doi:10.1016/j.ophtha.2007.03.073.
- Moshirfar M, Tukan AN, Bundogji N et al. Ectasia after corneal refractive surgery: a systematic review. Ophthalmol Ther 2021; 10: 753–776. doi:10.1007/s40123-021-00383-w.
- Roszkowska AM, Sommario MS, Urso M et al. Post photorefractive keratectomy corneal ectasia. Int J Ophthalmol 2017; 10: 315–317. doi:10.18240/ijo.2017.02.22.
- Lee HK, Lee KS, Kim JK et al. Epithelial healing and clinical outcomes in excimer laser photorefractive surgery following three epithelial removal techniques: mechanical, alcohol, and excimer laser. Am J Ophthalmol 2005; 139: 56–63. doi:10.1016/j.ajo.2004.08.049.
- Hashemi H, Alvani A, Aghamirsalim M et al. Comparison of transepithelial and conventional photorefractive keratectomy in myopic and myopic astigmatism patients: a randomized contralateral trial. BMC Ophthalmol 2022; 22: 68. doi:10.1186/s12886-022-02293-2.
- Fadlallah A, Fahed D, Khalil K et al. Transepithelial photorefractive keratectomy: clinical results. J Cataract Refract Surg 2011; 37: 1852–1857. doi:10.1016/j.jcrs.2011.04.029.
- Gaeckle HC. Early clinical outcomes and comparison between trans-PRK and PRK, regarding refractive outcome, wound healing, pain intensity and visual recovery time in a real-world setup. BMC Ophthalmol 2021; 21: 181. doi:10.1186/s12886-021-01941-3.
- Celik U, Bozkurt E, Celik B et al. Pain, wound healing and refractive comparison of mechanical and transepithelial debridement in photorefractive keratectomy for myopia: results of 1 year follow-up. Contact Lens Anterior Eye 2014; 37: 420–426. doi:10.1016/j.clae.2014.07.001.
- Yildirim Y, Olcucu O, Alagoz N et al. Comparison of visual and refractive results after transepithelial and mechanical photorefractive keratectomy in myopia. Int Ophthalmol 2018; 38: 627–633. doi:10.1007/s10792-017-0501-y.
- Sedaghat MR, Momeni-Moghaddam H, Gazanchian M et al. Corneal epithelial thickness mapping after photorefractive keratectomy for myopia. J Refract Surg 2019; 35: 632–641. doi:10.3928/1081597X-20190826-03.
- Reinstein DZ, Archer TJ, Gobbe M. Change in epithelial thickness profile 24 hours and longitudinally for 1 year after myopic LASIK: three-dimensional display with Artemis very high-frequency digital ultrasound. J Refract Surg 2012; 28: 195–201. doi:10.3928/1081597X-20120127-02.
- Spadea L, Fasciani R, Necozione S et al. Role of the corneal epithelium in refractive changes following laser in situ keratomileusis for high myopia. J Refract Surg 2000; 16: 133–139. doi:10.3928/1081-597X-20000301-05.
- Lohmann CP, Güell JL. Regression after LASIK for the treatment of myopia: the role of the corneal epithelium. Semin Ophthalmol 1998; 13: 79–82. doi:10.3109/08820539809059822.
- Gauthier CA, Holden BA, Epstein D et al. Role of epithelial hyperplasia in regression following photorefractive keratectomy. Br J Ophthalmol 1996; 80: 545–548. doi:10.1136/bjo.80.6.545.
- Moller-Pedersen T, Cavanagh HD, Petroll WM et al. Stromal wound healing explains refractive instability and haze development after photorefractive keratectomy: a 1-year confocal microscopic study. Ophthalmology 2000; 107: 1235–1245. doi:10.1016/S0161-6420(00)00142-1.
- Lohmann CP, Reischl U, Marshall J. Regression and epithelial hyperplasia after myopic photorefractive keratectomy in a human cornea. J Cataract Refract Surg 1999; 25: 712–715. doi:10.1016/S0886-3350(99)00014-0.
- Hwang ES, Schallhorn JM, Randleman JB. Utility of regional epithelial thickness measurements in corneal evaluations. Surv Ophthalmol 2020; 65: 187–204. doi:10.1016/j.survophthal.2019.09.003.
- Li Y, Shekhar R, Huang D. Corneal pachymetry mapping with high-speed optical coherence tomography. Ophthalmology 2006; 113: 792–799.e792. doi:10.1016/j.ophtha.2006.01.048.
- Li Y, Tang M, Zhang X et al. Pachymetric mapping with Fourier-domain optical coherence tomography. J Cataract Refract Surg 2010; 36: 826–831. doi:10.1016/j.jcrs.2009.11.016.
- Li Y, Tan O, Brass R et al. Corneal epithelial thickness mapping by Fourier-domain optical coherence tomography in normal and keratoconic eyes. Ophthalmology 2012; 119: 2425–2433. doi:10.1016/j.ophtha.2012.06.023.
- Sella R, Zangwill LM, Weinreb RN et al. Repeatability and reproducibility of corneal epithelial thickness mapping with spectral-domain optical coherence tomography in normal and diseased cornea eyes. Am J Ophthalmol 2019; 197: 88–97. doi:10.1016/j.ajo.2018.09.008.
- Lu L, Reinach PS, Kao WWY. Corneal epithelial wound healing. Exp Biol Med 2001; 226: 653–664. doi:10.1177/153537020222600711.
- Wilson SE, Mohan RR, Mohan RR et al. The corneal wound healing response: cytokine-mediated interaction of the epithelium, stroma, and inflammatory cells. Prog Retin Eye Res 2001; 20: 625–637. doi:10.1016/S1350-9462(01)00008-8.
- Ljubimov AV, Saghizadeh M. Progress in corneal wound healing. Prog Retin Eye Res 2015; 49: 17–45. doi:10.1016/j.preteyeres.2015.07.002.
- Li S-M, Kang M-T, Wang N-L et al. Wavefront excimer laser refractive surgery for adults with refractive errors. Cochrane Database Syst Rev 2020; 12: CD012687. doi:10.1002/14651858.CD012687.pub2.
- Salomão MQ, Hofling-Lima AL, Lopes BT et al. Role of the corneal epithelium measurements in keratorefractive surgery. Curr Opin Ophthalmol 2017; 28: 326–336. doi:10.1097/ICU.0000000000000379.
- Pietilä J, Mäkinen P, Pajari T et al. Eight-year follow-up of photorefractive keratectomy for myopia. J Refract Surg 2004; 20: 110–115. doi:10.3928/1081-597X-20040301-03.
- Shojaei A, Mohammad-Rabei H, Eslani M et al. Long-term evaluation of complications and results of photorefractive keratectomy in myopia: an 8-year follow-up. Cornea 2009; 28: 304–310. doi:10.1097/ICO.0b013e3181896767.
- Vestergaard AH, Hjortdal J, Ivarsen A et al. Long-term outcomes of photorefractive keratectomy for low to high myopia: 13 to 19 years of follow-up. J Refract Surg 2013; 29: 312–319. doi:10.3928/1081597X-20130415-02.
- Margo JA, Munir WM. Corneal haze following refractive surgery: a review of pathophysiology, incidence, prevention, and treatment. Int Ophthalmol Clin 2016; 56: 111–125. doi:10.1097/IIO.0000000000000112.
- Pflugfelder SC. Tear dysfunction and the cornea: lXVIII Edward Jackson memorial lecture. Am J Ophthalmol 2011; 152: 900–909.e901. doi:10.1016/j.ajo.2011.08.023.
- Palakuru JR, Wang J, Aquavella JV. Effect of blinking on tear dynamics. Invest Ophthalmol Vis Sci 2007; 48: 3032–3037. doi:10.1167/iovs.06-1507.
- Li L, Braun RJ, Maki KL et al. Tear film dynamics with evaporation, wetting, and time-dependent flux boundary condition on an eye-shaped domain. Phys Fluids (1994) 2014; 26: 052101. doi:10.1063/1.4871714.
- Patel DV, McGhee CN. Mapping of the normal human corneal sub-basal nerve plexus by in vivo laser scanning confocal microscopy. Invest Ophthalmol Vis Sci 2005; 46: 4485–4488. doi:10.1167/iovs.05-0794.
- Shaheen BS, Bakir M, Jain S. Corneal nerves in health and disease. Surv Ophthalmol 2014; 59: 263–285. doi:10.1016/j.survophthal.2013.09.002.
- Masterton S, Ahearne M. Mechanobiology of the corneal epithelium. Exp Eye Res 2018; 177: 122–129. doi:10.1016/j.exer.2018.08.001.
- Ren H, Wilson G. The effect of a shear force on the cell shedding rate of the corneal epithelium. Acta Ophthalmol Scand 1997; 75: 383–387. doi:10.1111/j.1600-0420.1997.tb00394.x.