
ABSTRACT
Clinical relevance
Binocular visual acuity is an important index of functional performance. Optometrists need to know how binocular visual acuity is affected by aniseikonia, and whether reduced binocular visual acuity is a marker for aniseikonia.
Background
Aniseikonia, the perception of unequal image sizes between the eyes, can occur spontaneously or can be induced after different types of eye surgery, or trauma. It is known to affect binocular vision, but there are no prior studies about how it affects visual acuity.
Methods
Visual acuity was measured for 10 healthy well-corrected participants aged 18–21 years of age. Aniseikonia of up to 20% was induced in one of two ways: (1) size lenses, which provided minification of field of view in one eye of each participant and (2) polaroid filters, which allowed vectographic viewing of optotypes on a 3D computer monitor. The best corrected acuity was measured on conventional logarithmic progression format vision charts and isolated optotypes, under both induced aniseikonia conditions.
Results
Induced aniseikonia caused binocular visual acuity thresholds to increase by small but statistically significant amounts, with the largest deficit being 0.06 logMAR for 20% size differences between the eyes. Binocular visual acuity was worse than monocular visual acuity for aniseikonia of 9% and greater. Acuity measured with the vectographic presentation gave slightly higher thresholds (by 0.01 logMAR) than for those viewed with size lenses. Acuity measured with charts gave slightly higher thresholds (by 0.02 logMAR) than with isolated letters.
Conclusion
An acuity change of 0.06 logMAR is small and may be missed in a clinical examination. Therefore, visual acuity cannot be used as a marker of aniseikonia in clinical settings. Even with very marked induced aniseikonia, binocular visual acuity remained well within standards for licen*c*sing of drivers.
KEYWORDS:
Introduction
Aniseikonia is the perception of unequal image sizes between the eyes. Although small amounts of physiological aniseikonia can occur without symptoms, image size differences as small as 1–3% can cause visually disturbing symptoms such as asthenopia, diplopia, distorted space perception, and headaches.Citation1,Citation2 These symptoms can have many functional consequences as they interfere with the ability to perform daily living tasks, such as driving.
Refractive surgery can induce aniseikonia.Citation3 Aniseikonia can stem from anisometropia, abnormal eye development, eye disease, and ocular surgery,Citation4 for example, aniseikonia can also develop due to the horizontal displacement of retinal elements in one eye with retinal oedema or stretching.Citation5,Citation6 Micropsia induced by retinal detachment surgery can cause aniseikonia of up to 9%.Citation7 For many patients, the aniseikonia caused by these conditions results in symptomatic disturbances in sensory fusion.Citation3,Citation4,Citation8
The impact of aniseikonia on stereoacuity is well documented. Jiménez et al. investigated the impact of induced aniseikonia on stereopsis, and found that 5% aniseikonia significantly reduced stereoacuity, but sensory fusion was maintained with up to 15% aniseikonia.Citation8 Similarly, Highman showed that some stereopsis can be present in adults with up to 19% aniseikonia.Citation9 Krarup reported that there exist large inter-individual differences in how aniseikonia degrades stereoacuity, with 54% of participants having no degradation of stereopsis for aniseikonia of greater than 10%. Oguchi and Mashima observed that 5% aniseikonia inhibits VEP responses to stereoscopic stimuli.Citation10
There have been no studies on how aniseikonia affects binocular visual acuity. The question is worth addressing. Firstly, aniseikonia itself does not legally preclude driving,Citation11,Citation12 but its sequelae such as diplopia may be a reason to restrict driving licences.Citation13,Citation14 Visual acuity measurement is the most common screening tool for assessing fitness to drive.Citation11–14 It is important, therefore, to know how suitable acuity testing is as a screening tool for aniseikonia.
Some insights into the effects of aniseikonia can be obtained from evoked potential studies. Katsumi studied the effect of simulated aniseikonia on the amplitude of the visual evoked response (VER) and found that in low aniseikonia (0%–2%), the amplitude of binocular VER was much larger than that of monocular VER.Citation15 However, with 5–8% aniseikonia the binocular and monocular VER were the same, indicating compromised binocular summation, and with high aniseikonia (~10%) binocular VER was poorer than monocular VER.Citation15
Binocular visual acuity is 10–12% better than monocular visual acuity in young normal adults due to binocular summation.Citation16 It may be that rivalry caused by aniseikonia may remove the binocular summation, or may further inhibit binocular vision by making acuity worse.Citation2
Most current studies investigating the effects of aniseikonia induce it using size lenses, which alter the perceived retinal image size without changing refraction. When placed in front of one eye, size lenses make retinal image sizes unequal, making it harder for the cortex to sum visual information. This could also be accomplished using screen-based techniques, using 3D monitors.
The aim of this study was to quantify the effect that simulated aniseikonia has on binocular best corrected visual acuity. Two different acuity configurations were used: isolated Sloan letter optotypes,Citation17 and Sloan letter optotypes presented in the form of a logarithmic progression eye chart.Citation18,Citation19 Crowding effects, as occur with acuity charts, are known to degrade letter recognition.Citation14 It is also possible that aniseikonia may degrade acuity measurements more with vision charts, compared with isolated letters.
Methods
Ten participants (six females, four males) between the ages of 18 and 21 years were recruited from the student population of Queensland University of Technology. Each participant self-reported healthy eyes and met the following inclusion criteria: best-corrected visual acuity better than 6/6 in each eye, less than 1.00D difference in spherical equivalent refraction between the eyes, and visual acuity differences of no more than 0.1 logMAR between eyes. These inclusion criteria ensured participants could adequately integrate visual information. The participants wore a trial frame with their most updated spectacle prescription during testing. Spherical equivalent refraction ranged between +1.00 and −3.25 DS (mean −.016DS, SD 0.95DS). Cylinder magnitude ranged from 0.00 to 1.50DC (mean 0.44DC, SD 0.48DC). The magnitude of interocular differences in spherical equivalent ranged from 0.00 to 1.00DS (mean 0.44DC, SD 0.48DC). The magnitude of intraocular vector differences in astigmatism ranged from 0.00 to 0.80DC (mean 0.26DC, SD 0.31DC).
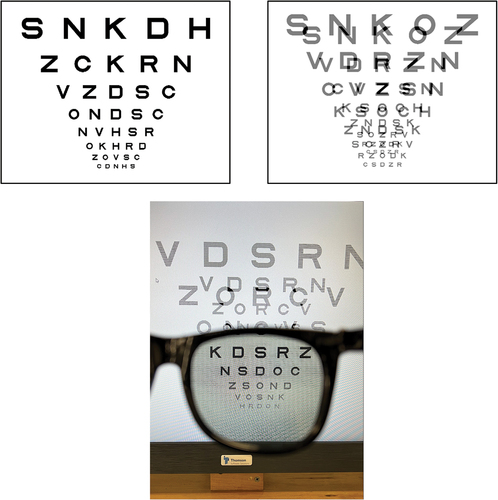
Stimuli were generated on a Thomson Solutions Stereo monitor. The test distance was 7.41 m. Pixel size was 0.27 mm and each pixel subtended 0.125 min of arc. The maximum background luminance was 129 cd m−2 with a minimum luminance of 0.6 cd m−2 as measured with a Topcon BM7 Luminance colorimeter. The monitor was used for vectographic stimulus presentation when viewed through crossed polaroid glasses (illustrated in showing the monitor viewed through the right lens of polaroid spectacles). Monitor background luminance through each polaroid lens was 63 cd m−2. The monitor was also used for non-vectographic viewing, and under that condition the background was set to 63 cd m−2.
Figure 1. Chart stimuli used for assessing visual acuity. Top left is a chart used when aniseikonia was induced with size lenses. Top right is a screen shot of a chart used when aniseikonia was simulated by vectographic presentation on a computer monitor. The bottom is an image of the 3D monitor with vectographic stimuli through the right lens of polaroid spectacles. For illustration purposes, this is set at a reduction of 40% in one of the images, which is twice the largest reduction used in the study.
Aniseikonia was induced in two ways. In one method, the monitor was viewed without polaroid filters (non-vectographic viewing), and image size was manipulated by placing in front of one eye an afocal size lens that reduced image size by a set amount. Specified magnifications were checked by measurements with a lens measure and thickness calipers. Size lenses gave reductions of 9%, 6%, 4%, 2%, 1%. In addition, a condition in which no size lenses were used was incorporated, i.e. 0% induced aniseikonia. Acuity was measured with size reductions in both the right and left eyes.
To induce a larger range of size differences between the eyes, dichoptic viewing was achieved using the vectographic output of the monitor, and the monitor was viewed through polaroid filters. For vectographic simulation of aniseikonia, the image presented to one eye was reduced by 20%, 15%, 10%, 6%, 4%, 2%, and 1%. Again, a condition of 0% simulated aniseikonia was used with equal image sizes being presented on the screen for each eye. Acuity was measured with monocular size reduction, with all reduction conditions being presented for the right and left eyes. The technique is qualitatively different from using size lenses in that, with the vectographic method, the image size difference is localised to the monitor. This technique could increase the range of aniseikonia that could be simulated to 20%, which is about the maximum aniseikonia that might be expected in patients with unilateral aphakia.Citation9
Two different methods of presenting optotypes were used. One used a logarithmic progression chart and the other tested acuity using isolated letter optotypes. The logarithmic progression chart letters were presented in rows of 5 with the largest row being Sloan letter optotypes of 0.4 logMAR and the smallest being −0.3logMAR. Optotypes were selected randomly from the 10 Sloan lettersCitation17 with the condition that an optotype could not be presented more than once on a given row. Examples of single and vectographic versions are shown in . Testing was started at the logMAR 0.1 row and participants were asked to identify optotypes on a row, and allowed to progress to the next row if they correctly identified more than 2 optotypes on a row. They were stopped from reading further down the chart if they made 3 or more mistakes on a row.Citation20 Acuity scoring used letter counting as described by BaileyCitation21 in which logMAR acuity was reduced by 0.02 for every correct optotype identified.
For isolated optotypes, the psychophysics was similar. Optotypes were presented successively in sets of 5 of a given size starting with 0.1 logMAR. If participants identified more than 2 optotypes in a set correctly they were allowed to progress to the next set, which was reduced in size by 0.1 logMAR. The smallest set presented was −0.3 logMAR. Again, scoring was accomplished using letter counting.
All participants undertook two measurements for each condition: the 12 size lens reductions (6 presented to each eye); the 16 vectographic reductions (8 in each eye); and 2 monocular (right and left) measurements, giving a total of 120 acuity measurements on each participant. The order of presenting different conditions and induced aniseikonia was randomised for each participant, as were the optotypes used in each presentation, to minimise learning effects. Participants took breaks when required to control for fatigue.
Results
When aniseikonia was adjusted by use of size lenses by up to 9%, thresholds increased by between 0.03 and 0.04 logMAR (1.5 and 2 letters on a logMAR chart) compared with the zero aniseikonia condition. These results are illustrated in which shows the relationship between aniseikonia (induced by size lens) and acuity for chart format stimuli, and in which shows similar results for isolated optotypes. Repeated measures Analysis of Variance showed that the functions were not significantly different in shape (Aniseikonia x Optotype Presentation interaction, F10,90 = 0.431, p = 0.928) nor were the mean acuities significantly different between isolated optotypes and chart presented optotypes (Optotype Presentation effect (F1,9 = 1.812, p = 0.211). There was a significant effect of aniseikonia on acuity, with results from both chart types averaged (F10,90 = 4.429, p = 0.004).
Figure 2. Effects of aniseikonia induced by size lenses on mean acuity for A: chart based optotypes, and B: isolated presentations of optotypes. Error bars represent 95% confidence intervals for the mean. Smaller images presented to the left eye are shown on the left side of the figures, and smaller images presented to the right eye are shown on the right side of the figure. Monocular thresholds are indicated by the horizontal line and error bar on the right axis. Points significantly higher than monocular thresholds are indicated by an asterisk. Orange point represents the zero induced condition.
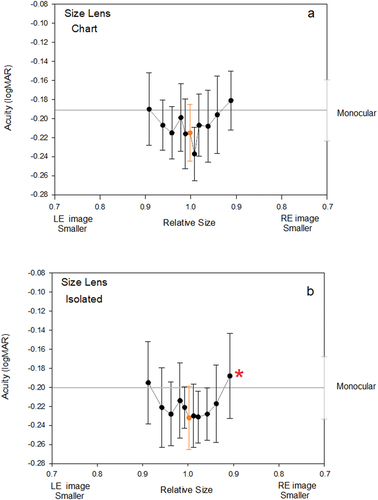
Planned matched pairs t-testing was conducted to determine whether any of the aniseikonia conditions gave acuity thresholds that were significantly higher than monocular acuity, i.e. evidence that aniseikonia causes inhibition of binocular acuity. Only one condition, in which the right eyes image was 9% smaller than the left-eye image, showed significant inhibition, albeit by a very small amount of 0.01 logMAR.
When aniseikonia was simulated with a vectographic presentation on the computer monitor results were slightly different.
Increasing aniseikonia appeared to cause a sharper drop-off in acuity (0.06 logMAR) for the chart style stimuli () than for the isolated optotype stimuli (0.00 to 0.04 logMAR) (). This must be viewed in the light of the variability of the data. In the Analysis of Variance, there was no statistically significant difference in the shapes of the acuity v aniseikonia function for isolated and chart-based acuity stimuli (Aniseikonia x Optotype Presentation interaction, F15,135 = 1.285, p = 0.220).
Figure 3. Vectographic presentation of stimuli: Effects of aniseikonia induced on mean acuity for A: chart based optotypes, and B: isolated presentations of optotypes. Graphing conventions are the same as for .
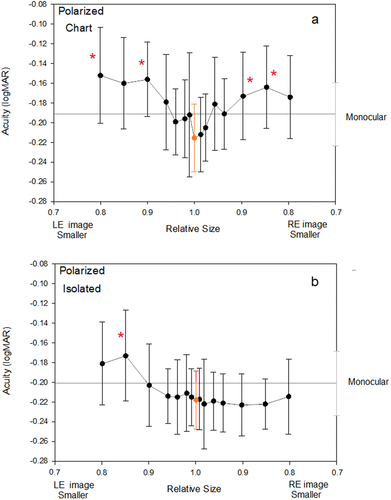
When information from both chart-types were pooled, inducing aniseikonia caused acuity to be reduced (F15, 135 = 4.252, p = 0.012). When isolated optotypes () only are considered, there is an effect of aniseikonia on acuity (F15,135 = 2.069, p = 0.033). Likewise, when chart-based optotypes () only are considered there was an effect of aniseikonia on acuity (F15,135 = 3.310, p < 0.001). Acuity values obtained with chart-based optototypes were slightly (0.03 logMAR) poorer than for those obtained with isolated optotypes. Planned matched pairs tests showed levels of aniseikonia greater or equal to 10% produced poorer binocular acuities than monocular acuities. These are indicated by asterisks in . There were four such points noted for chart-based optotypes, but only one noted for isolated optotypes.
While the curves in appear different, it should be noted that the data for size lenses were collected for a much smaller aniseikonia range. To directly compare them, a 3-way repeated measure Analysis of Variance was used with the following factors: Aniseikonia Level, Optotype Presentation (i.e. whether chart based or isolated) and Induction Method (whether size lenses were used or vectographic presentation). The aniseikonia levels were restricted to those which the two methods shared: 0%, 1%, 2%, 4%, and 6%. For this limited range, the shapes of the functions obtained with size lenses and those with a vectographic presentation did not differ significantly.
All interactions between factors were not significant: Aniseikonia Level x Optotype Presentation x Induction Method (F8,72 = 0.250 p = 0.979), Aniseikonia Level x Optotype Presentation (F8,72 = 0.787 p = 0.615), Aniseikonia Level x Induction Method (F8,72 = 0.590 p = 0.783), and Optotype Presentation x Induction Method (F1,9 = 0.588 p = 0.463). There was a significant effect of Aniseikonia Level (F8,72 = 2.33 p = 0.043) and Optotype Presentation (F1,9 = 11.584 p = 0.008). Acuity measurements made with size lenses gave fractionally lower thresholds, by 0.01 logMAR, than those made with vectographic methods and this was significant (ANOVA Induction Method, F1,9 = 5.137 p = 0.05).
When assessing differences in acuity with right-eye minification compared to left-eye minification, there was approximately 1 letter difference on average across all conditions (see ). T-tests were conducted on the two extremes of the data, and they showed that differences in acuity were not statistically significant. These differences in acuity can therefore be explained by variability in the data being larger than the small effects measured.
Individual participant results showed some variability. These are shown in .
Figure 4. Visual acuity plotted against relative image size for individual participants. Size lens presentations are on the left, vectographic presentation are on the right. Chart based measurements are in the upper frames and isolated optotype measurements are in the lower frames.
Discussion
This study is the first to show that inducing aniseikonia can cause a reduction of binocular visual acuity. That loss is small but statistically significant. For the worst case scenario (vectographic presentation of the 20% aniseikonia with charts), the loss was approximately 0.06 logMAR, which is smaller than the 0.1 logMAR change (1 line) that might be considered clinically significant.Citation22
In the presence of higher levels of aniseikonia, binocular visual acuity became significantly worse than monocular acuity. This occurred with 10 and 20% aniseikonia in the vectographic conditions, and 9% aniseikonia in size lens conditions. Similar levels of aniseikonia have been shown to induce binocular contrast inhibition in VEPs.Citation10 If high levels of aniseikonia lead only to the suppression of vision in the minified eye, we might expect that binocular acuities would be equal to monocular acuity. The finding that large levels of aniseikonia cause acuity to be poorer than monocular viewing suggests that there may be inhibition of the signal from one eye by the conflicting signal from the other. If this inhibition does take place, it would be occurring where the signals combine at the level of the visual cortex.
Acuity thresholds were significantly higher for testing with full conventional charts than isolated optotype presentation, which has been noted by others.Citation23 Crowding with full charts makes it difficult to assess how local features are grouped for recognition. It was expected that crowding effects might be greater for higher amounts of aniseikonia, because of a greater potential for disparate binocular signals to interfere at the level of the visual cortex. That was not observed. For size-lens induced aniseikonia, the curves in were qualitatively similar and not significantly different in shape on analysis of variance. For size-lens induced aniseikonia, the curves in were qualitatively different in shape, with isolated optotypes giving an apparently flatter function. Again, analysis of variance did not find that these functions differed significantly in shape.
It is worth considering whether there are differences between acuity results obtained by simulating aniseikonia with size lenses () and generating aniseikonia with vectographic viewing on a 3D monitor (). Similarities could only be assessed for the aniseikonia of 6% or less, with the only significant difference between the methods being that measurements with size lenses gave slightly lower thresholds (by 0.01 logMAR) than those obtained with vectographic methods. This difference is too small to be of clinical importance. The two methods simulate aniseikonia over different field sizes. The computer-based vectogaphic system had a monitor, which subtended 4° by 2.25°. The size lenses extend over a much greater field of view, limited only by the trial frame, and so it might be expected that the different systems could give different results.
Previous researchCitation3 has found that some participants showed good stereoacuity in the presence of large amounts of aniseikonia while for other participants, a small amount of aniseikonia decreased stereoacuity performance, and individual stereoacuity thresholds showed considerable variation. The relationship between acuity and induced aniseikonia was different, with a very small change in acuity, even with large size differences between the eyes. This was difficult to discern for individual participants against the background of individual variation as seen in . It is only when results were averaged () that trends could be observed clearly.
The small reduction in acuity (0.06 logMAR for 20% magnification differences) means that optometrists are unlikely to detect aniseikonia through acuity testing alone in clinical settings. More robust screening tools for aniseikonia would be binocular vision and stereoacuity tests.Citation3,Citation4,Citation8,Citation10
The present findings have clinical relevance to driver's licence standards. Driver licence acuity requirements vary between jurisdictions, but it is common to require acuity in the better eye of at least logMAR 0.3.Citation11–14 This study indicates that patients with aniseikonia will not have a clinically significant decrease in visual acuity, but their condition may still cause symptoms and impair driving. Although many aspects of vision impairment are known to affect driving,Citation24–28 there have been no studies assessing the effects of aniseikonia on the driving task. This may be an area for further investigation.
It is important to note that eight of the 10 participants were Optometry students and were familiar with the letters presented on the acuity charts. As participants were practiced observers, they are likely to have more reliable visual acuities, which is useful in a psychophysical study using small numbers of observers. However, participants from a more normal clinical population may show higher thresholds and perhaps different acuity results, so it may be worthwhile extending the study into that group using larger numbers of participants. It may also be that patients with pathological or physiological aniseikonia have different results from our participants. “Future research could examine whether correcting for the aniseikonia of patients could improve their visual acuity”.
Conclusion
Binocular visual acuity decreases in the presence of increasing aniseikonia by up to 0.06 logMAR (3 letters on standard logarithmic progression charts). At approximately 10% aniseikonia, binocular visual acuity became worse than monocular visual acuity, indicating binocular summation was compromised. Acuity was worse for conventional charts than for isolated-letter charts, owing to the influence of crowding. Whilst statistically significant, the small effects of aniseikonia on visual acuity are not clinically significant. Consequently, visual acuity is not a suitable screening test for aniseikonia.
Disclosure statement
No potential conflict of interest was reported by the author(s).
References
- Kramer PW, Lubkin V, Pavlica M, et al. Symptomatic aniseikonia in unilateral and bilateral pseudophakia. A projection space eikonometer study. Binocul Vis Strabismus Q 1999; 14: 183–190.
- South J, Gao T, Collins A et al. Aniseikonia and anisometropia: implications for suppression and amblyopia. Clin Exp Optom 2019; 102: 556–565. doi:10.1111/cxo.12881.
- Krarup T, Nisted I, Kjaerbo H et al. Measuring aniseikonia tolerance range for stereoacuity - a tool for the refractive surgeon. Acta Ophthalmol 2021; 99: e43–53. doi:10.1111/aos.14507.
- Rutstein RP, Fullard RJ, Wilson JA et al. Aniseikonia induced by cataract surgery and its effect on binocular vision. Optom Vis Sci 2015; 92: 201–207. doi:10.1097/OPX.0000000000000491.
- Atchison DA, Lee J, Lu J, et al. Effects of simulated anisometropia and aniseikonia on stereopsis. Ophthalmic Physiol Opt 2020; 40: 323–332.
- Ugarte M, Williamson TH. Aniseikonia associated with epiretinal membranes. Br J Ophthalmol 2005; 89: 1576–1580.
- Okamoto F, Sugiura Y, Okamoto Y, et al. Aniseikonia and foveal microstructure after retinal detachment surgery. Invest Ophthalmol Visual Sci 2014; 55: 4880–4885.
- Jiménez JR, Ponce AR, Jiménez del Barco L, et al. Impact of induced aniseikonia on stereopsis with random-dot stereogram. Optom Vis Sci 2002; 79: 121–125.
- Highman VN. Stereopsis and aniseikonia in uniocular aphakia. Br J Ophthalmol 1977; 61: 30–33.
- Oguchi Y, Mashima Y. The influence of aniseikonia on the VEP by random-dot stereogram. Acta Ophthalmol (Copenh) 1989; 67: 127–130.
- Latham K, Katsou MF, Rae S. Advising patients on visual fitness to drive: implications of revised DVLA regulations. Br J Ophthalmol 2015; 99: 545–548.
- Johnson CA, Wilkinson ME. Vision and driving: the United States. J Neuroophthalmol 2010; 30: 170–176.
- Yazdan-Ashoori P, Ten Hove M. Vision and driving: Canada. J Neuroophthalmol 2010; 30: 177–185.
- Assessing Fitness to Drive for commercial and private vehicle drivers 2016. Medical standards for licensing and clinical management guidelines, a resource for health professionals in Australia. As amended up to August 2017. Sydney, Australia: Austroads, National Transport Commision Australia; 2017.
- Katsumi O, Tanino T, Hirose T. Effect of aniseikonia on binocular function. Invest Ophthalmol Visual Sci 1986; 27: 601–604.
- Rubin GS, Muñoz B, Bandeen-Roche K, et al. Monocular versus binocular visual acuity as measures of vision impairment and predictors of visual disability. Invest Ophthalmol Visual Sci 2000; 41: 3327–3334.
- Sloan LL. New test charts for the measurement of visual acuity at far and near distances. Am J Ophthalmol 1959; 48: 807–813.
- Ferris IF, Kassoff A, Bresnick GH, et al. New visual acuity charts for clinical research. Am J Ophthalmol 1982; 94: 91–96.
- Bailey IL, Lovie JE. New design principles for visual acuity letter charts. Am J Optom Physiol Opt 1976; 53: 740–745.
- Carkeet A. Modeling logMAR visual acuity scores: effects of termination rules and alternative forced-choice options. Optom Vis Sci 2001; 78: 529–538.
- Bailey IL. Designation of visual acuity in logarithmic units. Optom Monthly 1980; 71: 80–85.
- Lovie-Kitchin JE, Brown B. Repeatability and intercorrelations of standard vision tests as a function of age. Optom Vis Sci 2000; 77: 412–420.
- Siman-Tov Z, Lev M, Polat U. Binocular summation is affected by crowding and tagging. Sci Rep 2021; 11: 4843.
- Wood JM, Troutbeck R. Effect of visual impairment on driving. Hum Factors 1994; 36: 476–487.
- Wood JM, Garth D, Grounds G, et al. Pupil dilatation does affect some aspects of daytime driving performance. Br J Ophthalmol 2003; 87: 1387–1390.
- Wood JM, Carberry TP. Bilateral cataract surgery and driving performance. Br J Ophthalmol 2006; 90: 1277–1280.
- Carkeet A, Wood JM, Robinson A, et al. Driving speed is altered by monocular neutral density filters: the Enright phenomenon. Optom Vis Sci 2012; 89: 38–43.
- Carkeet A, Wood JM, McNeill KM, et al. The Enright phenomenon. Stereoscopic distortion of perceived driving speed induced by monocular pupil dilation. J Optom 2017; 10: 233–241.