
ABSTRACT
Clinical relevance
Understanding devices used for vision screening, including their potential utilisation and validity, will facilitate proper utilisation of this technology.
Background
The Acuidrive is a self-illuminated, hand-held, visual acuity screening device intended for use in policing, with visual acuity assessed roadside to identify drivers who may not meet vision standards for driving. The target is presented binocularly at 24 cm, and +4.00 D lenses eliminate the accommodation requirement. This study investigates its validity and applicability relative to the Early Treatment of Diabetic Retinopathy Study (ETDRS) chart.
Methods
There were 36 participants, half younger adults aged 18–30 years and half older adults aged 50–70 years. The subjects underwent binocular visual acuity testing using the Acuidrive device and an ETDRS chart displayed on a monitor. Eyes were corrected for distance using lenses in a trial frame, and additional trial lenses provided four blur levels: zero, +0.50 DS, +1.00 DS and +1.50 DS. Luminances for the devices were similar at approximately 100 cd/m2. ETDRS chart measurements were conducted both with room lighting on and off.
Results
The Acuidrive device underestimated the ETDRS visual acuity across all blur levels, with mean differences of 0.24 ± 0.07 logMAR and 0.18 ± 0.10 logMAR for room lights on and off, respectively. To predict ETDRS visual acuity of poorer than 0.34 logMAR (6/12=), a screening level of 0.50 logMAR (6/19) with the Acuidrive device provided high sensitivity and specificity (86% and 79% with lights-on, and 85% and 78% with lights-off). Visual acuity was better for the older group than the younger group by approximately 0.10 logMAR.
Conclusion
There was an offset of 0.2 logMAR (two lines) between visual acuity measures for the Acuidrive device and an ETDRS chart. The Acuidrive device has the potential to be a viable screening tool with refinement to its construction.
Introduction
There have been few studies using portable devices for visual acuity testing, three of which used smart technology such as head-mounted displays and iPads.Citation1–3 Agreement between visual acuity obtained by these novel devices compared with standard distance acuity chart measures was high, with mean differences of 0.05 ± 0.33, 0.00 ± 0.17 and 0.02 ± 0.08 logMAR, respectively. For example, the 6/12 line on the device used by Ong et al. had sensitivity of 64% and specificity of 81% in detecting visual acuities poorer than 6/12 on a Snellen letter chart.Citation2
The Acuidrive device was developed by Tasmanian optometrists Ben Armitage and Dow Vos to improve driver safety by conducting roadside visual acuity testing.Citation4 It is an enclosed, self-illuminating, hand-held binocular viewing device in which printed visual acuity charts are presented at 24 cm distance (). A + 4.00DS compensatory lens negates the accommodation demand for the near target. The device is illuminated by a forehead activated pressure switch. The device has been developed for potential use by police officers in the field and thus must be able to be used by non-medical professionals.
Figure 1. (Top) Acuidrive device components and construction.
Australian driving standards for a private licence include a visual acuity of at least 6/12 in the better seeing eye.Citation5 This may be considered to be a pass if a patient reads three out of the five letters on the 6/12 line, or 6/12= visual acuity. A conditional licence is given if optical correction is required to satisfy this criterion. In the state of Queensland, patients are responsible for self-reporting to the Department of Transport and Main Roads if optical correction is required, rather than reporting by an optometrist.Citation6 From 75 years on, at 12 months intervals, a compulsory medical certificate is required stating the visual status of the patient.Citation7 However, in the Ong et al. Singaporean study, 50% of the people requiring correction for driving admitted to driving without it on occasions,Citation2 while in Australia 12% admitted to never having an eye examination and which may mean they unknowingly require a correction for driving.Citation8
Factors that may affect comparative results with a device such as the Acuidrive and a standard letter chart are pupil size, luminance, and age. The most common reason a person will have poor visual acuity and fail a screening test is an uncorrected refractive error. Uncorrected visual acuity worsens as pupil size increases.Citation9 Pupil size will be influenced by illumination and age, with pupil size decreasing as age increases and luminance lowers.Citation10 Thus, the difference in illumination provided by the Acuidrive and a letter chart may give different visual acuities; such difference may be due to the influence of the surrounding backgrounds as well as the direct luminance.
Older people are less likely to be affected by uncorrected refractive error (ignoring the influence of accommodation) than younger people because of smaller pupil sizes at any lighting level. Furthermore, younger people may be affected by ‘instrument myopia’ in which the awareness of a target being close may result in inappropriate accommodation (older people beyond the approximate age of 50 years are not affected by this because of the natural loss of accommodation by this age).Citation11
The study had three aims: (1) to investigate the accuracy of the Acuidrive device by comparing visual acuities obtained using this device with those measured using an ETDRS chart; (2) to determine the visual acuity level for the device to present the optimal balance between sensitivity and specificity to detect drivers having poorer than 6/12= visual acuity; (3) to investigate the influence of room lighting on the ETDRS chart measurements and thus effect of lighting on the comparisons. Two groups, younger participants aged 18–30 years and older participants aged 50–70 years, were tested to identify any age effects.Citation12
Methods
Participants
There were 36 participants, 18 aged 18–30 years (mean 25 ± 34 years, 9 females) and 18 aged 50–70 years (60 ± 6 years, 9 females). Participants with binocular best-corrected VA poorer than 6/15, as determined on a standard ETDRS chart, were excluded. Approval was given by the Queensland University of Technology Human Research Ethics Committee (approval 2000001114), and participants gave written informed consent.
Apparatus
The Acuidrive device is designed to have a refractive vergence of approximately 0 D. One line of letters was focused for infinity by an observer looking through a 15× telescope; ±0.12 D lenses placed in front of its objective blurred the targets, thus verifying near zero vergence.
An ETDRS chart, at 4 m on a Dell 2214hB LCD monitor with 0.248 mm pixel spacing, was used as a ‘gold’ standard (). This chart comprised 5 × 5 Sloan letters, and five letter combinations using CDHKNORSVZ.
Figure 2. (Top) chart set 1 (of 3) for the Acuidrive device, (bottom) chart 1 (of 3) for the ETDRS test.
Acuidrive letter sets were developed to have the same angles at the eye at 24 cm as for the ETDRS chart at 4 m. 5 × 5 Sloan letters and the same letter options were used.Citation13 Resolution was 2438 dpi × 2438 dpi and print dot spacing was 0.17 min arc so that the 6/3 optotype was 17.5 pixels high. Three different letter combinations were created, with five evenly spaced letters presented on a line, and presented as a four-way rotating chart ().
The testing range of the devices was 6/3 (−0.3 logMAR) to 6/30 (0.7 logMAR) with steps of 0.1 logMAR. The luminance of the EDTRS chart was adjusted by software to match that of the Acuidrive device, using the average settings of two observers. The background luminance was 100 cd/m2 as measured with a Topcon BM-7A luminance colorimeter. Illuminance levels ranged between 40 and 55 lux (51–53 lux at eye position, 40–45 lux wall behind the participant, 47 lux wall on the left, 52 lux wall on right side).
Defocus levels
To enable efficient data collection for a range of acuity levels a repeat measures experimental design was utilised. Here visual acuity was tested for four blur levels (+1.50 D, +1.00 D, +0.50 D and zero) for all participants, rather than having single measures at random blur levels provided by uncorrected visual acuity for a larger number of people. This also enabled most results to be within the visual acuity region of interest of 6/9 to 6/19.
Procedure
Subjective refraction was conducted on right and left eyes of a participant using a projected logMAR chart at 6 m, and testing was done with corrected binocular vision.
Visual acuity was measured on an ETDRS chart, with a + 0.25D lens to compensate for the 4 m distance, as well as for the Acuidrive device. There were three conditions: ETDRS chart with room lights on, ETDRS chart with room lights off, and Acuidrive device with room lights on. There were six test sequences (), with the order randomised for participants to reduce learning effects and limit potential order bias.Citation14 Two aspects were considered to create six testing sequences: first, to use three different charts for the three methods and second, to randomise the order of testing among the three methods.
Table 1. Description of sequences.
Letters seen correctly for each presented line of letters were recorded, i.e., letter-counting was used to increase accuracy, with each correct response scoring −0.02 logMAR.Citation15 A termination rule of three letters incorrect on one line provided high accuracy and high efficiency.Citation16,Citation17 To minimise the learning effects, testing was conducted first with +1.50 D blur and then reduced in 0.50 D steps until correction remained.
Statistical analyses
IBM SPSS software was used for statistical analyses. Data were screened for normality by visual inspection of histograms and boxplots, as well as by Shapiro-Wilk and Kolmogorov–Smirnov tests. Considering the two different illuminations for the ETDRS as two devices, data were normally distributed for all 24 combinations of blur, device, and age combination (p > 0.05).
Factorial repeated measures analysis of variance was conducted for visual acuity, with blur (four levels) and device (2) as within-subject factors and with age group (2) as a between-subject factor. Since the Mauchly test of sphericity was significant, Greenhouse–Geisser correction was made to the degrees of freedom. The analysis was done twice, once for comparison of the ETDRS chart/room lights-on with the Acuidrive, and once for comparison of the ETDRS chart/room lights-off with the Acuidrive.
Agreement of devices was determined by Bland-Altman plots. A receiver operating characteristic curve determined the sensitivity and specificity of the Acuidrive device for detecting subjects with vision poorer than 6/12= on the ETDRS chart, with the optimum point taken as that closest to the upper left of the graphs.
Results
Comparison between ETDRS/room lights-on and Acuidrive
Factorial repeated measures analysis of variance showed main effects of blur (F1.7,58.1 = 510, p < 0.001) and device (F1,34 = 405, p < 0.001) but not of the age group (F1,34 = 0.97, p = 0.33). The following interactions were statistically significant: blur × device (F2.3,77.6 = 14.6, p < 0.001), device × age (F1,34 = 30.0, p < 0.001). There was no significant interaction between blur and age (p = 0.29). The Acuidrive underestimated visual acuity with the ETDRS chart by 0.24 ± 0.10 logMAR ().
Figure 3. Means ± standard deviations of visual acuities at the range of blur levels. These are shown for (left) the 18 to 30 year group and (right) the 50 to 70 year group. Plots have been staggered horizontally for clarity.
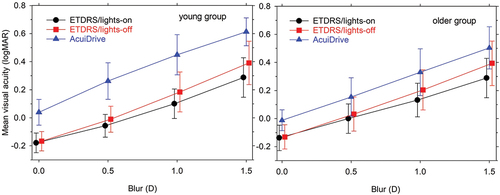
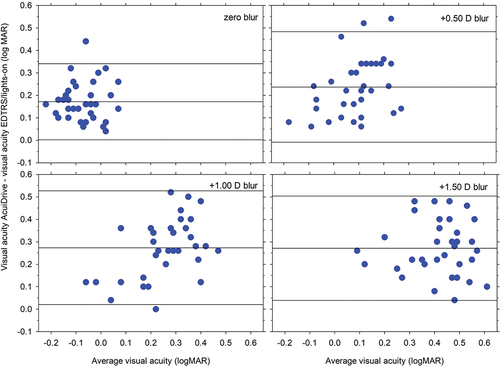
Mean differences between the devices were similar across blur levels (), with the Acuidrive consistently underestimating visual acuity: 0.17 ± 0.09, 0.24 ± 0.13, 0.27 ± 0.13, and 0.27 ± 0.12 logMAR for zero, +0.50 D, +1.00 D and +1.50 blur conditions, respectively.
Figure 4. Bland-Altman plots for the blur levels, showing mean differences between ETDRS/lights-on and Acuidrive visual acuities, together with 95% limits of agreement.
For detecting visual acuities poorer than 0.34 logMAR (6/12=) on the ETDRS chart, the optimum point corresponded to Acuidrive visual acuity of 0.48 logMAR, and provided sensitivity of 92% and specificity of 78% (, top). There was poorer performance for the younger age group than for the older age group with the ETDRS, with respective optimums corresponding to 0.58 and 0.48 logMAR.
Figure 5. Receiver operating characteristics for the Acuidrive in estimating visual acuity poorer than 6/12=: (top) ETDRS/lights-on, (bottom) ETDRS light-off, (left) all participants, (middle) younger participants, and (right) older participants. Large symbols correspond to optimum visual acuity and crosses correspond to 0.50 logMAR (6/19). Horizontal scales are truncated to the range 0 to 0.5.
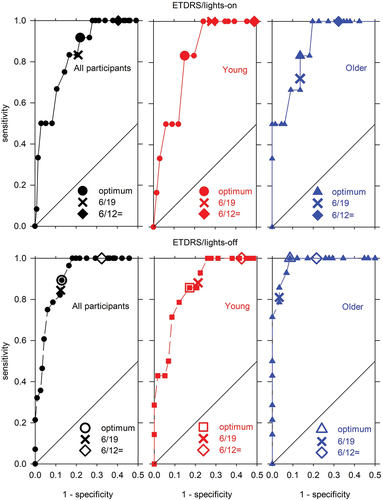
Taking the effective driving standard for failing as poorer than 6/12= (>0.34 logMAR) and applying this as a criterion for the Acuidrive will give a high sensitivity of 100%, but a low specificity of 60% for the total group.
Comparison between ETDRS/room lights-off and Acuidrive
Trends were similar as for the above comparison, with the Acuidrive underestimating visual acuity with the ETDRS chart by 0.18 ± 0.10 logMAR (). Optimum points on the receiver operating characteristic curve were generally similar to those found above, and the corresponding visual acuities were similar, although usually slightly lower (). Applying the effective driving standard as a criterion for the Acuidrive will give a high sensitivity of 100%, but a low specificity of 69% for the total group.
Comparison between ETDRS/room lights-on and ETDRS/room lights-on
A factorial repeated measures analysis of variance with blur and lighting as within-subjects factors and age as a between-subject factor showed ETDRS background lighting to be significant (F1,34 = 60.0, p < 0.001). As expected, the blur was highly significant (F1.3,45.6 = 376, p < 0.001), and there was a significant interaction between luminance and blur (F2.35,79.9 = 17.0, p < 0.001). There was no significant effect of age (F1,34 = 0.82, p = 0.032). The ETDRS/lights-off condition showed poorer visual acuities than the ETDRS/lights-on condition by 0.06 ± 0.04 logMAR.
Discussion
The first study aim was to determine the accuracy of the Acuidrive as a screening device. Using a screen-based ETDRS chart as a standard, the Acuidrive device underestimated visual acuity by 0.24 ± 0.10 logMAR (room lights on for EDTRS) and 0.18 ± 0.10 logMAR (room lights off for EDTRS) – approximately two lines on a standard chart. Taking an effective driving standard for failing as poorer than 6/12= (>0.34 logMAR) gives specificities of approximately 60%–70%, meaning 30%–40% of cases passing on the standard chart would fail with the Acuidrive. Thus, in its present form, the device is not accurate.
The second study aim was to determine the visual acuity level to set the device in order to provide the optimal balance between sensitivity and specificity in detecting drivers failing the standard. The optimum level varies across the two lighting conditions and two age groups from 0.45 to 0.58 log unit. Adopting a level of 6/19 (logMAR 0.50) provides high sensitivity and high specificity across all participants (room lighting on: 86% and 79%, respectively; room lighting off: 85% and 78%, respectively), indicating that this level is excellent for screening purposes.
The third study aim was to determine the influence of room lighting for the ETDRS chart. Removing room lighting for the ETDRS chart reduced visual acuity by 0.06 ± 0.04 logMAR across the four blur levels and two age groups. This effect of lighting can be most likely explained as an increase in pupil size without the background lighting under blurred conditions (). Unfortunately, pupil size was not monitored during the study.
Why was there a difference in visual acuity between the ETDRS chart and the Acuidrive? Upon inspection with a microscope, the letter quality of smaller letter sizes than logMAR 0.0 was not good. As a screening device, the instrument would not be presenting these small sizes. For larger letter sizes in the presence of blur, there is a possible influence of different pupil sizes. The light emitting diode position, at the opposite end of the device to the chart (), causes considerable glare that could explain part of the discrepancy between methods; a backlit screen would overcome this. The light emitting diode had a blue-toned light compared with the white light of the ETDRS chart, and this could contribute to a myopic shift for younger people and variations in results for participants with media opacities.
There was a considerable effect of age group on the Acuidrive results, with the older group having better visual acuities by 0.10 logMAR across the blur levels (). The larger pupil sizes of younger participants might be expected to contribute to this, except there was no significant difference for the two age groups with the ETDRS chart. Another possible cause of the difference is ‘instrument myopia’ in the younger participants in which there is excess accommodation when looking into instruments e.g.Citation11 A contributor to this might be accommodation induced by the convergence.
Comparison of the Acuidrive was with one chart, and comparison with other charts would not necessarily give similar results. The issue can be widened by considering the illumination used for charts and consequently the effect of surround lighting. Cardboard charts require room lighting, but screen-based charts and projector charts do not require room lighting to be visible.
While the main cause of below standard vision being detected in a vision screening is likely to be blur due to refractive errors, other causes of vision loss such as cataracts and macular degeneration may also be present in the driving population. The relationship between Acuidrive measurements and chart -based acuity may be different in the presence of ocular pathology.
Finally, once the device is optimised based on laboratory work, field testing should be conducted.
Conclusion
The Acuidrive device is not accurate for visual acuity threshold measurement, with approximately 0.2 logMAR (or two chart lines) poorer visual acuity than for a screen-based ETDRS chart. However, it has excellent sensitivity and specificity if a letter size of 6/19 (logMAR 0.50) is used for screening based on visual acuity poorer than 6/12= (logMAR 0.34) with the ETDRS chart. The Acuidrive device has the potential to be a viable screening tool with refinement to its construction, such as by moving the light source from in front to behind the target letters.
Acknowledgements
We thank the following students who worked on the project as part of their MOptom degrees: Jai Bakshi, Alice F. Cunningham, Nathan S. W. Loy, Peter Tran and Mai Tien Truong.
Disclosure statement
This work was supported by Acuidrive Pty Ltd.
References
- Gounder PA, Cole E, Colley S et al. Validation of a portable electronic visual acuity system. J Mob Technol Med 2014; 3: 35–39. doi:10.7309/jmtm.3.2.6
- Ong SC, Pek LC, Chiang TL et al. A novel automated visual acuity test using a portable head-mounted display. Optom Vis Sci 2020; 97: 591–597. doi:10.1097/OPX.0000000000001551
- Zhang ZT, Zhang SC, Huang XG et al. A pilot trial of the iPad tablet computer as a portable device for visual acuity testing. J Telemed Telecare 2013; 19: 55–59. doi:10.1177/1357633X12474964
- Acuidrive. Acuidrive [Internet]. Acuidrive.Com; 2021. http://Acuidrive.com/.
- Austroads Ltd. Assessing fitness to drive for commercial and private vehicle drivers. Published Online; 2017. https://austroads.com.au/__data/assets/pdf_file/0022/104197/AP-G56-17_Assessing_fitness_to_drive_2016_amended_Aug2017.pdf.
- Queensland Government. Medical fitness to drive [Internet]. Qld.Gov.au; 2019. https://www.qld.gov.au/transport/licensing/update/medical/fitness.
- Queensland Government. Safe driving [Internet]. Qld.Gov.au; 2021. https://www.qld.gov.au/seniors/transport/senior-drivers.
- Optometry Australia. The 2020 vision index [Internet]; 2020, 16. https://www.optometry.org.au/wp-content/uploads/GVFL/Year_2020/2020-Vision-Index-Report-FINAL.pdf.
- Atchison DA, Smith G, Efron N. The effect of pupil size on visual acuity in uncorrected and corrected myopia. Amer J Optom Physiol Opt 1979; 56: 315–323. doi:10.1097/00006324-197905000-00006
- Watson AB, Yellott JI. A unified formula for light-adapted pupil size. J Vis 2012; 12: 1–16. doi:10.1167/12.10.12
- Aldaba M, Otero C, Pupol J et al. Does the badal optometer stimulate accommodation accurately? Ophthalmic Physiol Opt 2017; 37: 88–95. doi:10.1111/opo.12334
- Etikan I, Musa SA, Alkassim RS. Comparison of convenience sampling and purposive sampling. Am J Theor Appl Stat 2016; 5: 1–4. doi:10.11648/j.ajtas.20160501.11
- Elliott DB. The good (logMAR), the bad (Snellen) and the ugly (BCVA, number of letters read) of visual acuity measurement. Ophthalmic Physiol Opt 2016; 36: 355–358. doi:10.1111/opo.12310
- Watt J. Random order. In Lavrakas P, editor. Encyclopaedia of survey research methods. Sage Publications, Inc. 2008; p. 682. doi:10.4135/9781412963947.
- Suresh KP. An overview of randomization techniques: an unbiased assessment of outcome in clinical research. J Hum Reprod Sci 2011; 4: 8–11. doi:10.4103/0974-1208.82352
- Carkeet A. Modeling logMAR visual acuity scores: effects of termination rules and alternative forced-choice options. Optom Vis Sci 2001; 78: 529–538. doi:10.1097/00006324-200107000-00017
- Shah N, Dakin SC, Whitaker HL et al. Effect of scoring and termination rules on test-retest variability of a novel high-pass letter acuity chart. Invest Ophthalmol Visual Sci 2014; 55: 1386–1392. doi:10.1167/iovs.13-13340