
ABSTRACT
Clinical relevance
Optical coherence tomography angiography (OCT-A) indices are likely to change across time and optometrists should be aware of the variability expected during childhood development and in healthy adults.
Background
Cross-sectional studies have shown that OCT-A indices are associated with age in adults and children. The aim of this study is to investigate longitudinal changes in retinal and choroidal OCT-A indices over 1 year among healthy children and young adults.
Methods
This prospective longitudinal study captured macular OCT-A and OCT scans, and biometry measures at baseline and 1-year follow-up for 22 adults (18–30 years; −6.87 to +0.37 D) and 21 children (6–15 years; −5.75 to +0.25 D). Superficial and deep retinal layer, choriocapillaris and deep choroidal en face OCT-A images were analysed to extract magnification-corrected vascular indices in foveal, parafoveal and perifoveal regions. The retinal indices included foveal avascular zone metrics, perfusion, and vessel density. Flow deficit number, size, and density were extracted from choriocapillaris and perfusion density from deep choroid. Associations between annual changes in the OCT-A indices and axial length and baseline refraction were also studied.
Results
Among children, significant reductions were noted only in parafoveal superficial retinal and foveal and perifoveal deep retinal layer indices over 1 year (p < 0.05). Choroidal OCT-A indices in children and both retinal and choroidal OCT-A indices in adults did not show significant changes. Myopia was associated with a larger reduction in the perifoveal retinal OCT-A indices in children, and with increases in sub-foveal and sub-parafoveal choroidal indices in adults. There were associations between OCT-A indices and axial length changes but differently in adults and children.
Conclusions
Significant changes were noted in retinal OCT-A indices over 1 year among children but not adults. In comparison, choroidal OCT-A indices in adults and children showed a stable morphology over this period of time.
Introduction
It has been well established, using different imaging techniques, that retinal and choroidal vasculature changes with age.Citation1–3 Documented changes include vascular cellular and biomechanical alterations, vessel narrowing, and reduction in choriocapillaris density, which in turn affect vascular functionality (i.e., a reduction in the blood flow). The advent of OCT-A provides rapid, non-invasive three-dimensional visualisation of the retinal and choroidal microvasculature, making it a valuable tool for examinations in clinical practice as well as research.Citation4 OCT-A provides reliable retinal and choroidal vascular indices that can be studied longitudinally.Citation5–7
Cross-sectional and longitudinal study designs using OCT-A have reported an annual increase in foveal avascular zone (FAZ) area and a reduction in superficial and deep retinal layer (SRL and DRL) perfusion density for healthy adults (18–92 years).Citation8–12 Among children (9 weeks to 17 years), some cross-sectional studies suggest an increaseCitation13–15 and others suggest no associationsCitation16–18 between retinal OCT-A indices and age. Choroidal OCT-A indices, such as flow deficit, demonstrate an increase with age, particularly in older adults (>30 years).Citation19 Among children (3–17 years), some cross-sectional studies suggest an increase in choriocapillaris perfusion with age,Citation20 while others suggest a decreaseCitation14 or no association.Citation17 Longitudinal studies in adults have reported no significant changesCitation10 or a decreaseCitation21 in choriocapillaris perfusion over time.
Previous cross-sectional studies have shown significant association between measurements including axial length, choroidal and retinal thickness, and retinal and choroidal microvasculature.Citation22–24 With increased axial length, it is expected that the FAZ may increase in size, retinal perfusion density may reduce and choriocapillaris flow deficits increase. Small changes have also been reported in macular retinal layers until adolescence, including subtle increases in thickness and re-organisation of the retinal tissue layers, and pruning of the avascular zone.Citation15,Citation25,Citation26 However, till date, there is no study that has longitudinally evaluated changes in a range of retinal and choroidal OCT-A indices in children. Compared to adult emmetropes, adult myopes demonstrate significantly higher perfusion density loss over time.Citation8,Citation10 It is also well documented that myopic children show greater axial growth rates than non-myopic children.Citation25,Citation27 Larger changes in retinal and choroidal vascular indices over time may therefore be anticipated for myopic children.
The aim of this study was to investigate changes in retinal and choroidal OCT-A microvasculature indices over a 1-year period using OCT-A among healthy children and young adults. Magnification corrected retinal and choroidal OCT-A indices were compared between visits. Understanding these normal changes over time may be useful to differentiate between physiological and pathological changes.
Methods
This was a 1-year prospective longitudinal study including two visits investigating the changes in retinal and choroidal OCT-A indices among young adults (18–30 years) and children (6–15 years).
Ethical approval
This study was approved by the Queensland University of Technology (QUT) Human Research Ethics Committee (approval number: 2000000349). All participants were treated in accordance with tenets of the declaration of Helsinki. Written informed consent was obtained from the adult participants. For child participants, written parental informed consent and written assent from children were obtained prior to participation.
Participants and data collection protocol
The participants were screened to determine ocular and systemic health status through detailed medical and ocular history, visual acuity, non-cycloplegic autorefraction (Tomey RC-800, Nagoya, Japan) followed by careful subjective refraction, slit lamp and OCT fundus examination (Cirrus HD-OCT 5000, Carl Zeiss Meditec Inc, Dublin, California, USA). Participants with best corrected visual acuity 6/7.5 or better, non-cycloplegic refraction between −6.00 and +6.00 DS and astigmatism ≤2.00 DC and normal ophthalmological findings were included.
Participants with clinical evidence of any ocular disease, amblyopia, strabismus, surgery, or trauma and systemic conditions or medications that may influence the refractive status were excluded. Myopic participants wearing rigid contact lens or under any myopia control treatment (e.g., atropine, orthokeratology contact lens wearers) were excluded. Participants were asked to refrain from caffeine, alcohol or tobacco use and vigorous physical activity and to abstain from soft contact lens wear on the day of the measurements.
A series of measurements were collected over two visits (between July 2020 and December 2021): Baseline and follow-up visits after a year (± 2 months) for the eligible participants. Assuming an alpha error of 5% and statistical power of 80%, in order to detect an annual change of 0.7%Citation28 and difference of 0.012 mm2 Citation29 in FAZ area between the groups, a minimum sample size of 20 was required for each group. A total of 48 participants (24 adults and 24 children) were recruited at baseline. Among them, five participants could not complete the follow-up visit. Two children began atropine treatment, one adult and one child relocated, and one adult underwent refractive surgery following their baseline visit and were all excluded. Thus, 43 participants including 22 adults and 21 children completed the two visits. shows the participant demographics.
Table 1. Demographics of the participants at baseline and follow-up. Sex (P = 0.54) distributions were not significantly different between adults and children. Follow-up duration was significantly (p < 0.001) higher for adults by 0.92 ± 1.40 months compared to children.
During the two visits, OCT-A, structural OCT scans and biometric measurements were taken for the right eye of each participant. To minimise the effect of diurnal variations, the measurements were performed around the same time of the day for each participant (between 1 PM and 5 PM). Ocular biometrics including axial length, corneal curvature, and anterior chamber depth were measured using the IOL master (version 5.4; Carl Zeiss, Jena, Germany).
OCT-A and OCT scanning protocol and image analysis
The OCT-A scans collected at each visit were 3 × 3 mm and 6 × 6 mm macular angiography with enhanced depth imaging, two each, captured through the non-dilated pupils in dim illumination using Zeiss OCT-A (AngioPlex software, version 11.0; Cirrus HD-OCT 5000, Carl Zeiss Meditec Inc, Dublin, California, USA). The OCT-A images were recaptured if the signal strength was <9 or if they had severe motion artefacts, were not centred on the fovea, or exhibited scan tilt >5°.Citation30
The OCT-A and OCT image analysis and indices extraction are described in the supplementary section. The retinal layers including SRL and DRL and choroidal layers including choriocapillaris and deep choroidal en face images automatically segmented by the Zeiss instrument were exported.Citation31 These retinal and choroidal images were analysed using a custom image analysis program written in MATLAB (MathWorks, Natick, Massachusetts, USA) to extract their respective vascular indices from the foveal (central 1 mm), parafoveal (2.5 mm) (from 3 × 3 mm scans) and perifoveal (5 mm) regions (from 6 × 6 mm scans) (), including correction for magnification and projection artefacts.Citation29
Figure 1. Binarized superficial and deep retinal layer (SRL and DRL), choriocapillaris and deep choroidal layer en face image of 6 × 6 mm and 3 × 3 mm scan sizes and definitions of the outcome indices extracted from the retinal and choroidal images. The SRL extends from the internal limiting membrane to the inner plexiform layer and the DRL extends from the inner nuclear layer to the outer plexiform layer. The choriocapillaris extends from 29 µm to 49 µm beneath the RPE and the deep choroid extends from 64 µm to 115 µm below the RPE. Foveal avascular zone- inside central red circle in the SRL and DRL images a to D; central/foveal zone- inside orange circle (images C,D,G and H); parafoveal zone - region between orange and green circles (images C,D,G and H); perifoveal zone - region between green and blue circles (images A,B,E and F).
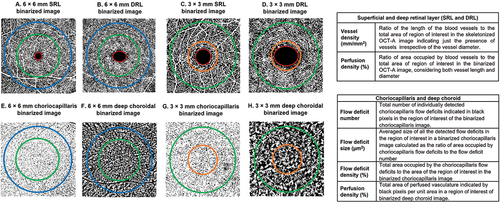
From the retinal OCT-A images, FAZ area and perimeter, perfusion density and vessel density of the SRL and DRL were extracted ().Citation32,Citation33 For the choroidal OCT-A images, total flow deficit number, flow deficit size and density were extracted from the choriocapillaris images and perfusion density from the deep choroidal images ().Citation5,Citation30
Two five-line raster enhanced depth imaging macular OCT scans were captured at the baseline and follow-up visits using the same Zeiss OCT. These scans were analysed using previously described automated methodsCitation34,Citation35 to extract magnification-corrected thicknesses of SRL, DRL, and choroid in the foveal, parafoveal and perifoveal regions for the two visits (Figure S1 of the supplement).
Statistical analyses
Statistical analysis was performed using SPSS (version 25.0; IBM Corp, Armonk, New York, USA) and Microsoft Excel (2010, Microsoft Corporation, Redmond, USA). Data were not normally distributed (Kolmogorov–Smirnov test, p > 0.05). The Wilcoxon signed-rank test compared outcome measures between baseline and follow-up visits for both age groups. Changes in measurements were calculated by subtracting the baseline from follow-up. These changes and measurements at baseline were compared between age groups with the Mann–Whitney U test. Spearman rho correlation (rρ) was used to investigate associations between the outcome measures.
Results
Longitudinal changes in OCT-A indices
Among children, there were significant reductions over 1 year in parafoveal SRL vessel density (−0.30 ± 0.51 mm/mm2), DRL FAZ area (−0.04 ± 0.64 mm2) and FAZ perimeter (−0.11 ± 0.15 mm), foveal DRL perfusion density (−1.93 ± 2.50%) and vessel density (−0.70 ± 0.76 mm/mm2) and perifoveal DRL vessel density (−0.54 ± 1.07 mm/mm2) (). Among adults, retinal OCT-A indices in layers/regions showed no significant change over 1 year (). Significantly larger reductions (p = 0.004 and p = 0.044) were noted in foveal and perifoveal DRL vessel density in children than adults (Figure S2 of the online supplement).
Table 2. Comparison between baseline and 1-year follow-up measurements of OCT-A indices in the three regions for adults and children.
No significant differences were found in choriocapillaris and deep choroid indices between baseline and follow-up visits for both age groups (all p > 0.05) (). The longitudinal changes in axial length, retinal and choroidal thickness in adults and children are shown in table S1 of the online supplement.
Association between changes in OCT-A indices and baseline spherical equivalent refraction
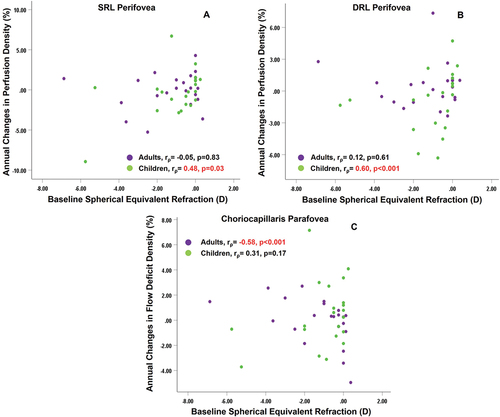
In children, a positive association was found between baseline spherical equivalent refraction and change in perifoveal DRL perfusion density (rρ = 0.60, p = 0.012) and perifoveal SRL perfusion density (rρ = 0.48, p = 0.03) () but not adults. The baseline spherical equivalent refraction was negatively correlated with sub-foveal flow deficit number (rρ=–0.53, p = 0.011), sub-parafoveal flow deficit size (rρ=–0.51, p = 0.015), sub-foveal (rρ=–0.60, p = 0.003) and sub-parafoveal flow deficit density (rρ=–0.58, p = 0.005) among adults but not children ().
Figure 2. Association of baseline spherical equivalent refraction with (A) changes over 1 year in superficial retinal layer (SRL) perfusion density of perifovea (B) changes over 1 year in deep retinal layer (DRL) perfusion density of perifovea (C) changes over 1 year in choriocapillaris flow deficit density of parafovea, for both adults and children. rρ indicates the Spearman correlation coefficient. Significant correlations are highlighted in red.
Associations between changes in OCT-A indices and changes in axial length
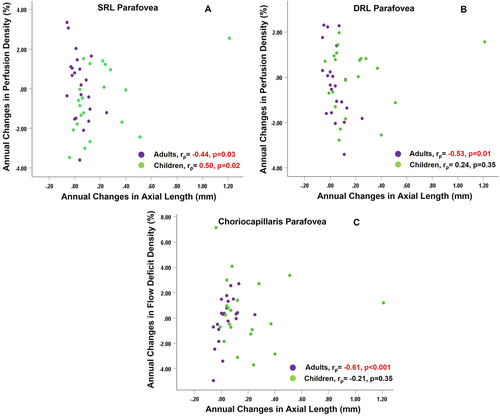
In adults, axial length changes showed negative correlations with changes in parafoveal SRL perfusion density and vessel density (rρ=–0.44, p = 0.04 for both) and parafoveal DRL perfusion and vessel density (rρ = –0.53, p = 0.01 and rρ = –0.48, p = 0.02) (). In children, annual changes in axial length were positively associated with parafoveal SRL perfusion and vessel density (rρ = 0.45, p = 0.04 and rρ = 0.50, p = 0.02). Change in axial length showed significant correlation with changes in sub-parafoveal flow deficit size (rρ = 0.62, p < 0.001) and flow deficit density (rρ = 0.61, p < 0.001) in adults but not children ().
Figure 3. Association of changes over 1 year in axial length with (A) changes over 1 year in superficial retinal layer (SRL) perfusion density of parafovea (B) changes over 1 year in deep retinal layer (DRL) perfusion density of parafovea (C) changes over 1 year in choriocapillaris flow deficit density of parafovea, for both adults and children. rρ indicates the Spearman correlation coefficient. Significant correlation is highlighted in red.
Discussion
This study reports changes for a range of retinal and choroidal OCT-A indices over 1 year in children and adults. Significant reductions were noted in the parafoveal SRL vessel density, DRL FAZ measurements, foveal and perifoveal indices of children, whereas choroidal OCT-A indices did not demonstrate any significant longitudinal changes among children. In comparison, adults did not demonstrate any significant changes in the retinal or choroidal OCT-A indices. The refraction at baseline and axial length changes were significantly associated with the annual changes in the retinal and choroidal OCT-A indices, differently in adults and children.
Children showed a positive association between baseline spherical equivalent refraction and perifoveal perfusion density changes and between axial length and parafoveal SRL perfusion and vessel density changes, whereas adults showed a negative association between baseline spherical equivalent refraction and sub-foveal/parafoveal flow deficit indices and positive association between axial length and sub-parafoveal flow deficit indices changes.
Previously, cross-sectional studies of adults have reported significant age-related increases in FAZ measurements and decreases in vessel and perfusion density of the retinal microvasculature, with larger changes occurring in the population >35 years.Citation11,Citation12,Citation28 In a follow-up of 21 months, Shi, et al.Citation8 found a significant reduction in the SRL vessel density, with higher changes evident in adults with larger levels of myopia. The present study did not find any significant changes over 1 year in SRL OCT-A indices in young adults of spherical equivalent refraction ranging between −6.87 to +0.37 D. Possible reasons why the present findings differ from Shi, et al.Citation8 could be longer follow-up duration, larger scan size, and wider range of refractive error in the latter study.
The DRL showed no significant changes in either zone for adults. This contrasts with the findings of Lin, et al.Citation10 who reported a significant reduction in perifoveal DRL perfusion density in adults. They used Triton OCT-A which has a different DRL slab definition from the Zeiss OCT-A model used in the current study. In addition, Lin et al.Citation10 recruited older adults (38.3 ± 8.67 years) than the current study (23.3 ± 3.8 years). These factors might have contributed to the differences in the findings. Another study of healthy adults (21–67 years) reported significant longitudinal changes in the SRL FAZ area, whereas the present study did not find any significant changes in the FAZ metrics of both SRL and DRL over time among adults possibly due to the inclusion of a narrow age range (18–30 years).Citation9
Previous cross-sectional studies have reported inconsistent results on the effects of age on SRL OCT-A indices among children with some suggesting increaseCitation13–15 and others suggesting no associations.Citation16–18 The only longitudinal studyCitation9 among children (5–18 years) did not find any significant changes (p = 0.37) in the SRL FAZ area over time (3.35 ± 1.66 years) when compensated for ocular magnification.Citation9 However, they did not assess the changes in any DRL indices.Citation9 The present study showed similar results for the SRL FAZ metrics. A significant decrease was noted in the DRL FAZ metrics and foveal vessel and perfusion density in children. This agrees with a cross-sectional study in children that found a decrease in DRL perfusion density with age.Citation36
The FAZ grows to adult dimensions by 15 months of age, however there are continuous development and fine adjustments in the macular retinal layers until adolescence.Citation15,Citation25,Citation26 Any changes in the capillaries of the inner retina or thickness defining the boundaries of DRL FAZ may affect its dimensions. It may be that a significant increase in the inner retina including SRL and DRL thickness over 1 year noted in the current study could have introduced microstructural changes in the macula such as displacements of the capillaries at the FAZ margin, affecting the FAZ and foveal indices.
Significantly larger decrease in perifoveal SRL and DRL indices over 1 year was associated with increasing baseline myopia among children in the present study. As the peripheral retina may be less resistant to the effects of axial length elongation, a significantly greater reduction in perifoveal retinal perfusion density compared to parafoveal and foveal regions has been reported to be associated with myopia.Citation37,Citation38 The greater axial length changes observed in children than in adults could possibly explain the larger associations between refraction and perifoveal indices in children.
The current study is the first to investigate changes in choroidal OCT-A indices over 1 year among children and compare the changes to young adults. The choroidal OCT-A indices did not change significantly over 1 year in either group, supporting some previous cross-sectional findings.Citation19,Citation39 The choroidal vascular diameter and thickness show similar features between adults and children.Citation11 In the present study, the deep choroidal perfusion at baseline was not different between adults and children, however the choriocapillaris indices in the sub-foveal and sub-parafoveal regions at baseline were significantly higher in adults. The annual changes in the choroidal OCT-A indices were not significant for adults or children, indicating that any age-related changes in choriocapillaris vascular morphology in children were smaller than could be detected in the current protocol.
Axial length and retinal perfusion density among adults show a negative association even after compensating for axial length-related magnification,Citation23,Citation40 whereas conflicting associations (no, positive, and negative association) have been noted in children.Citation15,Citation41,Citation42 In adults, retinal OCT-A indices and axial length changes at parafovea over 1 year were also negatively associated in this study. It has been suggested that increasing axial length causes stretching and redistribution of the retina, resulting in an increase in total retinal area.Citation23 This may cause existing retinal vessels to spread over a larger area, hence reducing their density.
The reason behind the positive association between axial length and parafoveal retinal indices changes among children is not clear. Macular layers develop until adolescence, with changes including small increases in thickness and re-organisation of the retinal tissue layers, continuous pruning of the avascular zone and changes in vessel loops and branches.Citation15,Citation25,Citation26 This could affect the relationship between axial length and retinal microvasculature. It should also be noted that there was a child participant with an axial length increase of 1.20 mm over a year. Removing this outlier from reduced the correlation coefficient (between changes in perfusion density at SRL parafovea and axial length) from 0.50 to 0.30 and was no longer significant.
The changes in sub-parafoveal choriocapillaris flow deficit size and density were positively associated with axial length changes over 1 year among adults, who presented a decrease in choriocapillaris perfusion with increase in axial length but not in children despite their significant axial eye growth. Likewise, in adults but not children, a larger annual reduction in the choriocapillaris perfusion was associated with myopia. Previous cross-sectional studies have found that a decrease in choriocapillaris perfusion is associated with longer axial length and myopia among adults.Citation43,Citation44 However, in children, axial elongation of the eye may not have a prominent effect on choroidal vascular structure or perfusion.Citation45,Citation46 This suggests a potential mechanism in children that prevents reduction in choroidal perfusion associated with axial elongation. More studies including a larger sample size of children with high myopia and progressing myopia can be planned to comprehensively understand the role of choroidal blood flow in myopia and its relationship with axial eye growth.
In the present study, the follow-up duration for the adults was higher than children by 0.92 ± 1.40 months. The change between visits was calculated by subtracting the baseline from the follow-up measurements. This did not account for the difference in the follow-up duration between adults and children which could be a possible limitation. Significant changes in the measurements were noted in children over a shorter period of 11.9 months, whereas no significant changes in adults comparatively longer period (12.8 months). Compensating for this ~1-month difference will result in ~8% change in the calculated annual changes (assuming that the observed changes are linear). This is unlikely to significantly affect the changes in the measurements.
The present study results did not find statistically significant changes in any of the OCT-A indices in adults and only in a few OCT-A indices in children. It may be that the relatively small sample sizes have limited the power of this experiment to detect small changes. As a guide to future researchers, using the obtained standard deviations from the present study, the sample size required to detect significant changes in each of the indices (provided in the supplementary section, Table S2) has been provided. The values in the table suggest that the estimated sample size was less or close to that of the present study, for the indices that demonstrated significant change over a year. The table also indicates that very large sample sizes would be required to achieve significance for a few of the indices.
Another limitation is the lack of cycloplegic refraction, which may affect the reliability of the refractive error measurement in children. For the same reason, the refraction between visits was not compared, instead axial length changes were calculated.Citation47 Given that, participant response is seldom required while capturing non-cycloplegic measures of axial length, axial length measurements are more reliable than non-cycloplegic subjective refraction measures.
Although the follow-up duration of the present study was relatively short (~1 year) and included only two visits, this study adds to the knowledge of long-term changes in retinal and choroidal OCT-A indices in children. The findings from the study can also serve as a reference while studying longitudinal changes in OCT-A in congenital and paediatric retinal/choroidal diseases that significantly affect retinal and choroidal microvasculature such as amblyopia, pathological myopia, retinopathy of prematurity, and type 1 diabetes. The change in OCT-A indices, baseline refraction and axial length changes were also associated but differently in adults and children. Longer and continued follow-up with a larger sample size in young children is required to further understand these longitudinal changes and their association with myopia progression and axial eye elongation.
Conclusion
Significant changes were noted in parafoveal SRL and foveal and perifoveal DRL indices among children over 1 year. The annual changes in the DRL indices significantly differed between children and adults. The choroidal OCT-A indices did not change significantly. The changes in the OCT-A indices over 1 year were associated with changes in axial length and refractive groups, and these associations were different between adults and children.
Supplemental Material
Download PDF (396.7 KB)Disclosure statement
No potential conflict of interest was reported by the author(s).
Supplementary material
Supplemental data for this article can be accessed online at https://doi.org/10.1080/08164622.2023.2259907
References
- Ng DS, Chan LK, Ng CM et al. Visualising the choriocapillaris: histology, imaging modalities and clinical research - a review. Clin Exp Ophthalmol 2022; 50: 91–103. doi:10.1111/ceo.13984.
- Catita J, Lopez-Luppo M, Ramos D et al. Imaging of cellular aging in human retinal blood vessels. Exp Eye Res 2015; 135: 14–25. doi:10.1016/j.exer.2015.03.019.
- Leung H, Wang JJ, Rochtchina E et al. Relationships between age, blood pressure, and retinal vessel diameters in an older population. Invest Ophthalmol Visual Sci 2003; 44: 2900–2904. doi:10.1167/iovs.02-1114.
- Turgut B. Optical coherence tomography angiography – a general view. Eur Ophth 2016; 10: 39. doi:10.17925/EOR.2016.10.01.39.
- Chu Z, Zhang Q, Gregori G et al. Guidelines for imaging the choriocapillaris using oct angiography. Am J Ophthalmol 2021; 222: 92–101. doi:10.1016/j.ajo.2020.08.045.
- Zhao Q, Yang WL, Wang XN et al. Repeatability and reproducibility of quantitative assessment of the retinal microvasculature using optical coherence tomography angiography based on optical microangiography. Biomed Environ Sci 2018; 31: 407–412. doi:10.3967/bes2018.054.
- Zhang Z, Huang X, Meng X et al. In vivo assessment of macula in eyes of healthy children 8 to 16 years old using optical coherence tomography angiography. Sci Rep 2017; 7: 8936. doi:10.1038/s41598-017-08174-9.
- Shi Y, Ye L, Chen Q et al. Macular vessel density changes in young adults with high myopia: a longitudinal study. Front Med 2021; 8: 648644. doi:10.3389/fmed.2021.648644.
- Linderman RE, Heffernan E, Ferrante S et al. The impact of axial eye growth on foveal avascular zone measurements in children. Optom Vis Sci 2021; 99: 127–136. doi:10.1097/OPX.0000000000001854.
- Lin F, Zhao Z, Li F et al. Longitudinal macular retinal and choroidal microvasculature changes in high myopia. Invest Ophthalmol Visual Sci 2021; 62: 1. doi:10.1167/iovs.62.15.1.
- Park SH, Cho H, Hwang SJ et al. Changes in the retinal microvasculature measured using optical coherence tomography angiography according to age. J Clin Med 2020; 9: 883. doi:10.3390/jcm9030883.
- You QS, Chan JCH, Ng ALK et al. Macular vessel density measured with optical coherence tomography angiography and its associations in a large population-based study. Invest Ophthalmol Visual Sci 2019; 60: 4830–4837. doi:10.1167/iovs.19-28137.
- Hsu ST, Ngo HT, Stinnett SS et al. Assessment of macular microvasculature in healthy eyes of infants and children using OCT angiography. Ophthalmol 2019; 126: 1703–1711. doi:10.1016/j.ophtha.2019.06.028.
- Borrelli E, Lonngi M, Balasubramanian S et al. Macular microvascular networks in healthy pediatric subjects. Retina 2019; 39: 1216–1224. doi:10.1097/IAE.0000000000002123.
- Li S, Yang X, Li M et al. Developmental changes in retinal microvasculature in children: a quantitative analysis using optical coherence tomography angiography. Am J Ophthalmol 2020; 219: 231–239. doi:10.1016/j.ajo.2020.05.008.
- Plaitano C, Periti F, Guagliano R et al. Optical coherence tomography angiography in healthy children: a comparison of macular structure. Eur J Ophthalmol 2021; 32: 2005–2010. doi:10.1177/11206721211043749.
- Ghassemi F, Hatami V, Salari F et al. Quantification of macular perfusion in healthy children using optical coherence tomography angiography. Int J Retina Vitreous 2021; 7: 56. doi:10.1186/s40942-021-00328-2.
- Zhang Y, Zhang B, Fan M et al. The vascular densities of the macula and optic disc in normal eyes from children by optical coherence tomography angiography. Graefes Arch Clin Exp Ophthalmol 2020; 258: 437–444. doi:10.1007/s00417-019-04466-0.
- Sacconi R, Borrelli E, Corbelli E et al. Quantitative changes in the ageing choriocapillaris as measured by swept source optical coherence tomography angiography. Br J Ophthalmol 2019; 103: 1320–1326. doi:10.1136/bjophthalmol-2018-313004.
- Karakucuk Y, Comez A, Beyoglu A et al. Evaluation of macular microcirculation in healthy children using optical coherence tomography angiography. Beyoglu Eye J 2021. doi:10.14744/bej.2020.76588.
- Cheng W, Wang W, Song Y et al. Choriocapillaris and progressive ganglion cell-inner plexiform layer loss in non-glaucomatous eyes. Br J Ophthalmol 2022; 321277. doi:10.1136/bjo-2022-321277.
- Xu A, Sun G, Duan C et al. Quantitative assessment of three-dimensional choroidal vascularity and choriocapillaris flow signal voids in myopic patients using SS-OCTA. Diagnostics 2021; 11: 11. doi:10.3390/diagnostics11111948.
- Khan MH, Lam AKC, Armitage JA et al. Impact of axial eye size on retinal microvasculature density in the macular region. J Clin Med 2020; 9: 2539. doi:10.3390/jcm9082539.
- Yu J, Gu R, Zong Y et al. Relationship between retinal perfusion and retinal thickness in healthy subjects: an optical coherence tomography angiography study. Invest Ophthalmol Visual Sci 2016; 57: OCT204–210. doi:10.1167/iovs.15-18630.
- Read SA, Alonso-Caneiro D, Vincent SJ et al. Longitudinal changes in macular retinal layer thickness in pediatric populations: myopic vs non-myopic eyes. PloS One 2017; 12: e0180462. doi:10.1371/journal.pone.0180462.
- Provis JM, Penfold PL, Cornish EE et al. Anatomy and development of the macula: specialisation and the vulnerability to macular degeneration. Clin Exp Optom 2005; 88: 269–281. doi:10.1111/j.1444-0938.2005.tb06711.x.
- Tideman JWL, Polling JR, Vingerling JR et al. Axial length growth and the risk of developing myopia in European children. Acta Ophthalmol 2018; 96: 301–309. doi:10.1111/aos.13603.
- Alshareef RA, Al-Khersan H, Darwich R et al. Measurement of normative foveal avascular zone parameters in healthy adults using optical coherence tomography angiography. J Vitreoretin Dis 2018; 2: 213–218. doi:10.1177/2474126418778492.
- Lal B, Alonso-Caneiro D, Read SA et al. Induced refractive error changes the optical coherence tomography angiography transverse magnification and vascular indices. Am J Ophthalmol 2021; 229: 230–241. doi:10.1016/j.ajo.2021.04.012.
- Lal B, Alonso-Caneiro D, Read SA et al. Changes in retinal optical coherence tomography angiography indexes over 24 hours. Invest Ophthalmol Visual Sci 2022; 63: 25. doi:10.1167/iovs.63.3.25.
- Rosenfeld PJ, Durbin MK, Roisman L et al. Zeiss angioplex spectral domain optical coherence tomography angiography: technical aspects. Dev Ophthalmol 2016; 56: 18–29.
- Chu Z, Lin J, Gao C et al. Quantitative assessment of the retinal microvasculature using optical coherence tomography angiography. J Biomed Opt 2016; 21: 66008. doi:10.1117/1.JBO.21.6.066008.
- Lal B, Alonso-Caneiro D, Read SA et al. Diurnal changes in choroidal optical coherence tomography angiography indices over 24 hours in healthy young adults. Sci Rep 2023; 13: 3551. doi:10.1038/s41598-023-30433-1.
- Alonso-Caneiro D, Read SA, Collins MJ. Automatic segmentation of choroidal thickness in optical coherence tomography. Biomed Opt Express 2013; 4: 2795–2812. doi:10.1364/BOE.4.002795.
- Chiu SJ, Li XT, Nicholas P et al. Automatic segmentation of seven retinal layers in sdoct images congruent with expert manual segmentation. Opt Express 2010; 18: 19413–19428. doi:10.1364/OE.18.019413.
- Icel E, Yilmaz H, Ucak T et al. Evaluation of the optic disc and macula in healthy children using optical coherence tomography angiography. Turk J Ophthalmol 2020; 50: 228–233. doi:10.4274/tjo.galenos.2020.85282.
- Cheng D, Chen Q, Wu Y et al. Deep perifoveal vessel density as an indicator of capillary loss in high myopia. Eye (Lond) 2019; 33: 1961–1968. doi:10.1038/s41433-019-0573-1.
- Lam DS, Leung KS, Mohamed S et al. Regional variations in the relationship between macular thickness measurements and myopia. Invest Ophthalmol Visual Sci 2007; 48: 376–382. doi:10.1167/iovs.06-0426.
- Zheng F, Zhang Q, Shi Y et al. Age-dependent changes in the macular choriocapillaris of normal eyes imaged with swept-source optical coherence tomography angiography. Am J Ophthalmol 2019; 200: 110–122. doi:10.1016/j.ajo.2018.12.025.
- Sampson DM, Gong P, An D et al. Axial length variation impacts on superficial retinal vessel density and foveal avascular zone area measurements using optical coherence tomography angiography. Invest Ophthalmol Visual Sci 2017; 58: 3065–3072. doi:10.1167/iovs.17-21551.
- Cheung CY, Li J, Yuan N et al. Quantitative retinal microvasculature in children using swept-source optical coherence tomography: the Hong Kong children eye study. Br J Ophthalmol 2018; 103: 672–679. doi:10.1136/bjophthalmol-2018-312413.
- Golebiewska J, Biala-Gosek K, Czeszyk A et al. Optical coherence tomography angiography of superficial retinal vessel density and foveal avascular zone in myopic children. PloS One 2019; 14: e0219785. doi:10.1371/journal.pone.0219785.
- Su L, Ji YS, Tong N et al. Quantitative assessment of the retinal microvasculature and choriocapillaris in myopic patients using swept-source optical coherence tomography angiography. Graefes Arch Clin Exp Ophthalmol 2020; 258: 1173–1180. doi:10.1007/s00417-020-04639-2.
- Dai Y, Xin C, Zhang Q et al. Impact of ocular magnification on retinal and choriocapillaris blood flow quantification in myopia with swept-source optical coherence tomography angiography. Quant Imaging Med Surg 2020; 11: 948–956. doi:10.21037/qims-20-1011.
- Asikgarip N, Temel E, Ornek K. Factors effecting the choroidal vascularity index in children with mild to moderate myopia. Photodiagnosis Photodyn Ther 2021; 37: 102652. doi:10.1016/j.pdpdt.2021.102652.
- Li Z, Long W, Hu Y et al. Features of the choroidal structures in myopic children based on image binarization of optical coherence tomography. Invest Ophthalmol Visual Sci 2020; 61: 18. doi:10.1167/iovs.61.4.18.
- Wolffsohn JS, Kollbaum PS, Berntsen DA et al. IMI - clinical myopia control trials and instrumentation report. Invest Ophthalmol Vis Sci 2019; 60: M132–M160. doi:10.1167/iovs.18-25955.