
ABSTRACT
Clinical relevance
Understanding what aspects of vision or binocular vision may affect learning, and how these are assessed, is important for the eye health care professional assessing children with learning difficulties. It is vital that visual dysfunction is identified or excluded in these patients to ensure targeted and timely intervention.
Background
The aim of this study was to investigate similarities and differences between eye care professionals in the knowledge, attitudes and practice patterns, when evaluating children with learning difficulties.
Methods
This study was a cross-occupational, cross-sectional, predominantly quantitative internet-based survey. Ophthalmologists, optometrists, and orthoptists working in Australia were eligible to participate. A questionnaire comprising of 31 multiple-choice questions with up to 19 additional branching questions was distributed using REDCap in September 2022.
Results
A total of 130 responses were analysed (6 ophthalmologists, 84 orthoptists and 40 optometrists of whom 9 were practicing behavioural vision care). Most respondents assessed distance visual acuity (95%), near stereoacuity (85%), presence of strabismus (88%) and ocular movements (91%). Near vision was assessed less often (65%). Optometrists were most likely to measure colour vision (p < 0.002), accommodation and undertake a subjective refraction (each p < 0.001). Ophthalmologists were least likely to measure convergence (p = 0.041) but more likely to undertake a cycloplegic refraction (p = 0.044). More optometrists practicing behavioural vision care reported testing binocular vision (p = 0.026), fusional vergence (p < 0.001), saccades (p = 0.066), and smooth pursuit (p = 0.050) than other professions. There was a positive correlation between frequency and confidence level when assessing children with learning difficulties (ρ = 0.64). Respondents referred to paediatricians (39%), speech pathologists (30%), educational psychologists (29%) and general practitioners (29%).
Conclusion
Despite similarities across occupations, there were differences in testing the vision and binocular functions of children with learning difficulties. Future research should aim to establish minimum standards for assessing this patient cohort to ensure consistent and relevant assessment.
Introduction
It is believed that 15–20% of children in Australia, irrespective of school or classroom, have a learning difficulty.Citation1 The term learning difficulty is often used to describe when the academic progress of a child is not adequate and they are therefore not meeting the expected standard in literacy or numeracyCitation2,Citation3 however, definitions and methods for identification are variable.Citation4
Learning difficulties can be secondary to student related factors (such as social-emotional difficulties, sensory impairment including hearing or visual impairment, or behavioural and attentional causes), or social and/or environmental factors (such as low socio-economic status, chronic absenteeism or English as an additional language).Citation5–7 Congenital neurological differences can also affect learning and are considered learning disabilities.Citation1
Unlike learning difficulties which may resolve following intervention, learning disabilities are lifelong and will persist despite intervention; they are not a consequence of other factors such as home circumstances, sensory impairment or the school environment.Citation5 Prevalence rates for learning disabilities in Australia are estimated to be between two and four percent.Citation4 Learning disabilities can affect reading, writing and numeracy. Dyslexia is the most common form of specific learning disability, comprising 80%,Citation4 characterised by difficulties with word recognition, poor spelling and decoding.Citation8
When being referred for evaluation of learning difficulties, children are recommended to have a vision testCitation9,Citation10 given visual impairment can affect learning.Citation1 Low vision, convergence insufficiency and poor accommodation have been reported to interfere with the physical act of readingCitation11,Citation12 and should be identified and treated according to standard principles of treatment. Guidelines for assessing children with learning difficulties typically include reading of an age-appropriate text,Citation13 near visual acuity,Citation13 assessment of convergence,Citation13 accommodationCitation13,Citation14 binocular visionCitation14 and eye movements,Citation14 cycloplegic refractionCitation13 and visual information processing assessment.Citation14
Studies of school aged children with learning difficulties have identified a hyperopic tendency,Citation15 reduced fusional ranges,Citation16–18 lower amplitudes of accommodation, reduced accommodative facility, a reduced near point of convergence and a lower accommodative-convergence to accommodation ratio.Citation19 With learning difficulties (specifically poor reading) being risk factors for early school departure,Citation20 anxiety, depression and unemployment as an adult,Citation21 it is important that any ocular dysfunction is identified and treated appropriately, or ruled out as contributing to academic performance prior to investigation into a learning disability. Despite this, to date it remains unknown what aspects of vision and binocular vision are routinely assessed, and which factors determine assessment practices.
The primary purpose of this study was to understand what components of vision and binocular vision are routinely assessed by eye health care professionals in Australia when evaluating children with learning difficulties. Differences within and between eye health care occupations in the tests used to assess these components of vision and binocular vision were also investigated. Secondary aims of the study included investigating the self-reported confidence of clinicians when assessing children with learning difficulties, including any real or perceived barriers to the assessment, and learning more about the circumstances surrounding the vision assessment of a child with a learning difficulty, including cost of assessment, common referral pathways and reporting or communication of findings.
Methods
Study design
This study was a cross-occupational, cross-sectional, predominantly quantitative and exploratory survey. This survey has been reported in accordance with the Consensus-Based Checklist for Reporting of Survey Studies.Citation22 The survey was designed and conducted according to the knowledge, attitude and practice surveys model.Citation23
Ethical approval
The study conformed to the Declaration of Helsinki and was approved by the La Trobe University Human Research Ethics Committee (HEC22241). A participant informed consent statement at the beginning of the survey provided details of the purpose and methodology of the study. Consent was implied by a continuation of the questionnaire after reading this statement.
Participants
Ophthalmologists, orthoptists and optometrists who were working within Australia and were qualified for registration with their professional board were eligible to participate in the study.
Study questionnaire
In the absence of an existing validated tool to address the research question, the questionnaire was developed by the research team consisting of four orthoptists (KEJG, MV, CL, KK) and one biostatistician (MBM). The questionnaire comprised of 31 forced multiple-choice questions with up to 19 additional forced multiple-choice or free text questions for elaboration using branching logic dependent upon answers for the standard questionnaire.
The questionnaire comprised seven different sections; eligibility (Q1–2), participant characteristics (Q3–8), self-reported confidence (Q9–12), service delivery (Q9-13-14, 17–18), clinical assessment (Q15–16), information sharing (Q19) and referral patterns (Q20). Response options for statements relating to self-reported confidence were scored 1 (Strongly Disagree) to 5 (Strongly Agree) on a Likert scale.
Participants were informed that, for the purpose of this study, a child with a learning difficulty was defined as either a child consistently underachieving in reading, writing or mathematics, that has been referred to a learning difficulties clinic, has an independent learning/education plan, or is currently being investigated for or has been diagnosed with a learning disability (dyslexia, dysgraphia, or dyscalculia).
The questionnaire was created using the Research Electronic Data Capture (REDCap) platform (Vanderbilt University, Nashville, TN), a secure web application for building and managing online surveys and databases, hosted by La Trobe University.
The questionnaire was anonymous and estimated to take up to 10 minutes to complete. Two optometrists, two orthoptists and one paediatric ophthalmologist reviewed the questionnaire and provided feedback on the time taken to complete, its clarity, readability, as well as the components of vision and binocular vision, and the specific tests used. The questionnaire was amended after advice on all areas. Feedback was sought from two optometrists practicing behavioural vision care (PBVC) but was not received prior to the survey being distributed. The wording of each questionnaire item is presented in the supplementary material.
Survey distribution
Respondents completed the questionnaire online by accessing a hyperlink. The questionnaire was distributed via email to eye clinics in public hospitals in Melbourne, Sydney, Adelaide, Perth, Brisbane and Darwin. Orthoptics Australia, Optometry Australia and INSIGHT magazine, distributed the survey study in their e-newsletters. The survey was sent directly to approximately 80 ophthalmologists and optometrists where email addresses were publicly available. A link to the survey was shared on LinkedIn (Microsoft Corporation, Sunnyvale, CA) and Twitter (‘X’).
The survey was open for responses from Tuesday the 27th of September until Thursday the 13th of October 2022, for a total of 17 days.
Sample size
An initial recruitment target of at least 40 orthoptists, 40 optometrists, and 15 ophthalmologists was set to detect hypothesised differences between occupations in testing binocular functions (60% vs 30%) and cycloplegic refraction (10% vs 90%) with 80% power and a 5% type 1 error probability. However, recruitment closed at the end of the chosen study period rather than after reaching this target. It was estimated that approximately 7390 eye health care professionals were registered at the time that the survey was distributed.
There were approximately 1,000 full time equivalent ophthalmologists working in Australia in 2019.Citation24 As of May 2022, there were 814 orthoptists registered with the Australian Orthoptic BoardCitation25 and 6,479 optometrists registered with the Optometry Board of Australian Health Practitioner Regulation Agency including a portion of the 450 members of the Australasian College of Behavioural Optometrists.Citation26,Citation27
Data analysis
Only questionnaires from participants who met the eligibility requirements and had no missing data for participant characteristics and level of experience with children with learning difficulties were included in the analyses.
Response distributions were summarised as frequency and percentage for categorical variables, and median and interquartile range for continuous variables with a non-normal distribution. Aspects of vision tested were compared between occupations using the Fisher’s exact test.
Confidence scores for each participant were calculated by averaging responses to five statements related to comfort (‘How comfortable do you feel assessing vision and binocular functions of a child’), expertise (Items relating to own experience and comparisons to colleagues in same practice and other practices), and knowledge (‘I am up to date with current literature’) when assessing children in general and separately for children with learning difficulties.
Statements relating to a lack of ability or confidence (two items relating to comparisons to colleagues) were reverse coded prior to averaging so that scores ranged from one indicating low confidence to five indicating high confidence. For participants who did not provide responses for all items, the scores were derived as the average of the relevant items that were completed.
The correlation between these two confidence scores (for children in general and children with learning difficulties) was quantified via Spearman’s correlation coefficient. Confidence scores were compared between occupations via the Kruskal-Wallis test. No sampling weights were applied. Significance thresholds (alpha) were not adjusted for multiple testing as analyses were considered exploratory.Citation28 Analyses were performed using Stata/SE (v17 StataCorp, College Station, TX).
Results
In total, 181 individuals completed the questionnaire. Forty-four respondents were excluded as they were not currently working in Australia and seven were excluded due to missing data on demographics, leaving 130 responses for inclusion.
Participant characteristics
Six ophthalmologists, 84 orthoptists and 40 optometrists (including 9 optometrists PBVC) were included with an approximate response rate of 1.6% overall. By profession, the response rate was 0.6% for ophthalmologists, 10.3% for orthoptists and 0.6% for optometrists.
provides an overview of their location, region and place of work by occupation. Most of the participants were working in a patient facing role (82%, 107/130). Others worked in research (8%, 11/130), leadership (6%, 8/130) or teaching (3%, 4/130). Experience of the individuals recruited varied from 0.5 to 52 years. Median years [interquartile range, IQR] of experience for participants in each of research (25, IQR 18–36), leadership (25, IQR 14–30) or teaching (27, IQR 19.5–31.5) roles was more than twice that for participants in a patient facing role (12, IQR 4–28).
Table 1. Location, region and place of work by occupation.
Self-reported confidence
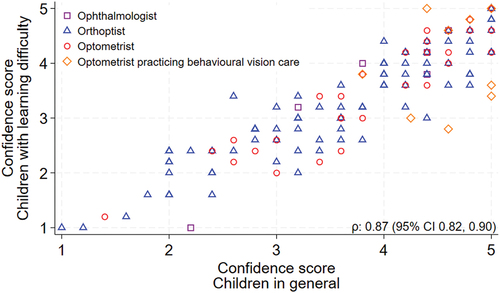
Confidence scores tended to be higher for assessing children in general (median 4, IQR 3–4.6) compared to assessing children with learning difficulties (median 3.6, IQR 2.6–4.2, ). There was a positive correlation between these scores (ρ 0.87, 95% CI 0.82–0.90, ). Confidence tended to be highest among optometrists PBVC, and there was more evidence of differences in confidence between occupations when assessing children in general (p = 0.011) compared to when assessing children with learning difficulties (p = 0.124, ).
Figure 1. Self-reported confidence scores for assessing children in general (left) and children with learning difficulties (right) presented by occupation. Confidence scores were calculated by averaging responses to statements related to comfort, expertise, and knowledge and ranged from one (low) to five (high confidence). Boxes indicate median and interquartile range with whiskers extending to 5th and 95th centiles.
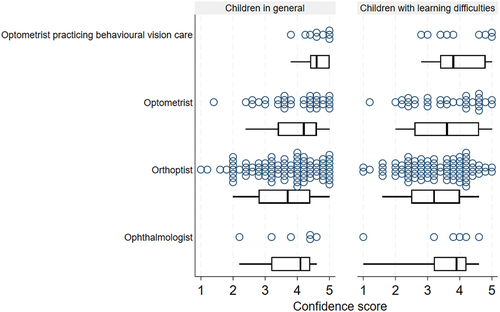
Figure 2. Correlation between self-reported confidence score for assessing children in general and children with learning difficulties. Confidence scores for both ranged from one (low confidence) to five (high confidence). ρ = Spearman’s correlation coefficient.
In general, confidence scores increased as frequency assessing children (ρ = 0.58,95% CI 0.46–0.69) and children with learning difficulties (ρ = 0.62,95% CI 0.53–0.73) increased.
Service delivery
Time and equipment
The majority of clinicians reported, when assessing children in general, that they had enough time (70%, 90/129) and the right equipment (67%, 86/128). Also ample time (58%, 75/130) and adequate equipment (55%, 72/130) when assessing children with learning difficulties.
Cost of assessment
Fifty seven percent (26/46) of the respondents working as an ophthalmologist, optometrist or optometrist PBVC, reported the assessment of a child with learning difficulties always or sometimes cost more. Thirty-four percent (44/130) reported that the increased cost was associated with a longer and more thorough consultation and 28% (37/130) due to providing a detailed report.
Protocols and guidelines
Ophthalmologists did not report following specific guidelines when assessing children with learning difficulties. Only five percent (4/84) of orthoptists followed specific guidelines, compared to 13% of optometrists (4/31) and 44% of optometrists PBVC (4/9). Nine percent of participants (12/130) did not answer this question. Guidelines listed included internal private protocols (3/130), hospital protocols (2/130), Optometric Extension Program 20/21-point technique (2/130), Optometry Australia guidelines (1/130), Australian College of Optometry (1/130), American Optometric Association (1/130) and Vision in Preschoolers (1/130).
Assessment and learning difficulty type
When respondents were asked if their assessment varied depending on whether the learning difficulty is reading-, writing- or numeracy-based, 48% of respondents (62/130) answered that it did ‘always’ or ‘sometimes’. Many respondents (28%, 37/130) reported using a matching card and/or symbols instead of letters or numbers. Several respondents (6%, 8/130) also reported using preferential looking tests or single optotypes instead of linear tests, sometimes for non-verbal patients. Other unique responses (<1%) included prioritising near performance; near vision, accommodation, and convergence (1/130), measuring with an eye tracker (1/130) if the learning difficulty was reading based, testing visual information processing (1/130), visual navigation (1/130) and crowding (1/130).
Clinical assessment
reports the assessment of 18 common clinical areas, by occupation, when evaluating children with learning difficulties. Other components of vision and binocular vision assessed included visual information processing evaluation (4%, 5/130), retinoscopy without cycloplegia (2%, 3/130), retinal imaging (<1%, 1/130), tests of visual cognition (<1%, 1/130), binocular visual acuity (<1%,1/130), Bielschowsky Head Tilt Test (<1%,1/130), corneal topography (<1%, 1/130), assessment of tear film (<1%, 1/130), contrast sensitivity (<1%, 1/130), developmental eye movement test (<1%, 1/130), assessment of body language and behaviour (<1%, 1/130), tracking (<1%, 1/130), visual perception testing (<1%, 1/130), reading assessment on eyegaze equipment (<1%, 1/130) and spatial testing (<1%, 1/130).
Table 2. Components of clinical assessment undertaken when assessing children with learning difficulties by occupation.
Accommodation, convergence and fusional vergence
is an overview of the clinical tests routinely used to measure accommodation, convergence and fusional vergence. Other methods of assessing fusional vergence included 20 prism dioptre reflex test if unable to test with prism bar (2%, 2/130) and the step prism bar (<1%, 1/130).
Table 3. Accommodation, convergence and fusional vergence.
Sensory adaptations/binocular vision
Orthoptists (36%, 30/84), optometrists (42%, 13/31) and optometrists PBVC (67%, 6/9) most often tested binocular vision using the Worths four lights/dots test. Optometrists PBVC (67%, 6/9) also often used a brock string. Orthoptists were more likely to use the Bagolini Striated Glasses test (23%, 19/84). Other methods for assessing binocular vision included bar reading 4% (5/130), Amigo red plate (2%, 3/130), 20 prism dioptre base out reflex test (2%, 2/130), calculation of Accommodative Convergence to Accommodation ratio (2%, 2/130), Howell Card Phoria (2%, 2/130), Lang II StereoTest (<1%, 1/130) and measuring fusional reserves (<1%, 1/130).
Presence/absence of strabismus
The Cover test was the most commonly performed test to assess ocular alignment for all eye health care professionals (86%, 112/130). Optometrists (54%, 17/31) and optometrists PBVC (67%, 6/9) also commonly used the Howell phoria card. Other tests listed included Maddox Wing (7%,9/130), synoptophore (3%, 4/130), stereopsis tests (3%, 4/130), Hirschberg (2%, 3/130), OXO chart (2%, 3/130), and the 4 Prism dioptre test (2%, 2/130).
Stereoacuity
The Titmus fly stereotest was the most commonly used test to assess stereoacuity (59%, 77/130). Ophthalmologists (66.7%, 4/6) and orthoptists (59.5%, 50/84) also commonly used Lang II, optometrists (67.7%, 21/31) and optometrists PBVC (88.9%, 8/9) similarly the Randot stereo test.
Communication/information sharing and referral patterns
Sharing the findings verbally with the parent or guardian attending the consultation was the most common method for all occupations. Individuals stated that they often provided reports on the request of the family.
presents an overview of the health practitioners referred to by occupation. In addition to the professionals listed in , nine respondents referred children with learning difficulties to occupational therapists (7%, 9/130) and two referred to counsellors (2%, 2/130). Other practitioners referred to (each by one clinician, <1%) included neuropsychologists, physiotherapists, chiropractors, kinesiologists, allergists, neuropsychologists, the Education Vision Assessment Clinic at the Royal Victorian Eye and Ear Hospital if vision was reduced and special education needs practitioners. Optometrists PBVC were most likely to refer to a professional not listed in the questionnaire.
Table 4. Referral patterns of eye health care professionals when assessing with children with learning difficulties.
Discussion
In this survey study of eyecare professionals in Australia, it was found that the clinical assessment of children with learning difficulties varied within and between eye health care occupations. There was a difference between occupations in the proportion of respondents usually assessing accommodation, fusional vergence, subjective refraction, colour vision and ocular health.
Optometrists were most likely to measure accommodation. Most eye health care professionals measured convergence, although ophthalmologists did so least. Almost all participants measured stereoacuity at near, tested for the presence of strabismus, and assessed ocular movements. Optometrists PBVC assessed sensory adaptations/binocular vision, fusional vergence, saccades and smooth pursuit more often than any other occupation. Optometrists most often completed a subjective refraction, ophthalmologists were far more likely to perform a cycloplegic refraction.
Whilst paediatricians, educational psychologists and other health professionals request a vision test prior to assessing children with learning difficulties, they do not require a specific set of tests to be undertakenCitation29 and are likely unaware of the variation between clinicians as noted in this study. Despite current guidelines encouraging testing of near vision, accommodation and cycloplegic refraction,Citation13,Citation14,Citation30 these components were not routinely assessed by many participants in this study. For some clinicians, this may be related to their confidence in evaluating children with learning difficulties. Not all respondents felt confident when assessing children with learning difficulties. However, the underlying reasons for this lack of confidence are not apparent from this survey.
It is speculated that this could be due to clinicians not being up to date with current literature, a perceived lack of experience or feeling inferior to colleagues at assessing children with learning difficulties. Future research could explore the drivers of confidence, and if additional training may be needed, either as part of gaining the relevant qualification or continuing professional development.
In assessing children with learning difficulties, it is also important to consider the financial implications for families. The findings of this study indicated that an assessment of a child with learning difficulties, when undertaken by an ophthalmologist or optometrist, typically costs more. Studies have shown that assessments for children with learning disabilities can cost several hundreds of dollars.Citation4,Citation31 Future research could explore the perspective of the parent/guardian and the possible financial burden of the diagnosis of learning difficulty to identify if support is required to assist some families.
While existing clinical practice guidelines recommend children with learning difficulties undergo a comprehensive eye exam, there is a lack of evidence for specific tests and not all relevant stakeholders were consulted during development. Future research is needed to systematically assess the evidence to support the development of guidelines on the aspects of vision and binocular function that should be assessed in this patient cohort.Citation32 Development of such guidelines would require stakeholder involvement including from patients, families, educators, paediatricians, and educational psychologists.
Eye health care professionals consulted should include ophthalmologists, optometrists, and orthoptists, to ensure that a broad spectrum of tests and approaches would be considered. A protocol for assessing this patient cohort could increase the likelihood of children with learning difficulties receiving a consistent, thorough and relevant eye and vision assessment, to allow for early detection of a visual dysfunction that may be affecting learning or to exclude ocular conditions as a contributing factor.
Strengths and limitations
The strengths of this study include the cross-occupational nature of qualified respondents from major cities and regional areas across several states. Children with learning difficulties are assessed by ophthalmologists, orthoptists and optometrists; therefore, it is important that all eye health care professionals were included in the study. To the knowledge of the research team, this is the first cross-occupational study to look at clinical practice patterns in this patient cohort.
The majority of respondents were working in Victoria. It is likely that most clinicians were trained in Melbourne which may be a source of bias if training differs by institution. There were a greater number of orthoptists who completed the survey than any other profession, which is likely due to the study being led by orthoptists. The low response rate from eligible ophthalmologists and optometrists limits generalisability to these occupations.
It is also assumed that due to a self-selection bias, there is an over representation in all occupations of eye health care professionals with an interest in assessing children and children with learning difficulties. Thus, it is possible that less specialised testing is being conducted in the community than what is reported. This is specifically true of the occupations with a small sample size, in this study ophthalmologists and optometrists PBVC. It is possible that the professionals in these groups are less confident and knowledgeable than reported and the differences between occupations are somewhat disproportionate because of this.
Despite the definition of learning difficulty given in the study pre-amble, it is possible that some respondents did not have an in-depth understanding of the condition. This is highlighted by some respondents reporting using preferential looking tests, picture optotypes or single letter optotypes for visual acuity testing in school aged children. This likely indicates an assumption that children with learning difficulties do not have the intellectual ability to perform age-appropriate tests. Among children without developmental delay, including those with learning difficulties/disabilities, it is important that the most suitable test that takes into consideration the age and cognition of the child is performed to meet the clinical needs of the patient.Citation33
Conclusions
To the knowledge of the research team, this is the first study to aid understanding of the clinical practice patterns of eye health care practitioners assessing children with learning difficulties. Specialists requesting eye exams for children underperforming at school should be aware of the variation in testing, costs and reporting that exist. Not all clinicians felt confident in providing this type of service, suggesting additional training may be needed. Minimum standards for assessment of these children are yet to be agreed on. Given the differences observed between occupations in this study, any attempt at developing practice guidelines would ideally have input from representatives across the eyecare sector.
Supplemental Material
Download PDF (2.3 MB)Acknowledgements
The research team acknowledges the assistance of Associate Professor Lauren Ayton with survey design, and Dr Anu Mathew, Mr Damien Watson, Ms Adrienne Farrow and Dr Ebru Efem for their review of the survey, including the components of vision and binocular vision relevant to this research and the clinical tests listed for the related assessments.
Disclosure statement
No potential conflict of interest was reported by the author(s).
Supplementary data
Supplemental data for this article can be accessed online at https://doi.org/10.1080/08164622.2023.2288177.
References
- State of Victoria Department of Education and Training. Learning difficulties information guide - Literacy. 2019 [accessed 2022 Apr 9]. https://www.education.vic.gov.au/Documents/school/teachers/teachingresources/discipline/english/reading/Literacy-Guide.pdf.
- Westwood P. Learning and learning difficulties: approaches to teaching and assessment. London, UK: Taylor & Francis Group; 2004.
- Purdie N, Ellis L. A review of the empirical evidence identifying effective interventions and teaching practices for students with learning difficulties in year 4, 5 and 6. 2005.
- Skues JL, Cunningham EG. A contemporary review of the definition, prevalence, identification and support of learning disabilities in Australian schools. Aust J Learn Difficulties 2011; 16: 159–180. doi:10.1080/19404158.2011.605154.
- State Government of Victoria. Understanding learning difficulties. 2023 Jan 27. https://www.vic.gov.au/understanding-learning-difficulties.
- Harju-Luukkainen H, Vettenranta J, Wang J et al. Family related variables effect on later educational outcome: a further geospatial analysis on TIMSS 2015 Finland. Large-Scale Assess Educ 2020; 8: 3. doi:10.1186/s40536-020-00081-2.
- Gottfried MA. Chronic absenteeism and its effects on students’ academic and socioemotional outcomes. J Educ Stud Placed Risk (JESPAR) 2014; 19: 53–75. doi:10.1080/10824669.2014.962696.
- Lyon GR, Shaywitz SE, Shaywitz BA. A definition of dyslexia. Ann Dyslexia 2003; 53: 1–14. doi:10.1007/s11881-003-0001-9.
- Monash Children’s Hospital. Monash Children’s Hospital referral guidelines paediatrics. 2019 [accessed 2022 May 17]. https://monashchildrenshospital.org/wp-content/uploads/2019/06/monash-childrens-hospital_general-paediatrics-referral-guidelines_june19.pdf.
- Royal Children’s Hospital Melbourne. Learning difficulties - school problems, initial work-up. 2022 May 17. https://www.rch.org.au/kidsconnect/prereferral_guidelines/Learning_difficulties_school_problems/.
- American Academy of Ophthalmology, American Association for Pediatric Ophthalmology and Strabismus, American Academy of Pediatrics et al. Joint statement - learning disabilities, dyslexia and vision. Pediatrics 2009; 124: 837–844. doi:10.1542/peds.2009-1445.
- The Royal Australian and New Zealand College of Ophthalmologists. Learning disabilities, dyslexia and vision. 2018 [accessed 2022 Jun 1]. https://ranzco.edu/policies_and_guideli/learning-disabilities-dyslexia-and-vision/.
- Handler SM, Fierson WM. Learning disabilities, dyslexia, and vision. Pediatrics 2011; 127: 818–856. doi:10.1542/peds.2010-3670.
- American Optometric Association evidence-based optometry guideline development group. Comprehensive pediatric eye and vision examination. American Optometric Association; 2017 [accessed 2022 Oct 27]. https://www.aoa.org/AOA/Documents/Practice%20Management/Clinical%20Guidelines/EBO%20Guidelines/Comprehensive%20Pediatric%20Eye%20and%20Vision%20Exam.pdf.
- Quaid P, Simpson T. Association between reading speed, cycloplegic refractive error, and oculomotor function in reading disabled children versus controls. Graefes Arch Clin Exp Ophthalmol 2013; 251: 169–187. doi:10.1007/s00417-012-2135-0.
- Wulff J. The standard of vergence eye movements in children with reading difficulties. Aust Orthod J 2004; 38: 8.
- Christian LW, Nandakumar K, Hrynchak PK, et al. Visual and binocular status in elementary school children with a reading problem. J Optom 2018; 11: 160–166. doi:10.1016/j.optom.2017.09.003.
- Palomo-Álvarez C, Puell MC. Binocular function in school children with reading difficulties. Graefes Arch Clin Exp Ophthalmol 2010; 248: 885–892. doi:10.1007/s00417-009-1251-y.
- Dusek W, Pierscionek BK, McClelland JF. A survey of visual function in an Austrian population of school-age children with reading and writing difficulties. BMC Ophthalmol 2010; 10: 16. doi:10.1186/1471-2415-10-16.
- Hakkarainen AM, Holopainen LK, Savolainen HK. A five-year follow-up on the role of educational support in preventing dropout from upper secondary education in Finland. J Learn Disabil 2015; 48: 408–421. doi:10.1177/0022219413507603.
- Undheim AM. Dyslexia and psychosocial factors, a follow-up study of young Norwegian adults with a history of dyslexia in childhood. Nord J Psychiatry 2003; 57: 221–226. doi:10.1080/08039480310001391.
- Sharma A, Minh Duc NT, Luu Lam Thang T, et al. A consensus-based checklist for reporting of survey studies (CROSS). J Gen Intern Med 2021; 36: 3179–3187. doi:10.1007/s11606-021-06737-1.
- World Health Organization. Advocacy, communication and social mobilization for TB control: a guide to developing knowledge, attitude and practice surveys. 2008
- Australian Institute of Health and Welfare. Eye health. 2021 [accessed 2022 Jun 2]. https://www.aihw.gov.au/reports/eye-health/eye-health/contents/treatment-and-management.
- Australian Orthoptic Board. Register of qualified orthoptists. 2022 Jun 6. https://www.australianorthopticboard.org.au/Registration/Registration.html.
- Optometry Board Australian Health Practitioner Regulation Agency. Registration data table. 2022 Jun 1 https://www.optometryboard.gov.au/about/statistics.aspx.
- Australasian College of Behavioural Optometrists. Status report 2018/19. 2019 [accessed 2022 Jun 1]. https://www.acbo.org.au/images/News_Views_FAQs/ACBO_Status_Report_2018_19.pdf.
- Betensky R. The p-value requires context, not a threshold. Am Stat 2019; 73: 115–117. doi:10.1080/00031305.2018.1529624.
- Whiting K. Investigating the child with learning difficulty. Curr Pediatr 2001; 11: 240–247. doi:10.1054/cupe.2001.0195.
- American Academy of Pediatrics, American Association for Pediatric Ophthalmology and Strabismus, American Academy of Ophthalmology et al. Joint statement: learning disabilities, dyslexia and vision - reaffirmed 2014. American Academy of Ophthalmology; 2019 [accessed 2023 Jul 23] https://www.aao.org/education/clinical-statement/joint-statement-learning-disabilities-dyslexia-vis.
- Sexton CC, Gelhorn HL, Bell JA, et al. The co-occurrence of reading disorder and ADHD: epidemiology, treatment, psychosocial impact, and economic burden. J Learn Disabil 2012; 45: 538–564. doi:10.1177/0022219411407772.
- Brouwers MC, Kerkvliet K, Spithoff K. The AGREE reporting checklist: a tool to improve reporting of clinical practice guidelines. BMJ 2016; 352: i1152. doi:10.1136/bmj.i1152.
- American Academy of Ophthalmology. Pediatric eye evaluations preferred practice pattern. 2017 [accessed 2022 Oct 11]. https://www.aao.org/preferred-practice-pattern/pediatric-eye-evaluations-ppp-2017.