ABSTRACT
Clinical Relevance
With an ageing population, ophthalmologists are becoming burdened with glaucoma management, and patient care can be delayed. Therefore, the use of optometrists in glaucoma management can help alleviate the burden.
Background
The ageing population and subsequent rise of glaucoma prevalence are putting a strain on the public health system in New Zealand. Glaucoma collaborative care between optometrists and ophthalmologists has been gaining support with the aim to reduce this burden on ophthalmologists. There has been little investigation of the agreement in care and management of mild-to-moderate severity glaucoma patients by optometrists and ophthalmologists.
Methods
One hundred and three glaucomatous eyes were used in a survey where clinical history and examination, intraocular pressures (IOPs), visual field testing and optical coherence tomography (OCT) imaging were evaluated for glaucoma progression and decision-making regarding subsequent management by four participants. Two participants were glaucoma-credentialled optometrists (Group 1), and the other two were glaucoma specialists (Group 2).
Results
With respect to glaucoma progression, Spearman coefficients identified strong agreement between the two groups for IOP, visual fields and overall status and moderate agreement for OCT imaging. A confusion matrix was used to analyse management and found 80% ± 10% agreement between the two groups. Review periods gave an agreement of 55% ± 20% between the two groups.
Conclusion
There was strong agreement in the assessment of glaucoma progression between the two groups. The 80% level of agreement for subsequent management between the two groups is comparable to other published reports. These results provide some reassurance that a collaborative care system can perform safely and as intended.
KEYWORDS:
Introduction
Glaucoma is a leading cause of irreversible blindness worldwide. Approximately 76 million people live with glaucoma in 2020, with this number expected to increase to 111.8 million by 2040.Citation1,Citation2 With an increase in the life expectancy of the population, the demand for glaucoma care is set to rise.Citation3
Eighty per cent of glaucoma patients in New Zealand were diagnosed with no prior suspicion of glaucoma, highlighting the asymptomatic nature of the disease.Citation4 The perception of society of optometry as retail-oriented versus being a healthcare provider which can affect the perception of the validity of the recommendation of optometrists of further tests in glaucoma management.Citation3
The burden on ophthalmologists can be reduced by sharing the responsibility with optometrists, particularly in patients with mild-to-moderate disease.Citation5 Other disciplines such as ophthalmic nurses and orthoptists could be considered for this role in glaucoma care, but given optometrists already have a strong background in ocular pathology including glaucoma, there is comparably less extra training required.Citation6 For optometrists to take a role in assessing disease stability and make changes in management, the agreement with the decisions by ophthalmologists needs to be assessed. It is important that glaucoma care becomes more efficient, but not at the expense of the quality of patient care.Citation5,Citation7
A UK study looking at registered optometrists in their clinical judgements of glaucoma reported the need to have training and accreditation as a fundamental prerequisite for optometrists to participate in glaucoma management.Citation8 Additionally, Barrett et al. demonstrated a strong association between the confidence of optometrists in identifying glaucoma in those with additional training and post-graduate training in glaucoma and further post-graduate training in glaucoma.Citation3 A study of Australian and New Zealand optometrists identified that a randomised short four-hour glaucoma teaching module resulted in insufficient improvement in glaucoma judgements.Citation9 This study recognised that this module was similar to short continuing education meetings and that a longer glaucoma credentialling programme was needed to see sufficient improvements.
Optometrists in New Zealand with the Therapeutic and Pharmaceutical Agents scope of practice became able to prescribe medications in 2005 as Designated Prescribers, which restricted the prescribing to a specific list of medications.Citation10 In 2014, optometrists became Authorised Prescribers under the Medicines Amendment Act 2013 allowing them to prescribe glaucoma medications.Citation10 To manage glaucoma, optometrists had to undergo additional training stipulated by the Optometrists and Dispensing Opticians Board.
In 2015, the Department of Ophthalmology at the University of Auckland introduced a six month supervised training programme for optometrists, which exceeds the training specified by the Board. During this training, optometrists completed a minimum of 20 weeks, equivalent to 80 hours of training where they saw glaucoma patients under the supervision of a glaucoma sub-specialist ophthalmologist.
This study evaluated the agreement in the assessment of glaucoma progression and management between optometrists who have completed the additional glaucoma training compared to two sub-speciality trained glaucoma ophthalmologists. To date, there is no literature available regarding the glaucoma agreement between optometrists and ophthalmologists in New Zealand.
The Palmerston North Eye Clinic in New Zealand introduced a stable glaucoma clinic with the aim of reducing the burden on ophthalmologists. The stable glaucoma clinic is run by optometrists, and it has been reported that patient waiting times were reduced significantly from an average of approximately 4 months to just 6 weeks.Citation11 This translates to better patient outcomes in the effort to preserve vision. The reduced delay between appointments allows uncontrolled or progressive glaucoma to be detected and management altered in cases of non-compliance which were estimated to be as high as 80%.Citation12
Methods
Participants
Fifty-two patients with glaucoma were recruited from the Auckland District Health Board over a three-month period. The inclusion criterion was patients with glaucoma that had been deemed previously stable and had already been selected by ophthalmologists to be seen in the stable glaucoma clinic. Patients with progressive or advanced glaucoma were excluded from this clinic. Of the 52 patients recruited, 103 eyes were included. One eye was excluded for having end-stage macular degeneration where the eye was beyond treatment.
The average age of the patients was 69.5 years (ranging from 42 years to 93 years). The patients consisted of 29 males (55.7%) and 23 females (44.2%). Out of the 103 eyes, 52 had primary open-angle glaucoma (50.5%), 22 had normal-tension glaucoma (21.3%), 3 had a history of angle-closure glaucoma (2.9%), 6 had mixed mechanism glaucoma (5.8%), and 1 had secondary glaucoma (0.97%). The remaining 19 eyes (18.4%) included patients with pre-perimetric glaucoma, ocular hypertension or narrow drainage angles. In terms of current medical management, 20 eyes were on no treatment (19.4%), 41 eyes on monotherapy (39.8%), 40 eyes on dual therapy (38.8%) and two eyes were on triple therapy (1.94%).
This research was approved by the University of Auckland Human Participants Ethics Committee including participants giving informed consent to participate in the study, the option to withdraw consent and confidentiality of the collected study data.
The clinicians reviewing the data in this study comprised two optometrists (group one) and two ophthalmologists (group two). Both the optometrists were approved by the Optometrists and Dispensing Opticians Board as independent glaucoma prescribers and had completed the six-month advanced-level glaucoma training programme run through the University of Auckland Ophthalmology Department and the Auckland District Health Board. Both ophthalmologists had completed fellowship training in glaucoma. One ophthalmologist received their training in New Zealand and the second in the United Kingdom. Both optometrists completed their advanced-level glaucoma training under the supervision of one of the ophthalmologists participating in this survey.
Clinical data collection
Clinical data were deidentified and included clinical records, letters, optical coherence tomography (OCT) images, intraocular pressure (IOP) readings and visual fields. The patients were seen in a glaucoma subspeciality clinic, overseen by the same consultant glaucoma specialist, however these patients may have attended different clinical sites. Therefore, a variety of instruments were used including the Zeiss HFA-II 750 (Carl Zeiss, Jena, Germany), Zeiss HFA-II 720, Zeiss HFA 3, Heidelberg Spectralis OCT (Heidelberg Engineering, Heidelberg, Germany), Revo Nx OCT (Optopol, Zawiercie, Poland), and the Nidek RS-3000 Advance OCT (Nidek, Aichi, Japan).
The most recent three OCT and visual field reports were obtained for each eye, which could have been obtained from a combination of the listed instruments. The clinical information available to the four reviewing clinicians was therefore varied and derived from different instruments but represented the actual clinical information that was available on which to base clinical decisions. It was the ‘real world’ of the current and past assessments of these patients.
Information from the patients was collated into a summarised format. OCT and visual field reports were organised in a timeline from oldest to most recent. OCT scans of poor quality were excluded if there was another scan available to achieve three, if there were no other scans available, then the scan was included despite its quality.
Research design
The design of the study was based on the work by Shah et al. and was conducted using an online survey (Qualtrics, Provo, USA) survey.Citation7 Each of the 52 cases contained a summary of the clinical history of the participant, including demographics, visual acuity, previous and current treatments, allergies, central corneal thicknesses and target IOPs when available.
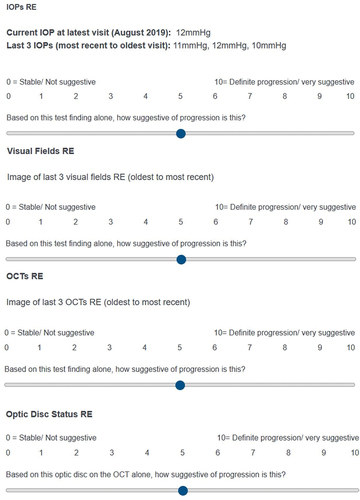
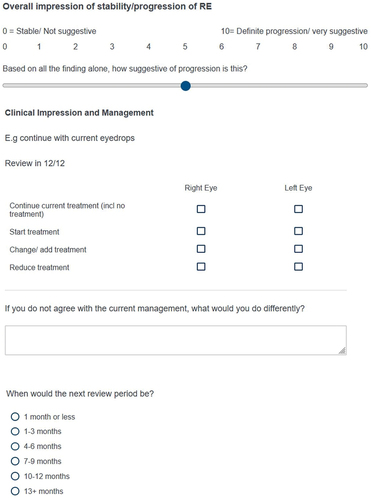
The optometrists and ophthalmologists were asked to grade the likelihood of progression on an 11-point scale from 0 to 10 based on the current and last three IOPs for each individual eye. On this scale, 0 represents stable/no progression and 10 represents definite progression. The same scale was used to judge the last three visual fields, OCT, optic disc status, and the overall status of each eye individually. An example of the grading scale is shown in the appendix.
For management, there were checkboxes for each eye indicating whether to continue current treatment, start treatment, change/add treatment, or reduce treatment. The boxes were ticked for each eye individually, and there was a text box to complete if the researcher considered a change was necessary. Finally, a multiple-choice question was included regarding when the next review visit was recommended.
Both eyes from the 52 patients, except for one patient with advanced macular degeneration, were individually assessed and treated separately for the entirety of the survey. The review period was determined for each patient by combining the assessment of both eyes individually. The researchers were blinded to the assessments made by each other.
Data analysis
The Qualtrics data was exported into an Excel (Microsoft Corporation) spreadsheet. The information from each of the grading scales (IOPs, visual fields, OCTs, optic disc status, overall status) was arranged under the participant titles – Optom 1, Optom 2, Ophthal 1 and Ophthal 2. The averages of the gradings of each category for each participant were gathered, and a scatter plot was created. Spearman coefficients were generated for each assessment using the CORREL function on Excel after each participant had their answers ranked using the function RANK.AVG. The Excel CORREL function compares the two optometrists (array 1) with the two ophthalmologists (array 2). This generates a number between −1 and +1, where −1 indicates a perfect negative correlation and +1 indicates a perfect positive correlation. The p-values were calculated and a threshold of <0.05 was deemed statistically significant. The Spearman coefficient was analysed using the Prion & Haerling scale.Citation13
For the management and review period where checkboxes were involved, confusion matrices were plotted using the COUNTIFS function on Excel. Six matrices for each pairing of participants were created, and conditional formatting was used to highlight where the agreements or disagreements occurred. The agreement of each confusion matrix was calculated as a percentage. The average agreement percentage of the optometrist and ophthalmologist pairings was used to indicate the agreement between groups for both management and review period.
As there were multiple-clinic sites involved, there was a possible option of three OCT machines used. The clinicians involved in the study reported this was difficult in analysing the results from three different machines. On analysis of the preliminary responses of the OCT results by the clinicians, only patients with two or more OCTs from the same instrument were used in the final analysis.
Results
shows that generally the patients with glaucoma recruited were more stable than progressing given the averages are all below five on the y-axis scale. This was expected given the patients were selected from a stable glaucoma clinic.
Figure 1. Scatter plot illustrating the agreement between participants for each of the relevant tests in determining glaucoma progression in addition to an overall impression.
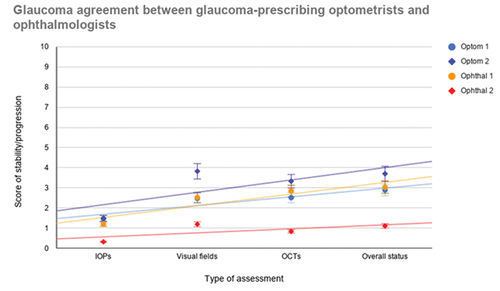
shows the trend line which suggests that Optometrist 1 and Ophthalmologist 1 agree best, with Optometrist 2 also showing good agreement except for visual fields, where Optometrist 2 inferred the visual fields to be more suggestive of progression across patients. Ophthalmologist 2 tended to score low across patients indicating stability, with less evidence of progression.
illustrates that the best agreement is for IOP and visual fields followed by overall status and lastly OCT imaging. OCT imaging originally showed moderate disagreement between the two groups of researchers, with a negative rho value. The researchers reported difficulty in analysing the progression of glaucoma based on some OCT images of patients where multiple-OCT instruments were used. There were four different OCT imaging instruments involved in this survey. For this reason, it was decided that the use of the OCT imaging would be revised and that a calculation of the Spearman coefficient for the scores of the patients who had at least two OCT scans from the same instrument would be used. This excluded 13 patients (26 eyes) resulting in the scores of just 39 patients (77 eyes) to be analysed. This amendment resulted in a reversal of the Spearman rho coefficient giving +0.53 which shows moderate agreement.
Table 1. Spearman values comparing the optometrist pair with the ophthalmologist pair for each of the three glaucoma assessments and overall status.
The p-value was calculated to determine whether the value of rho observed differs significantly from zero. A rho value of zero would indicate that there is no correlation (null hypothesis). For each assessment comparing between optometrists and ophthalmologists, the p-value is statistically significant being <0.05. Thus, it is likely that there is a correlation/agreement between the two groups regarding glaucoma management.
shows that the average agreement between optometrists and ophthalmologists is 80% ± 10%. This is a strong agreement, particularly between ophthalmologist 1 and the two optometrists, who were trained by this ophthalmologist.
Table 2. Glaucoma management confusion matrices for each participant pairing and their agreement comparisons.
shows an average agreement of review periods of 55% ± 20%. The low end of the agreements is with ophthalmologist 2 who tended to opt for longer review periods than the other participants.
Table 3. Glaucoma review period confusion matrices for each participant pairing and their agreement comparisons.
Discussion
This pilot study demonstrated a high level of agreement in the assessment of glaucoma progression and management between optometrists that have completed additional training and ophthalmologists. The results of this study provide reassurance that this collaborative care model can be performed safely.
The role of an optometrist in glaucoma management is not new, with reports looking into the agreement between optometrists and ophthalmologists. In an United Kingdom (UK) study, the percentage agreement with kappa between the ophthalmologist and optometrists was 68.5% for visual fields, 64.5% for optic discs, and 84.5% for intraocular pressure (IOP).Citation15 For medical management, the agreement was 96.5%.Citation5
The Peterborough Scheme in the UK assessed the agreement of two tiers of optometrists with an ophthalmologist. The higher tier of optometrists can be likened to the two advanced optometrists participating in this study. For glaucoma diagnosis, the higher tier optometrists had 64.6% agreement with the ophthalmologist, compared with 47.5% for the lower tier optometrists. Similarly, for agreement in management, there was 69.5% and 49.1% agreement for higher and lower tiers, respectively. This study demonstrated a moderate level of agreement but further highlighted the advantage of having more experienced optometrists.Citation16
Shah et al. reported the agreement between optometrists and ophthalmologists for glaucoma progression was 54.4%.Citation7 They also identified that ophthalmologists used OCT analysis significantly more than optometrists to determine glaucoma progression. This study also investigated the agreement within the two disciplines. In the assessment of glaucoma progression, agreement between ophthalmologists was 78.7% and between optometrists was 74.2%. At present, there is no definitive guidance on what level of agreement should be considered safe.Citation16
This study does have limitations, including its retrospective nature. The optic disc status based on optic disc photography had to be excluded due to poor image quality or the absence of stereoscopic disc photographs for many patients. It was decided that it would be unrealistic to make assessments based on black-and-white imaging and/or a two-dimensional optic disc photography, which was all that was available for the majority of patients. However, the use of optic disc images or RNFL images was considered ‘good’ by Tuulonen et al.Citation17 Whereas the use of both optic disc images and RNFL images was considered ‘very good’.Citation17
Upon further review with the participants, there was also uncertainty about what to select when there was insufficient information or poor-quality data. One participant expressed they clicked zero, whereas another participant tended to go for the middle and selected five on the grading scale. This could have had an impact on the results, although it is understood that this was only the case for a few patients, meaning that this issue is unlikely to have skewed the results significantly. The reality for the clinicians who see these patients in these clinics is that the clinical data available does not regularly include disc photographs, so they are already making management decisions without them. This study therefore reflects how these clinics are operated.
The two optometrists selected are perhaps unrepresentative of the 110 board-approved glaucoma-accredited optometrists in New Zealand as they had undergone the six-month additional training. Both of these optometrists also actively participate in the Auckland District Health Board and Counties Manukau District Health Board glaucoma clinics on a regular basis. Future research is required to investigate the agreement of the group of board approved optometrists who do not have the additional fellowship-level training.
A variety of instruments was used between the various clinic sites where these patients had previously been seen. For the visual field data, three different visual field instruments had been used, but they were all models of the Zeiss Humphrey Field Analyser and so the data was considered comparable. Furthermore, the use of different technicians on different equipment has the possibility to introduce variability of some results. This study demonstrated that when using the same OCT instrument, significantly better agreement is seen.
Standardising equipment would also allow automated progression analysis to also be performed, which would likely further improve agreement results. Again though, these potential variabilities are a reality in these clinics and so represent ‘real world’ conditions. It would be beneficial for follow-up appointments to be arranged at the same location as previous appointments for consistent data collection and improved diagnostic accuracy.
As the clinical data was exported to Qualtrics, the clinicians were not able to take advantage of the manufacturer’s software for analysing visual fields and OCTs. The standard report templates were exported from the software and uploaded to Qualtrics. The use of such software allows the user to examine the image registration, layer segmentation and noise to improve diagnostic accuracy. However, all the clinicians involved in the study all had access to the same clinical information.
The psychology of undertaking surveys plays a role. There are two common survey response styles, extreme and non-extreme. The extreme response style occurs when a participant tends to select one end of the scale, for example, a 0 or 10 in this survey.Citation18 This appeared evident for Ophthalmologist 2 where they tended to choose zero and led to their low averages observed in . The nature of patient selection in this research meant that the patients were more stable, meaning that few tens were applicable to outweigh the zeros selected.
The non-extreme response style occurs when a participant actively avoids selecting the ends of the scale, thus opting for one or two on the scale even when they believe the patient to be stable.Citation18 This could be due to cultural or ethnic differences.Citation19 The response styles exhibited in this survey can influence the variance of results. Although it is suspected that these response styles were present, the survey still achieved strong agreement for every aspect of glaucoma assessment except OCT imaging and review periods.
The formatting of the survey meant that once a participant had completed a block of five patients they could not go back and review their answers. This meant that participants may not have worked out in their minds what a score 0 and 10 meant to them in comparison with more patients. For example, the participant could have selected 0 for a patient early in the survey but realises later that that patient is more representative of a 2 when they see patients that fit the 0 criteria more. It is unlikely that this has impacted the results significantly, and arguably this formatting is truer of real practice where you cannot easily go back and review patients seen earlier on. However, in future studies, a protocol should be developed to train the researchers regarding the scale prior to conducting the study.
The assessments of intraocular pressure, visual fields and OCT imaging have a subjective element. However, this research shows that these differences in judgement of progression may not necessarily give a difference in management. This led to the high agreement in management between optometrists and ophthalmologists of 80% ± 10%. The high level of agreement between the two optometrists and Ophthalmologist 1 is likely because they have worked with and been taught under their supervision. Over time, this has led them to develop similar decisions and judgements to Ophthalmologist 1.Citation20 Furthermore, the two optometrists have not worked directly under Ophthalmologist 1 for a few years now, so those initial learnings have been retained.
The main disagreements occurred where optometrists were perhaps more cautious and opted to continue treatment and have shorter review periods, whereas ophthalmologists were more comfortable to reduce treatment and extend review periods. The disagreement was especially apparent between Optometrist 2 and Ophthalmologist 2 who had the lowest agreement in these areas of judgement. This more guarded approach by optometrists is consistent with other research reported.Citation5,Citation21 In a shared-care environment where patients are seen by different eye health professionals at each visit, opting for a more cautious approach is understandable. However, there are economic costs and a psychological element to consider when patients are attending appointments more frequently than needed.Citation5
The disagreement between the two ophthalmologists occurred disproportionately around normal-tension glaucoma patients. This could be explained by the training of the ophthalmologists. In the United Kingdom, there is an emphasis on monitoring off-treatment until progression is proven, particularly in older patients.Citation22 The New Zealand trained ophthalmologist may have had a more cautious approach, initiating treatment at an earlier stage of the disease process.
In conclusion, this study gives reassurance that optometrists with appropriate training can be expected to make similar decisions to sub-speciality trained glaucoma ophthalmologists, providing a safe collaborative care model for patients in a stable glaucoma clinic. The study structure also shows the value of optometrists being able to access support from ophthalmologists when progression is suspected. However, further research is required to examine the agreement level in a greater sample of optometrists in New Zealand.
Disclosure statement
No potential conflict of interest was reported by the author(s).
References
- Allison K, Patel D, Alabi O. Epidemiology of glaucoma: the past, present, and predictions for the future. Curēus (Palo Alto, CA) 2020; 12: e11686. doi:10.7759/cureus.11686.
- Tham Y-CBH, Li XB, Wong TYFP et al Global prevalence of glaucoma and projections of glaucoma burden through 2040. Ophthalmology 2014; 121: 2081–2090. doi:10.1016/j.ophtha.2014.05.013.
- Barrett C, O’Brien C, Butler JS et al. Barriers to glaucoma case finding as perceived by optometrists in Ireland. Clin Exp Optom 2017; 101: 90. doi:10.1111/cxo.12573.
- LaHood BR. High rate of incidental glaucoma detection in New Zealand. NZ Med J 2016; 129: 33–37.
- Marks JR, Harding AK, Harper RA et al. Agreement between specially trained and accredited optometrists and glaucoma specialist consultant ophthalmologists in their management of glaucoma patients. Eye 2012; 26: 853–861. doi:10.1038/eye.2012.58.
- Banes MJ, Culham LE, Crowston JG et al. An optometrist’s role of co-management in a hospital glaucoma clinic. Ophthalmic Physiol Opt 2000; 20: 351–359. doi:10.1046/j.1475-1313.2000.00527.x.
- Shah S, Choo C, Odden J et al. Provider agreement in the assessment of glaucoma progression within a team model. J Glaucoma 2018; 27: 691–698. doi:10.1097/IJG.0000000000000994.
- Harper R, Radi N, Reeves BC et al. Agreement between ophthalmologists and optometrists in optic disc assessment: training implications for glaucoma co-management. Graefes Arch Clin Exp Ophthalmol 2001; 239: 342–350. doi:10.1007/s004170100272.
- Yoshioka N, Wong E, Kalloniatis M et al. Influence of education and diagnostic modes on glaucoma assessment by optometrists. Ophthalmic Physiol Opt 2015; 35: 682. doi:10.1111/opo.12247.
- Ng RJ, Martis RM. Medical optometry: a new term to describe the therapeutic scope in Australia and New Zealand. Clin Exp Optom 2021; 104: 532–534. doi:10.1080/08164622.2021.1878840.
- Botha VE, Taylor SK, Benefield J et al. Approach to collaborative glaucoma care in New Zealand: an update. Clin Exp Ophthalmol 2019; 47: 798–799. doi:10.1111/ceo.13485.
- Botha VE, Ah-Chan J Taylor SK et al. Collaborative glaucoma care. Clin Exp Ophthalmol 2015; 43: 480–483. doi:10.1111/ceo.12479.
- Prion S, Haerling KA. Making sense of methods and management: spearman-rho ranked-order correlation coefficient. Clin Simul Nurs 2014; 10: 535–536. doi:10.1016/j.ecns.2014.07.005.
- Bowling B, Chen SDM, Salmon JF. Outcomes of referrals by community optometrists to a hospital glaucoma service. Br J Ophthalmol 2005; 89: 1102–1104. doi:10.1136/bjo.2004.064378.
- Bourne R, French KA, Chang L et al. Can a community optometrist-based referral refinement scheme reduce false-positive glaucoma hospital referrals without compromising quality of care? The community and hospital allied network glaucoma evaluation scheme (CHANGES). Eye 2010; 24: 881–887. doi:10.1038/eye.2009.190.
- Roberts HW, Rughani K, Syam P et al. The Peterborough scheme for community specialist optometrists in glaucoma: results of 4 years of a two-tiered community-based assessment and follow-up service. Curr Eye Res 2015; 40: 690–696. doi:10.3109/02713683.2014.957326.
- Tuulonen A, Airaksinen PJ, Erola E et al. The Finnish evidence-based guideline for open-angle glaucoma. Acta Ophthalmol Scand 2003; 81: 3–18. doi:10.1034/j.1600-0420.2003.00021.x.
- Liu M, Harbaugh AG, Harring JR et al. The effect of extreme response and non-extreme response styles on testing measurement invariance. Front Psychol 2017; 8: doi:10.3389/fpsyg.2017.00726.
- Wang R, Hempton B, Dugan J et al. Cultural differences: why do Asians avoid extreme responses? Surv Pract 2008; 1: 1. doi:10.29115/SP-2008-0011.
- Ho S, A Vernon S. Decision making in chronic glaucoma – optometrists vs ophthalmologists in a shared care service. Ophthalmic Physiol Opt 2011; 31: 168–173. doi:10.1111/j.1475-1313.2010.00813.x.
- Gray SF, Spry PGD, Brookes ST et al. The Bristol shared care glaucoma study: outcome at follow up at 2 years. Br J Ophthalmol 2000; 84: 456–463. doi:10.1136/bjo.84.5.456.
- King AA, Azuara-Blanco A, Tuulonen A. Glaucoma. BMJ 2013; 346: f3518. doi:10.1136/bmj.f3518.
Appendix
Grading Scales