
ABSTRACT
Clinical relevance
Factors predicting patient acceptance of a new spectacle prescription need to be determined to make optimal prescribing decisions.
Background
Clinicians usually prescribe for best visual acuity. However, for some patients, a partial change is prescribed to ease adaptation, despite providing suboptimal visual acuity. This study seeks to develop an understanding of which factors predict patient preference between spectacle prescriptions by using a retrospective analysis to compare ease of adaptation, subjective quality of distance vision and optimal distance visual acuity.
Methods
A retrospective analysis utilised a 196-patient data set in which participants wore two prescriptions, one based on the subjective refraction of an optometrist modified by judgement and one on autorefractor results modified for ease of adaptation by an algorithm. Spectacles were worn for 3 weeks each, and participants responded to questions about which prescription they preferred and their quality of distance vision and ease of adaptation (on a 0–10 scale) with each prescription. A logistic regression analysed which variables predicted whether participants responded yes or no to the question ‘If you had purchased these spectacles for $100 (US$200 adjusted to 2023 value), would you be happy with them?’
Results
There was a significant difference between the preferred and non-preferred prescriptions for the subjective quality of distance vision rating (medians 9 vs. 8; Z = –7.80, p < 0.0001) and ease of adaptation rating (medians 8 vs. 5; Z = –8.32, p < 0.0001) but the distance binocular visual acuity was not significantly different (both means = –0.09 logMAR; Z = –0.60, p = 0.55). Of all participants, 94% preferred the prescription deemed easier to adapt to but only 59% preferred the prescription with better subjective quality of distance vision and best visual acuity.
Conclusion
Distance visual acuity was not found to be a useful predictor of participant preference to a new prescription and is likely over-relied upon in practice. The results support the adjustment of the subjective prescription where appropriate to aid patient adaptation and comfort.
Introduction
Typically, subjective refraction from an ophthalmic examination is used, unaltered, as the prescription in a new pair of spectacles, with the goal being to provide patients with the best binocular distance visual acuity. However, there are several papers and textbooks that recommend modifying the subjective refraction to aid adaptation (or comfort) with new spectacles for some patients.Citation1–8 Modified refractive changes can mean that new spectacles do not provide the best possible distance visual acuity. This can be a source of concern, particularly for inexperienced optometrists, who have been shown to rarely use prescribing rules and predominantly prescribe the subjective refraction results.Citation5
The evidence to indicate that new spectacles must provide the best possible distance visual acuity is limited. Two studies have investigated how acceptable participants found spectacles that contained a variety of dioptric errors from the subjective refraction result. Miller et al. reported that participants were able to detect, and were dissatisfied with, deliberately induced refractive errors as little as +0.25 DS, despite these small induced errors not significantly affecting distance visual acuity (logMAR).Citation9 In a follow-up paper, Atchison et al. found none of a range of clinical tests, including distance visual acuity, predicted lens acceptance and concluded that these clinical tests ‘are not good predictors of … … tolerance to lens errors’.Citation10 Both studies concluded that the clinical practice of refining refractive correction to 0.25 DS was appropriate. They could have equally concluded that the acceptability of new spectacles is not necessarily determined by the best distance visual acuity.
In this study, a retrospective data analysis was performed of an earlier study in which 196 participants wore single vision distance spectacles with two different prescriptions, each for 3 weeks, and provided feedback about their preference between the two prescriptions and whether they would be happy with the spectacles if they had purchased them. An investigation was undertaken to determine whether binocular distance visual acuity, subjective ease of adaptation and subjective quality of distance vision best predict patient preference to a single vision distance prescription.
Methods
Summary of original study
The original data were taken from a randomised clinical trial to investigate patient acceptance of spectacles with prescriptions based on modified autorefractor and clinician refractions based in a university eye clinic in Berkeley, United States.Citation11 Participants between 17 and 60 years of age were eligible. Contact lens wearers, optometry students, participants with acuities worse than 20/30 in either eye and individuals with systemic diseases affecting refractive error, e.g. diabetes, were excluded. Presbyopes were eligible to participate on the understanding that only single vision distance spectacles could be prescribed and dispensed. A total of 204 participants aged between 17 and 57 (mean = 33 ± 9) underwent a comprehensive eye examination by one of the four study optometrists.
The refraction component of the exam comprised retinoscopy, Jackson cross-cylinder and binocular balancing. The optometrists were permitted to insert trial lenses into a trial frame as part of the final determination of the subjective refraction. No instructions were given regarding modifying the subjective prescription in line with common ‘prescribing rules’ to aid adaptation; however, neither were optometrists instructed not to modify prescriptions. Instead, optometrists were instructed to prescribe as they usually would in practice.
Five autorefractor readings were taken for each eye with the auto-refractor results then modified in certain circumstances using an algorithm based on the habitual prescription and age of the participant (https://patents.google.com/patent/EP0999781A1). The modifications included avoiding a large reduction in the prescription of a young myope and avoiding changing spherical and cylinder power by too much in older participants, particularly for the oblique cylinder (J45) component. Specifically, for participants of 45 or older, any change in J0 between the habitual and autorefractor prescriptions was reduced by 25% and any change in J45 between the habitual and autorefractor prescriptions was reduced by 50%. This likely made the autorefractor-based prescription easier to adapt to for older participants than if this was based solely on the original autorefractor results.Citation1–4 The modification algorithm was applied to the autorefractor prescription only.
Seven participants were found to have no prescription and were excluded from further participation in the study. Each participant then selected a frame made up of the first of the two prescriptions. Participants were offered a choice of approximately 40 frames from a single manufacturer, and dispensing advice about the suitability of frame selection was provided. Participants were able to peruse the selection of frames prior to enrolling in the study. All prescriptions were filled using standard finished lens blanks made from CR39, with tolerances defined by ANSI Z80.
All prescriptions were verified and randomised by one of the authors (MAB) who had no involvement in the participant-facing aspects of the study (e.g. did not perform examinations or administer questionnaires). Randomisation was performed in advance in blocks of four using Microsoft Excel. A single frame was used for each participant to ensure that frame comfort and fit did not influence participant preference or acceptance of each test prescription. Frames were adjusted at the initial dispensing and as needed at subsequent visits, participants could return for adjustment or troubleshooting at any time.
The spectacles with the first prescription were worn for 3 weeks. Following this, the participant returned and binocular distance visual acuity on a Bailey-Lovie logMAR chart was measured (scored by letter), and a questionnaire completed that included questions regarding their adaptation and satisfaction with the spectacles. Quality of distance vision (e.g. while driving) was scored on a 0–10 scale where 0 was ‘totally unacceptable’ and 10 was ‘excellent’. Adaptation was assessed by the question ‘How easy was it to get used to these spectacles?’ and was scored on a 0–10 scale where 0 was ‘unable to accept’ and 10 was ‘no trouble’. Participants were also asked to answer yes or no to the question ‘If you had purchased these spectacles for $100 (equivalent to around $200 in 2023, and based on the typical cost of a pair of single vision CR39 spectacles in Berkeley, US in 1996), would you be happy with them?’
The lenses with the second prescription were swapped into the frame and the axis verified at the interim visit, and the second prescription worn for further three weeks before returning to complete binocular visual acuity measurements and the same questionnaire. Participants were also asked to identify their preferred prescription, which they were allowed to keep at no cost. The study used a double-blind cross-over design, and the order of the prescriptions given was randomised.
Retrospective analyses
Of the 196-item data set available for retrospective analysis, two participants did not return for the second follow-up. The original study reported 197 cases with two lost to follow up, with a single data set lost between primary and retrospective analysis.
Preference analysis
At the conclusion of the original study, participants were asked which test prescription they preferred, with the question ‘of the two pairs of spectacles that you have worn for this study do you: prefer the first pair, prefer the second pair, consider both equally acceptable or consider both equally unacceptable?’. One hundred and fifty participants expressed a preference for one test prescription over the other and so were included in the preference retrospective analysis.
The independent variable is categorical with the two categories being the prescription that the participant stated they preferred (preferred prescription) and the prescription that the participant did not state that they preferred (non-preferred prescription). The dependent variables were the logMAR VA, subjective distance vision rating and subjective ease of adaptation rating, and it was hypothesised that these dependent variables would have higher scores (higher ease of adaptation or subjective distance vision rating or better logMAR VA) in the preferred pair group of the participants when compared to the non-preferred pair.
Participants with a meaningful difference in score who preferred the expected (higher scoring) prescription
To understand the percentage of patients who preferred the expected (higher rating for ease of adaptation or subjective distance vision or better logMAR VA) prescription for each dependent variable (binocular distance visual acuity (logMAR), subjective distance vision rating and subjective ease of adaptation rating) prescription, first a meaningful difference between scores was defined for each dependent variable. For example, for logMAR VA, although a score of −0.06 is higher than −0.04 (both between 6/6 and 6/5 Snellen), a difference of one letter between the two scores would not be considered clinically meaningful.Citation12,Citation13 For each dependent variable, distributions of scores were considered to define a meaningful difference in score between the two prescriptions. Research literature was also considered where available (i.e. for difference in visual acuity).
Differences in score between preferred and non-preferred pairs
For the 150 cases where a preference for one test prescription over the other was expressed, a Wilcoxon Signed Rank test was used to analyse significant differences in logMAR visual acuity, subjective quality of distance vision rating and subjective ease of adaptation rating between the preferred and non-preferred prescriptions.
Logistic regression analysis
In the original study, participants did not pay for their spectacles. The question ‘If you had purchased these spectacles for $100, would you be happy with them?’ was used to understand if the participant would have been happy with the spectacles, had they paid an average price for them (based on the average price of a pair of single vision spectacles in Berkeley, US, in 1996, US$, equivalent to $200 adjusted for 2023 value). Of the 196-item data set available for retrospective analysis, two participants did not return for the second follow-up. Of these, one had worn the prescription based on the subjective refraction first so was included in the logistic regression analysis, leaving a data set of 195 available for this retrospective analysis.
For the logistic regression analysis, the prescription based on the subjective refraction was considered, this being most closely representative of the situation in an optometry practice. A binary logistic regression model was used to analyse the variables which predicted whether the participant answered yes or no to the question ‘If you had purchased these spectacles for $100, would you be happy with them?’, with the answer to this question as the independent (outcome) variable. Binocular distance visual acuity (logMAR), subjective distance vision rating and subjective ease of adaptation rating were included as dependent (predictor) variables, along with the difference in bilateral mean spherical equivalent (MSE), bilateral J0 and bilateral J45 from the habitual prescription, hours the spectacles were worn per day and whether the prescription was worn first or second.
Data analysis
Statistical analysis was performed using SPSS (IBM SPSS Statistics for Windows, version 27.0). Demographic and refractive characteristics were summarised by frequencies and means, medians and IQRs as appropriate. Correlation between the refractive data of right and left eyes was analysed using the Intraclass Correlation Coefficient (ICC).Citation14 For analysis, subjective refractions are converted into vectors, whereby the spherical and cylindrical elements of a refraction are represented as three power vectors, where M is the spherical power vector (mean sphere equivalent), and J0 and J45 represent the horizontal or vertical and oblique components of astigmatism.Citation15
Criteria for meaningful differences in subjective quality of distance vision rating, ease of adaptation rating and binocular logMAR distance VA were determined using slope scores to examine the distribution of data.
As data were not normally distributed, Wilcoxon signed rank tests were used to determine statistical differences in ratings and binocular logMAR distance VA between the preferred and non-preferred prescriptions. Logistic regression was used to explore the factors which predicted satisfaction with the spectacles based on the subjective refraction, with the binary yes/no answer to the question ‘If you had purchased these spectacles for $100, would you be happy with them?’ the independent (outcome) variable.
Chi-square tests were used to compare the binary yes/no answer to the question ‘If you had purchased these spectacles for $100, would you be happy with them?’, based on the subjective prescription, between presbyopes and non-presbyopes, and those with an increase in anisometropia and those without an increase in anisometropia.
Results
Refractive status of participants
The Interclass Correlation Coefficient was used to analyse the correlation between the subjective MSE of right and left eyes. For subjective MSE, the average measured ICC was 0.95 with a 95% confidence interval from 0.94 to 0.96 (p < 0.0001). As a result, the mean MSE of the two eyes was used for further analysis.Citation14
The median bilateral subjective MSE was −1.88DS (IQR −3.89 to −0.94) with a range of −11.63 to +2.25DS. One hundred and seventy-four participants had a myopic bilateral subjective MSE of −0.50DS or worse, of which 16 had a myopic bilateral subjective MSE of −6.00 DS or worse. The remaining participants comprised 20 with a bilateral subjective MSE of between −0.49 and +0.99, and 2 with a hyperopic bilateral subjective MSE of +1.00DS or over. Sixty-nine participants had significant cylinder of 0.75 DC or more (taken as the average between the two eyes), with three having high astigmatism of 3.00 DC or more. When transposed into vectors, and taken as the mean of the absolute values of the two eyes, the median J0 was 0.19D (IQR 0.06 to 0.37, range 0.00 to 1.75) and the median J45 was 0.06D (IQR 0.02 to 0.17, range 0.00 to 1.02).
Preference analysis
Participants with a meaningful difference in score who preferred the expected (higher scoring) prescription
The differences in binocular distance visual acuity, subjective ease of adaptation rating and subjective quality of distance vision rating between the two prescriptions are given in .
Figure 1. The distribution of the difference in visual acuity, subjective quality of distance vision rating and subjective ease of adaptation rating between the two test prescriptions.
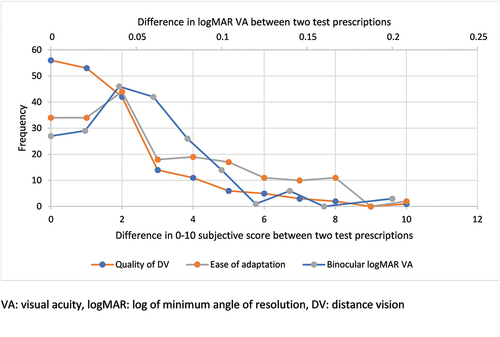
For subjective rating of quality of distance vision (on a 0–10 scale, with 0 being ‘totally unacceptable’ and 10 being ‘excellent’), the median difference in ratings between the two test prescriptions was 1. Analysis of the distributions of differences in rating () found an overall slope of m = −5.8, with the steepest slope between ratings 2 and 3 (m = −28.0) towards a relative plateau. A difference in rating of three or more was therefore taken to be a meaningful difference for this group. Forty-one of the 150 participants who expressed a preference between the two test prescriptions had a difference in subjective distance vision rating of three or more between the preferred and non-preferred pairs.
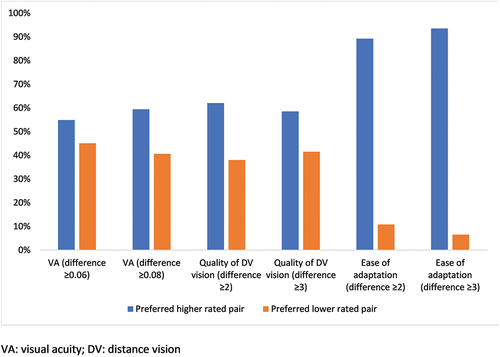
Data were also analysed for a difference in rating of two or more (n = 79). Of the participants with a difference of three or more between the preferred and non-preferred pairs, 59% preferred the higher rated prescription. Of the participants with a difference of two or more between the preferred and non-preferred pairs, 62% preferred the higher rated ().
Figure 2. Percentage of participants who preferred the higher scoring (better subjective quality of distance vision or ease of adaptation rating or better logMAR VA) prescription.
For the participant rating of ease of adaptation (‘how easy was it to get used to wearing these new spectacles’, on a 0–10 scale, with 0 being ‘unable to accept’ and 10 being ‘no trouble’), the median difference in ratings was two. Analysis of the distributions of differences in rating () found an overall slope of m = −3.8, with the steepest slope between ratings two and three (m = −26.0) towards a relative plateau. A difference in rating of three or more was therefore taken to be a meaningful difference for this group.
Seventy-seven of the 150 participants who expressed a preference between the two test prescriptions had a difference of subjective ease of adaptation rating of three or more between the preferred and non-preferred pairs. Data were also analysed for a difference in rating of two or more (n = 111). Of the participants with a difference of three or more between the preferred and non-preferred pairs, 94% preferred the higher rated prescription. Of the participants with a difference of two or more between the preferred and non-preferred pairs, 89% preferred the higher rated prescription ().
The literature suggests that a difference in visual acuity of approximately 0.07 to 0.09 logMAR is clinically meaningful among normal individuals.Citation12,Citation13 The median difference in visual acuity between the two test prescriptions was 0.04 logMAR. Analysis of the distributions of differences in logMAR VA () found an overall slope of m= −212.9, with the steeping decline in slope between 0.06 and 0.08 logMAR (m = −800). Results were analysed for a difference of 0.08 logMAR or more (4+ letters or 80% of one line), in line with both the literature and the analysis of the distribution of difference in VA within the test cohort. Thirty-two participants had a difference in visual acuity of 0.08 or more. Data were also analysed for a difference of 0.06 or more (n = 51).
Of the participants with a difference of 0.08 logMAR or more between the preferred and non-preferred pairs, 59% preferred the higher rated prescription. Of the participants with a difference of 0.06 logMAR or more between the preferred and non-preferred pairs, 55% preferred the prescription giving better logMAR VA ().
shows the percentage of cases where the prescription with a higher rating or better logMAR VA was preferred vs. the prescription with a lower rating or poorer logMAR VA preferred for each level of difference.
Differences in score between preferred and non-preferred pairs
In cases where a preference for one prescription over the other was expressed (n = 150), a Wilcoxon signed-rank test was used to examine the difference in scores between the preferred and non-preferred prescriptions for subjective quality of distance vision rating, subjective ease of adaptation rating and binocular logMAR visual acuity (). For quality of distance vision, the median rating for the preferred prescription was nine and significantly higher than the rating for the non-preferred pair of eight (Z = −7.80, p < 0.0001).
Table 1. Wilcoxon signed rank test, scores between preferred and non-preferred prescriptions.
For ease of adaptation score, the median rating for the preferred prescription was eight and significantly higher than the rating for the non-preferred pair of five (Z = −8.32, p < 0.0001). However, binocular visual acuity was the same in both the preferred and non-preferred pairs (both −0.09, Z = −0.60, p = 0.55).
Logistic regression analysis
A binary logistic regression was used to analyse the variables which predicted whether the participant would answer yes or no to the question ‘If you had purchased these spectacles for $100, would you be happy with them?’. As the participants did not pay for their test spectacles, the aim of this question was to ascertain whether the participant would be happy with them had they paid an average price for the time of the study. If the participants had simply been asked ‘are you happy with these spectacles’, the fact that they had received them free of charge may have made it more likely that they would answer in the affirmative. This was considered for the prescription based on subjective refraction, of which 158 (81%) participants answered ‘yes’ and 37 (19%) answered ‘no’ to the question ‘If you had purchased these spectacles for $100, would you be happy with them?’.
The three dependent variables used in the previous analyses were included (quality of distance vision rating, ease of adaptation rating, binocular logMAR distance visual acuity). Other dependent variables were considered for inclusion in the model (the difference in bilateral MSE, bilateral J0 ad bilateral J45 from the habitual prescription, hours the spectacles were worn per day and whether the spectacles were worn first or second), however forward selection indicated that no other variables improved the model, so these were not included in the final model, which is described in .
Table 2. Logistic regression model of the variables which best predicted whether the participant answered yes to the question ‘if you had purchased these spectacles for $100, would you be happy with them?’
The logistic regression model was a significant improvement over the null model (Χ2(3) = 63.8, p < 0.0001). The model explained 44.3% (Nagelkerke pseudo R2) of variance and correctly classified 80% of the cases. Higher quality of distance vision ratings and higher ease of adaptation ratings were significantly associated with an increased likelihood that participants would answer ‘yes’ to the question ‘If you had purchased these spectacles for $100, would you be happy with them?’ for the prescription based on the subjective refraction. Better visual acuity did not significantly increase these odds.
Presbyopic participants
Participants included 24 presbyopes aged 45 or over, seven of whom were 50 or over. The subjective binocular MSE for those age under 45 compared to those of 45 and over was not significantly different (Mann–Whitney U = 1928.5, z = −0.43, p = 0.67). There is no significant difference between the rate of rejection (i.e. the percentage of participants who answered ‘no’ to the question ‘If you had purchased these spectacles for $100, would you be happy with them?’) of the prescription based on the subjective refraction between the presbyopic and non-presbyopic groups, with 21% (5/24) of the presbyopic group rejected, compared to 19% (33/170 of the non-presbyopic group, XCitation2(1,194) = 0.27, p = 0.87).
Anisometropia
Twenty-five participants had over 1.00DS of anisometropia between the MSE of the subjective refraction for the right and left eyes. There is no significant difference between the rate of rejection (i.e. the percentage of participants who answered ‘no’ to the question ‘If you had purchased these spectacles for $100, would you be happy with them?’) of the prescription based on the subjective refraction between the anisometropic and non-anisometropic group, 16% (4/25) of the anisometropic group rejected, compared to 21% (35/170) of the non-anisometropic group, XCitation2(1,195) = 0.29, p = 0.59.
Only four participants had an increase in anisometropia of over 1.00DS when compared to their habitual spectacles (1.01DS, 1.38DS, 1.63DS and 2.38DS increase in anisometropia compared to the habitual spectacles, with anisometropia taken as the absolute difference in MSE between the two eyes), of whom only one rejected the prescription based on the subjective refraction.
Discussion
Binocular distance visual acuities were not a significant predictor of participant preference or whether a participant said that they would have been happy to pay for a pair of spectacles in any of these analyses. Ease of adaptation rating was found to be the most important factor in predicting which prescription a participant preferred and whether a participant said that they would have been happy to pay for a pair of spectacles. This supports findings that many patients report difficulties adapting to new spectacles,Citation16–20 and these problems have led to clinicians developing prescribing rules that allow easier adaptation and comfort with new spectacles.Citation1–4
Those with anisometropia did not have a higher rate of rejection (i.e. answered ‘no’ to the questions ‘If you had purchased these spectacles for $100, would you be happy with them?’) of test spectacles with the prescription based on the subjective refraction. However, in 21 of 25 participants with anisometropia, similar levels of anisometropia were present in the habitual spectacles, therefore it seems reasonable to assume that these participants were already well adapted to their anisometropia and this was unlikely to be a factor in their preference or acceptance of the test spectacles.
Similarly, the presbyopic group did not demonstrate a higher rate of rejection. However, as only single vision lenses were offered as an option, adaptation to multifocal lens types was not a consideration. In taking part in the study, presbyopes had accepted that only single vision lenses would be offered, so that any potential need to change glasses for near tasks should have been factored into this decision. Furthermore, as there were no hyperopic presbyopes, and 75% (18/24) had myopia of −1.00 or more, many would have the option of reading without glasses.
Additionally, any influence of lens type should apply to both prescriptions equally and therefore should not influence preference. The auto-refractor result was modified using a paradigm designed to ease adaptation in people of 45 and over by reducing the amount of change in cylinder from the habitual prescription. However, as the rate of spectacle acceptance was not different in the presbyopic group, there is no indication that this has influenced the results of the retrospective analysis.
Some patients seem happy with less-then-perfect vision
Once the level of vision that is ‘clear enough’ for the patient has been reached, it is possible that prescribing for any clearer vision will not make the patient any happier with their spectacles and may increase the risk of patient dissatisfaction,Citation8,Citation16,Citation17,Citation21 due to difficulties in adapting to new spectacles.Citation18,Citation19 Some drivers report being happy to drive without spectacles as long as their vision is ‘good enough’ and despite knowing it would be clearer with spectaclesCitation22 and some patients report preferring less clear vision rather than wearing their spectacles so that they just wear their spectacles for certain tasks.Citation18
Day-to-day visual requirements vary between patients, and although the archetypal engineer patient, with meticulous visual requirements, is rightfully recognised in the prescribing literature,Citation1,Citation23 they are not likely to be typical of most patients. There is variation in the amount of blur that a patient finds acceptableCitation24 and not all patients prefer the sharpest vision available to them.Citation18,Citation25 Conversely, it is clearly essential to ensure the level of vision provided is within the legal limits for driving, patients are often unaware of legal limits and require guidance from cliniciansCitation22 and other potentially dangerous visually demanding tasks.
Prescribing a modified subjective refraction result
It may be that optometrists remain too wedded to prescribing their subjective refraction result and the best possible visual acuity. Although many optometrists would not hesitate to omit a −0.25D or −0.50D cylinder when prescribing contact lenses, the same patient would be unlikely to be given this option in their spectacles, even if the cylinder was oblique and potentially problematic.Citation8 Newly qualified optometrists tend to be hesitant to stray away from using the best visual acuity to support their refraction result, with more experienced optometrists being more likely to adjust their subjective refraction result to support patient adaptation and comfortCitation5 using the prescribing rules widely available in the literature.Citation1–4,Citation7
Advice to patients about adaptation
These findings highlight how important a smooth adaptation process is to patients. With a number of previous studies finding that patients feel that they receive insufficient information and advice about adapting to new spectacles,Citation18,Citation19 there is a need for practices to take steps to ensure that patients have as easy an adaptation period as possible. This should include information and advice about what to expect and how to get used to a new pair of spectacles, including what type of symptoms may be experienced and why this might happen, strategies to aid adaptation, likely timescales of adaptation and, crucially, what to do if there are difficulties in getting used to a new pair of spectacles and when and how to contact the practice for help. This information should be given to all patients, and not just those with particularly large changes,Citation20 as even small changes can cause issues for some patients.Citation8–10,Citation21
Strengths and limitations
The strengths of this study are that it used a retrospective data analysis from a large sample size (196) from masked participants who provided feedback on two pairs of spectacles with different prescriptions to offer insights into which factors influence patient preference between new spectacle prescriptions, a question on which there has been little previous research.
However, there were limitations to the study. It is recognised that the two prescriptions were chosen for a different purpose in the original study than that used in the retrospective analysis. However, with the logistic and ethical challenges of designing a study comparing a full subjective vs a modified prescription, particularly if older participants were included with the additional risk of falls,Citation20,Citation26 the opportunity to compare a large data set of participants comparing two different prescriptions remains extremely valuable, particularly considering the lack of evidence to support optometrist prescribing decisions.
In the original methodology, the pantoscopic tilt was not measured or adjusted and the choice of lens material was limited to uncoated CR39. In the study, it was acknowledged that high index and anti-reflective coated lenses would be a more appropriate choice for the higher myopes. However, the limitations of lens choice (CR39, single vision only) were made clear to participants before they enrolled in the study, and any dissatisfaction caused by lens weight, thickness and reflections should have affected both test prescriptions equally.
A pre-defined protocol was not used for adjusting the subjective refraction prior to prescribing. Instead, study optometrists were directed to prescribe as they would in practice, meaning that there may have been an inconsistent approach in what, if any, modification of the subjective refraction was made prior to prescribing. However, this would mainly add variability to the data, yet the data provide strong evidence.
During the retrospective data analysis, desirable data such as monocular visual acuities were lacking. A significant difference in monocular visual acuities may have affected the ease of adaptation to a prescription, and this could not be analysed.
The question ‘If you had purchased these spectacles for $100, would you be happy with them?’ was designed to elicit patient happiness if they had purchased the spectacles (rather than received them for free under the study protocol) and was not designed to add a cost element to the question as it was based on the typical cost of a pair of single vision spectacles in Berkeley, US, in 1996. As patients did not pay for their spectacles, this was a hypothetical cost-related question, so this should, in fact, have removed socioeconomic barriers. Furthermore, there is no reason to suspect that any socioeconomic influence should affect one dependent variable more than others.
The cohort was young, and therefore not representative of a clinical optometric population. However, with older people likely to experience greater difficulties when adapting to a new pair of spectacles,Citation2–4 and higher rates of spectacle dissatisfaction,Citation8,Citation16,Citation21 it seems likely that the importance of ease of adaptation would be stronger in a cohort including older patients.
Conclusions
Optimal distance visual acuity scores obtained with a prescription based on the subjective refraction are not a useful predictor of participant preference or happiness to pay for a new pair of spectacles and may be over-relied on in practice. The results highlight the importance that patients place upon ease of adaptation to a new pair of spectacles. The results support the adjustment of the subjective refraction result when prescribing in some patients to aid adaptation and comfort.Citation1–8 Ideally, adaptation should be discussed with every patient,Citation18 with verbal advice supported by clear, concise and jargon-free written material.Citation27
Disclosure statement
No potential conflict of interest was reported by the author(s).
Additional information
Funding
References
- Brookman KE. Refractive management of Ametropia. Boston: Butterworth-Heinemann; 1996.
- Werner DL, Press LJ. Clinical pearls in refractive care. Oxford, Boston: Butterworth Heinemann; 2002.
- Milder B, Rubin ML. The fine art of prescribing glasses without making a spectacle of yourself. Gainesville: Triad Scientific Publishers; 2004.
- Elliott DB. Clinical procedures in primary eye care. 5th ed. Amsterdam: Elsevier; 2021.
- Howell-Duffy C, Scally AJ, Elliott DB. Spectacle prescribing II: practitioner experience is linked to the likelihood of suggesting a partial prescription: partial prescribing is linked to experience. Ophthalmic Physiol Opt 2011; 31: 155–167. doi:10.1111/j.1475-1313.2010.00803.x.
- Hrynchak PK, Mittelstaedt AM, Harris J et al. Modifications made to the refractive result when prescribing spectacles. Optom Vis Sci 2012; 89: 155–160. doi:10.1097/OPX.0b013e31823efdfd.
- Howell-Duffy C, Hrynchak PK, Irving EL et al. Evaluation of the clinical maxim: “If it ain’t broke, don’t fix it”. Optom Vis Sci 2012; 89: 105–111. doi:10.1097/OPX.0b013e31823b0073.
- Beesley J, Davey CJ, Elliott DB. What are the causes of non‐tolerance to new spectacles and how can they be avoided? Ophthalmic Physiol Opt 2022; 42: 619–632. doi:10.1111/opo.12961.
- Miller AD, Kris MJ, Griffiths AC. Effect of small focal errors on vision. Optom Vis Sci 1997; 74: 521–526. doi:10.1097/00006324-199707000-00020.
- Atchison DA, Schmid KL, Edwards KP et al. The effect of under and over refractive correction on visual performance and spectacle lens acceptance. Ophthalmic Physiol Opt 2001; 21: 255–261. doi:10.1046/j.1475-1313.2001.00588.x.
- Bullimore MA, Adams CW, Fusaro RE et al. Patient acceptance of auto-refractor and clinician prescriptions: a randomized clinical trial. In: Vision science and its applications. Optica Publishing Group; 1996. p. SuA.4.
- Brown B, Lovie-Kitchin J. Repeated visual acuity measurement: establishing the patient’s own criterion for change. Optom Vis Sci 1993; 70: 45–53. doi:10.1097/00006324-199301000-00009.
- Elliott DB, Sheridan M. The use of accurate visual acuity measurements in clinical anti‐cataract formulation trials. Ophthalmic Physiol Opt 1988; 8: 397–401. doi:10.1111/j.1475-1313.1988.tb01176.x.
- Armstrong RA. Statistical guidelines for the analysis of data obtained from one or both eyes. Ophthalmic Physiol Opt 2013; 33: 7–14. doi:10.1111/opo.12009.
- Thibos LN, Wheeler W, Horner D. Power vectors: an application of Fourier analysis to the description and statistical analysis of refractive error. Optom Vis Sci 1997; 74: 367–675. doi:10.1097/00006324-199706000-00019.
- Hrynchak P. Prescribing spectacles: reasons for failure of spectacle lens acceptance. Ophthalmic Physiol Opt 2006; 26: 111–115. doi:10.1111/j.1475-1313.2005.00351.x.
- Bist J, Kaphle D, Marasini S et al. Spectacle non‐tolerance in clinical practice – a systematic review with meta‐analysis. Ophthalmic Physiol Opt 2021; 41: 610–622. doi:10.1111/opo.12796.
- Hughes A, Fylan F, Elliott DB. What are patients’ beliefs about, and experiences of, adaptation to glasses and how does this affect their wearing habits? Ophthalmic Physiol Opt 2021; 41: 1034–1047. doi:10.1111/opo.12867.
- Fylan F, Grunfeld EA. Visual illusions? Beliefs and behaviours of presbyope clients in optometric practice. Patient Educ Couns 2005; 56: 291–295. doi:10.1016/j.pec.2004.03.003.
- Cumming RG, Ivers R, Clemson L et al. Improving vision to prevent falls in frail older people: a randomized trial. J Am Geriatr Soc 2007; 55: 175–181. doi:10.1111/j.1532-5415.2007.01046.x.
- Freeman CE, Evans BJW. Investigation of the causes of non-tolerance to optometric prescriptions for spectacles: spectacle non-tolerance. Ophthalmic Physiol Opt 2010; 30: 1–11. doi:10.1111/j.1475-1313.2009.00682.x.
- Fylan F, Hughes A, Wood JM et al. Why do people drive when they can’t see clearly? Transp Res Part F Traffic Psychol Behav 2018; 56: 123–133. doi:10.1016/j.trf.2018.04.005.
- Elliott DB, Howell-Duffy C. ‘Non-tolerances’ and the science of prescribing spectacles. Optometry 2015; 16: 131–144.
- Woods RL, Colvin CR, Vera-Diaz FA et al. A relationship between tolerance of blur and personality. Invest Ophthalmol Visual Sci 2010; 51: 6077–6082. doi:10.1167/iovs.09-5013.
- Satgunam PN, Woods RL, Bronstad PM et al. Factors affecting enhanced video quality preferences. IEEE Trans Image Process 2013; 22: 5146–5157. doi:10.1109/TIP.2013.2282120.
- Elliott DB. The Glenn A. Fry award lecture 2013: blurred vision, spectacle correction, and falls in older adults. Optom Vis Sci 2014; 91: 593–601. doi:10.1097/OPX.0000000000000268.
- Fylan F, Grunfeld EA. Information within optometric practice: comprehension, preferences and implications. Ophthalmic Physiol Opt 2002; 22: 333–340. doi:10.1046/j.1475-1313.2002.00048.x.