
ABSTRACT
Clinical imaging provided by optical coherence tomography (OCT) and its variant, OCT-angiography (OCT-A), has revolutionised eyecare practice. The imaging techniques allow for the identification and quantification of ocular structures, supporting the diagnosis and prognosis of eye disease. In this review, an overview of the usefulness of OCT-A imaging in the diagnosis and management of a range of ocular conditions is provided when used in isolation or in combination with other imaging modalities and measures of visual function (visual field results). OCT-A imaging has the capacity to identify and quantify ocular vasculature non-invasively, thereby assisting the clinician in the diagnosis or to determine the efficacy of intervention in ocular conditions impacting retinal vasculature. Thus, additional clinically useful information can be obtained in eye diseases involving conditions such as those impacting retinal vessel occlusion, in diabetic retinopathy, inherited retinal dystrophy, age-related macular degeneration, choroidal neovascularisation and optic nerve disorders. Through a clinical case series, various ocular conditions are reviewed, and the impact of OCT-A imaging is discussed. Although OCT-A imaging has great promise and is already used in clinical management, there is a lack of set standards to characterise altered vascular features in disease and consequently for prognostication, primarily due to a lack of large-scale clinical trials and variability in OCT-A algorithms when generating quantitative parameters.
Introduction
Optical coherence tomography (OCT) provides invaluable non-invasive clinical information. OCT imaging allows for the visualisation of ocular structure and quantification of multiple retinal and eye-related structural parameters useful for the diagnosis and management of eye disease.Citation1–4 In some ocular conditions, the pathology is primarily in the outer retinal vascular layers, where older technologies are less sensitive, requiring new improved imaging modalities. One area of development is enhanced depth imaging OCT, allowing better identification of choroidal structures as well as the application of newer quantitative techniques such as the choroidal vascularity index.Citation5–7
A second development is the need for methods to non-invasively assess ocular vasculature. Consequently, OCT angiography (OCT-A) was developed providing both retinal structural and retinal vascular information (via blood flow analysis), further enhancing the usefulness of this imaging modality compared to conventional OCT.Citation8–10
Imaging of the same location multiple times is performed by both OCT and OCT-A. In OCT, post-acquisition processing involves averaging these multiple scans into a single, high-resolution b-scans. Conversely, in OCT-A, the difference between scans is inferred as blood flow over time, thus it is possible to extrapolate the vascular architecture. Consequently, by identifying blood flow, OCT-A imaging can be used to identify many vascular anomalies in the retina, such as areas of non-perfusion, closed vessels, development of new vessels in areas which are avascular or an increase in vascularisation in vascular areas, micro- and macro-aneurysms, capillary remodelling, macular telangiectasia and venous malformations.Citation11
The short duration over which OCT-A captures movement information means that changes over longer periods of time, for example due to blood or fluid leakage, cannot be assessed. Therefore, assessment of breakdown of the blood-retinal barriers remains the domain of fluorescein angiography. The main advantage of OCT-A over fluorescein angiography is the elimination of the need for intravenous contrast dye injections, which themselves carry risks of complications.Citation8,Citation12 Kashani et al.Citation8 provide a detailed review of the various OCT-A methods that includes instruments using either spectral domain (source wavelength ~800 nm) or swept source (source wavelength ~1000 nm). The increased wavelength in swept source instruments increases retinal penetration at the cost of reduced resolution.Citation8
In this review, the usefulness of OCT-A imaging is outlined in combination with other imaging modalities to illustrate clinical findings in a range of ocular diseases. OCT-A provides a non-invasive means to image the retinal and choroidal vasculature providing a unique insight of the vasculature that can be combined with information from other imaging modalities to complement and at time, provide unique information assisting the eye care practitioner in relation to diagnosis or effectiveness of intervention. In this review, there are single cases provided for a wide range of ocular conditions to illustrate the usefulness of this imaging modality.
Care should be taken not to assume the single case is reflective of the range of presentations that can occur within a single eye condition: a cohort study would be required to draw major conclusions relating to clinical presentation for each eye condition. This manuscript should be read in combination with other reviews/publications such as those in the OCT special issue in Clinical and Experimental Optometry Volume 102, Issue 3 and multimodal imaging publications such as Chiang et al.Citation13; Ly et al.Citation14 Kalloniatis et al.Citation15 also in Clinical and Experimental Optometry. Combined reading will provide a holistic understanding of the use of multi-modal imaging in clinical practice.
All case images were captured under standardised testing protocols as per clinical guidelines from the Centre for Eye Health.Citation16 The Centre for Eye Health is based in Sydney and is a referral-only clinic that provides diagnostic imaging services for patients suspected of having eye-related diseases or treatment for those with a diagnosis. As per the Centre for Eye Health protocols, senior clinicians review the reports and consultation with ophthalmology (either a general ophthalmologist or sub-speciality ophthalmologist) is undertaken in the more unique cases, before finalising the report to the referring practitioner.
Patient written consent was obtained in accordance with the Declaration of Helsinki and approved by a Biomedical Human Research Ethics Advisory Panel of the University of New South Wales, Australia.
Instruments used to collect images in this manuscript include: fundus retinal camera (Kowa WX 3D non‐mydriatic retinal camera, Kowa, Tokyo, Japan), Optomap ultra‐widefield with fundus autofluorescence imaging (Optomap Panoramic 200Tx, Optos, Dunfermline, Scotland, UK), OCT (Spectralis HRA2 + OCT, Heidelberg Engineering, Heidelberg, Germany; Cirrus HD‐OCT, Carl Zeiss Meditec, Dublin, California, USA) and standard automated perimetry using the Humphrey Field Analyzer (Carl Zeiss Meditec). In addition to defining abbreviations in the text, for easy access, also provides a summary of the abbreviations.
Table 1. List of abbreviations.
Interpreting OCT-A imaging results
A step-by-step guide on OCT-A interpretation is provided by Greig et al.Citation17 Below, useful information is outlined to orient the reader in interpreting OCT-A imaging and its limitations.
Basic anatomy and segmentation
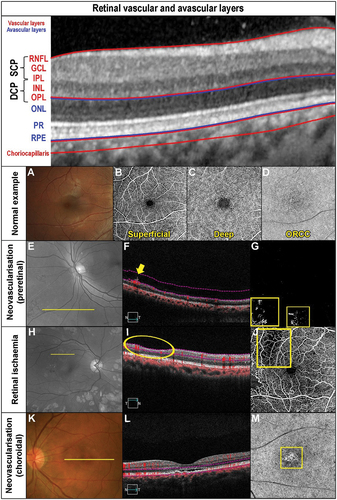
Interpretation of OCT-A requires an understanding of the vascular anatomy of the eye. In normal eyes, the retina and choroid comprise two distinct vascular bedsCitation18: the superficial and deep vascular plexuses. The Cirrus OCT-A delineates only the superficial and deep capillary plexuses of the superficial vascular plexus, although Campbell et al.Citation19 have shown that a unique intermediate capillary plexus also exists, straddling the superficial and deep capillary plexuses. shows the superficial and deep plexuses alone, as reported by the Cirrus OCT-A. The vitreous is avascular (anterior to the inner limiting membrane) and the outer retina is avascular (between outer plexiform layer and the Bruch’s membrane: ). The outer retina is supplied by the choroidal vascular supply reflected by the deep vascular plexus in OCT-A imaging.
Figure 1. Retinal vasculature and anomalies evident when using OCT-A and other imaging modalities. The OCT b-scan image is separated into various slabs: the inner vascular regions incorporating the superficial (SCP) and deep capillary plexus (DCP: red region), followed by the avascular region (blue) and finally the vascular (red) choriocapillaris. The SCP within the superior vascular slab extends from the ILM to the posterior IPL while the DCP extends from the posterior IPL to the anterior ONL. Only the SCP and DCP are shown as per CIRRUS OCT nomenclature. There is an intermediate capillary plexus that straddles the SCP and DCP which some OCT instruments include. (A) Fundus photograph of a healthy right eye. OCT-A imaging of the (B) superficial capillary plexus showing the foveal avascular zone, (C) deep (deep capillary plexus) and (D) outer retina to choriocapillaris (ORCC) of a normal eye. (E) Red-free image of a patient with proliferative diabetic retinopathy in the left eye. The yellow line shows the location of the OCT b-scan derived from the OCT-A cube. (F) OCT b-scan shows the neovascularisation located pre-retinally (yellow arrow). The vitreoretinal interface slab lines are defined by the pink dashed lines. (G) VRI (vitreoretinal interface) OCT-A image shows two regions of neovascularisation (yellow boxes). (H) Red-free image of a patient with a history of proliferative diabetic retinopathy managed with peripheral pan-retinal photocoagulation in the right eye. The yellow line shows the location of the OCT b-scan derived from the OCT-A cube. (I) OCT b-scan shows focal inner retinal thinning temporally (yellow oval). (J) The focal inner retinal thinning corresponds to a region of reduced capillary density (yellow box) on the superficial OCT-A image. (K) Fundus photograph of a patient with acute central serous chorioretinopathy and associated pachychoroid neovasculopathy in the left eye. The yellow line shows the location of the OCT b-scan derived from the OCT-A cube. (L) OCT b-scan shows subretinal fluid overlying a flat irregular pigment epithelial detachment (FIPED). (M) ORCC OCT-A image shows a neovascular network centrally (yellow box) displaying a bright vascular network surrounded by a duller region before continuing to a normally appearance for the ORCC. (N) Abbreviations: superficial and deep capillary plexus (SCP and DCP); RNFL – retinal nerve fibre layer; GCL – ganglion cell layer; IPL – inner plexiform layer; INL – inner nuclear layer; OPL – outer plexiform layer; ONL – outer nuclear layer; PR – inner and outer segments of photoreceptor layer; RPE – retinal pigment epithelium.
The superficial vascular plexus is comprised of large and medium vessels within the retinal nerve fibre layer, which are arched vessels around the foveal avascular zone (FAZ) with a continuous, homogenous appearance with no vascular loopsCitation20 (). The deep vascular plexus (outer retina to choriocapillaris region) has radial and horizontal interconnections with a small discontinuous capillary complexCitation20 (). OCT-A delineates layers of the retina into ‘slabs’ in which en face image analysis is undertaken to develop the vascular architecture as shown in .
In summary, OCT-A images are separated into various ‘slabs’ reflective of the various en face retina structure (see also description in ). These slabs from inner to outer retina are:
Vitreous slab (avascular)
Superficial vascular plexus
Superficial capillary plexus
Some OCT instruments may have an intermediate capillary plexus straddling the superficial and deep capillary plexuses
Deep capillary plexus
Deep retinal slab (avascular)
Deep vascular plexus (outer retina to choriocapillaris)
Qualitative interpretation of en face images
In OCT-A images, movement is depicted as white areas and no movement as black. The combination of areas of blood flow (white areas) leads to OCT-A images being reflective of the retinal vasculature. Conversely, a lack of blood flow (black areas) would be present in previously vascularised areas (white areas). Thus, areas which are whiter than expected reflects hyper-flow (e.g., ) which can indicate vascular anomalies reflective of increased perfusion. Areas that are blacker than expected reflect hypo-flow (e.g., ), which reflects reduced vascular perfusion. Evidence of blood flow in areas that are normally avascular indicates neovascularisation (white area: ).
Similarly, an increase in blood vessels in vascular regions also indicate neovascularisation such as what would occur as in choroidal neovascularisation (white areas: ). Panels 1E, F, G display pre-retinal neovascularisation, while panels 1K, L, M choroidal neovascularisation. Similarly, given that OCT-A detects blood flow, the absence or reduction of flow in normally vascular layers that can occur due to arterial occlusive disease or secondary to retinal ischaemia will be detected as areas of non-perfusion (black area in ). Panels 1 H, I, J display an example of retinal ischaemia secondary to diabetic retinopathy.
Assessing OCT-A en face image
When interpreting OCT-A image results, it is important to view the en face images to ensure the vascular appearance is as per normal within the superficial (superficial capillary plexus), intermediate (deep capillary plexus), and deep layers (deep vascular plexus: ). For example, when reviewing the FAZ, one should look for enlargement and irregularity in shapeCitation21–23 keeping in mind the variability in normal subjects,Citation24 although lack of instrument agnostic normative data hinders interpretation.
The three-dimensional angiogram is separated by segmentation algorithms of OCT-A instruments into individual vascular beds (slabs) which can be reviewed at the various locations to detect anomalies (). It is useful to use the OCT b-scans in combination with OCT angiograms to correlate anatomical and vascular abnormalities. Although OCT-A imaging does not identify vascular leakage, it better delineates capillary dropout and identifies early changes suggestive of retinal neovascularisation.Citation25 Careful assessment of segmentation is required to ensure accuracy and that spurious alignment has not occurred where there is loss of retinal structure, as can occur in the context of eye movements or organic pathology.
The high resolution of OCT-A and the segmentation of the different retinal layers is therefore a major advantage when assessing retinal vasculature compared to other imaging modalities such as fluorescein angiography or indocyanine green angiography.Citation23,Citation26–28 However, OCT-A imaging has been shown to not perform as well as indocyanine green angiography in some subtypes of polypoidal choroidal vasculopathy.Citation29
Factors affecting OCT-A image interpretation and limitations
Interpretation of OCT-A images is dependent on several factors. Signal strength is an automated index implying test reliability with low signal strength implying poorer reliability as reported in a study assessing peripapillary vasculature using OCT-A.Citation30 Also, interpretation also requires identification of artefacts such as motion, shadowing, segmentation, and extravascular signal from exudative oedema. Several of these artefacts are dependent on instrument hardware and algorithms and require operator interpretation or intervention (see Greig et al.Citation17 for a detailed breakdown of these artefacts).
Other limitations of OCT-A technology in clinical practice include: a relatively small field of view compared to conventional OCT; difficulty identifying microaneurysms; unlike fluorescein angiography, inability to identify leakage; marked impact by media opacities and eye movements; inability to identify blood flow rate; limited ability to identify of small vessels typically of diameter <15 mm; a lack of consistent nomenclature and uniform analytical algorithms; and a lack of large scale clinical trials correlating various clinical measures (structural and vasculature).Citation11,Citation31 Furthermore, areas of low turbulent flow may remain undetected as blood flow may fall below detection thresholds for OCT-A instruments.Citation11
In summary, some key OCT-A characteristics important for clinical interpretation are:
The FAZ is evident in the superficial and deep capillary plexus: irregularity or enlargement of the FAZ indicates vascular change
OCT-A detects blood flow not vascular leakage
Increased blood flow (white areas) in normally avascular region (vitreous or deep retinal slab) or in vascular regions indicates neovascularisation
Reduced blood flow (black areas) in normally vascular regions indicates ischaemia due to capillary dropout
Factors affecting image quality include signal strength (recommended cut-off values are instrument dependent), segmentation errors, media opacities and eye movements
In the following sections, the clinical insights provided by OCT-A in specific retinal and optic nerve diseases will be discussed.
Retinal artery occlusion
Retinal arterial occlusion is characterised by acute, painless vision loss, which requires urgent intervention in acute cases.Citation15,Citation32,Citation33 Diagnosis of artery occlusion is largely based on clinical presentation.Citation11,Citation22,Citation30 OCTA images can be used to identify areas of non-perfusion, analyse the degree of ischaemia in the superficial and deep capillary plexuses, and to correlate areas of poor perfusion with retinal thickness maps.Citation11,Citation26,Citation34 Using OCT-A, Yang et al.Citation35 were able to quantify the reduction in capillary plexus perfusion in the superficial and deep vascular layers in patients with retinal artery occlusion, particularly when compared to the unaffected fellow eye. Retinal whitening due to oedema in the acute stage of occlusion limits signal quality, while in older arterial occlusions, atrophic changes lead to segmentation errors due to retinal structure disorganisation or poor patient fixation stability if there is central vision loss.Citation11,Citation34
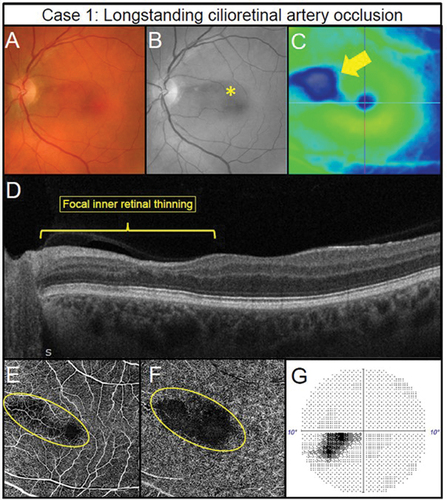
A case of a previous left cilioretinal artery occlusion illustrates some important OCT-A signs. Despite the paracentral retinal atrophy, visual acuities were 6/4.8 right and left (). First, the impacted retinal location displays thinning () that corresponds to the focal retinal thinning () shown in an OCT image and associated avascular superficial and deep capillary plexuses (). Second, there is confirmation of functional loss in the inferior temporal central visual field when using the Humphrey Field Analyser 10–2 test grid () correlating with the anatomical location. OCT-A imaging may provide prognostic information about possible future neovascularization if there is sufficient perfusion for production of VEGF after an arterial occlusion.
Figure 2. Longstanding cilioretinal artery occlusion in the left eye of a 51-year-old male (Case 1). (A) No evidence of a retinal embolus with colour fundus photography. (B) Red-free fundus photography highlights a papillomacular retinal nerve fibre layer defect (asterisk). (C) Horizontal OCT imaging demonstrates focal thinning of the retina (blue hue) corresponding to the affected area (arrow) located primarily superior-nasally to the fovea. (D) Nasal focal inner retinal thinning and disorganisation (yellow bracket) on OCT line scan through the superior macula. (E) 6 × 6OCT-A superficial slab (defined as inner limiting membrane to posterior inner plexiform layer) and (F) 6 × 6OCT-A deep slab (defined as posterior inner plexiform layer to posterior outer plexiform layer). Both superficial and deep capillary plexuses display reduced capillary perfusion (yellow oval). (G) Corresponding inferotemporal defect of the left eye with the 10–2 visual field test grid (grey scale is shown).
In summary, OCT-A allows the assessment of retinal ischaemia within the various retinal layers secondary to arterial occlusive disease. In doing so, it is possible to identify regions of susceptibility for neovascularisation as well as to be cognisant of other ocular locations susceptible to neovascularisation and may remove the need for fundus fluorescein angiography. For example, Rudkin et al.Citation36 reported neovascularisation in six of 33 patients (18.2%) with central retinal artery occlusion, five of whom developed neovascular glaucoma. The mean presentation time was 8.5 weeks, some at two weeks and as such, clinicians should be aware of the short presentation time of neovascularisation secondary to arterial occlusion.Citation36
Retinal venous occlusion
The signs of retinal venous occlusive disease are appreciable using conventional imaging technologies such as fundus photography. OCT-A imaging highlights several lesions and parameters of interest that may be more challenging to appreciate using conventional techniques, such vascular calibre, collateral vessels, telangiectasia, neovascularisation and macular oedema.Citation8,Citation37 Consequently, OCT-A provides information on quantitative vascular and FAZ changes and with the addition of conventional OCT can guide management including the impact of intervention measures.Citation37 For example, the preservation of the deep vascular plexus is associated with improved visual outcomes in retinal vein occlusion.Citation38
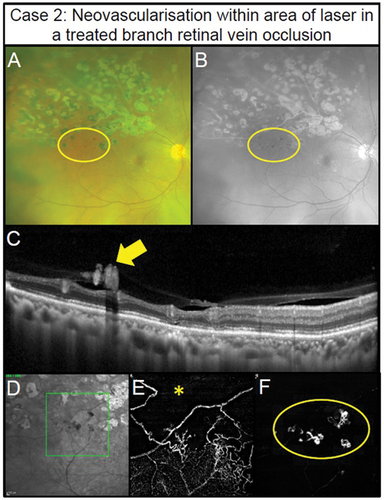
A reduction of capillary perfusion is highlighted in Case 2, in a patient with visual acuity of 6/6 in the right eye and a branch vein occlusion with previous laser scars evident in the imaging. Neovascularisation and areas of non-perfusion associated with haemorrhaging reflective of retinal ischaemia is shown in . The region showing retinal haemorrhaging also displays neovascularisation in the vitreous (), and lack of vascular perfusion in the deep capillary plexus in OCT-A (). Poor deep vascular perfusion correlates with the severity of the venous occlusion,Citation39 thus this case required referral for the management of the ischaemia and resulting retinal neovascularisation. Although the neovascularisation is evident through other imaging modalities, the OCT-A imaging also identifies the underlying ischaemia ().
Figure 3. Pre-retinal neovascularisation associated with a longstanding superior branch retinal vein occlusion treated with retinal photocoagulation laser in a 65-year-old male (Case 2). (A) Subtle pre-retinal neovascularisation located between regions of laser (oval) with ultra-widefield imaging. (B) Green separation channel highlights the region of neovascularisation. (C) OCT line scans through the region of neovascularisation shows pre-retinal abnormal hyper-reflective tissue along the posterior interface (arrow). (D) Scanning laser ophthalmoscope image of the OCT-A scan location (rectangle). (E) Retinal nonperfusion suggestive of retinal ischaemia present superiorly (asterisk) with 3 × 3 mm OCT-A image of the deep capillary plexus (defined as posterior inner plexiform layer to posterior outer plexiform layer). Impaired retinal perfusion is also present in the inferior aspects of the scan. (F) Pre-retinal neovascularisation (oval) in the region of non-perfusion noted in the previous panel detected using 3 × 3 mm OCT-A imaging of the vitreoretinal interface (defined as user-defined anterior border set in the vitreous space to the inner limiting membrane).
In summary, OCT-A imaging provides key information relating to the level of ischaemia secondary to retinal venous occlusive disease and thus likelihood of development of neovascularisation (more severe ischaemia leads to high likelihood of neovascularisation).Citation40 OCT-A may remove the need for fundus fluorescein angiography. Once retinal ischaemia is suspected by such signs as severely reduced visual acuity, relative afferent pupillary defect, severe oedema/haemorrhages and vein tortuosity, it is important to routinely follow up patients with retinal venous occlusion, especially in the first six months.Citation41
Diabetic retinopathy
OCT-A imaging provides both qualitative and quantitative information about retinal vascular anomalies pertinent to diabetic retinopathy, a major cause of vision loss throughout the world.Citation42 Changes identifiable through OCT-A imaging include macular oedema, microaneurysms, intraretinal microvascular abnormalities, venous beading and loops and neovascularisation, areas of non-perfusion, vessel density reduction, changes in the FAZ, vessel length reduction, and wider venous calibre.Citation11 The FAZ is irregular (lower circularity index) and larger, particularly in the deeper FAZ in patients being treated for diabetic retinopathy.Citation21
OCT-A imaging allows the identification of finer capillaries within the retina and choriocapillaris that may be altered in diabetic retinopathy, as well as microaneurysms, ischaemia, neovascularisation and related changes. Chua et al.Citation43 discussed evidence showing that such changes may be evident before fundoscopically visible changes, although they mention that other studies do not support this premise. As such, further research is required to determine the diagnostic usefulness of OCT-A early in the disease process.
Findings from OCT-A imaging in diabetic retinopathy have been correlated with visual function with worse visual acuity with poor macular superficial and deep vascular density.Citation44 Also, vascular anomalies in diabetic retinopathy are present secondary to cystoid macular oedema with altered inner plexus anomalies and absent deep vascular plexus in both diabetic retinopathy and venous occlusive disease.Citation45,Citation46
In managing macular oedema in diabetic retinopathy, the extent of deep capillary plexus loss, larger number of microaneurysms and larger FAZ and outer plexiform layer disruption (from OCT image assessment) appear to be useful indicators for those patients who did not respond to anti-VEGF treatment, compared to those who did respond.Citation22 The characteristics noted above by Lee et al.,Citation22 namely OCT-A-detected loss of deep capillary plexus, number of microaneurysms, larger FAZ and OCT-detected outer plexiform disruption could be used to identify those patients who are likely to be poor anti-VEGF responders and thus the OCT-A imaging is useful to better inform the most effective treatment options on a person-by-person basis.
The case series with diabetic retinopathy range from mild, a severe case of PDR with tractional retinal detachment displaying the ‘wolf’s jaw’ appearance (). Case 3 is an example of mild non-proliferative diabetic retinopathy (NPDR) with visual acuity of 6/4.8 right and 6/3.8 left. A microaneurysm is evident when using colour fundus photography, red-free and OCT-A imaging (), but no anomaly is evident in structural OCT imaging ().
Figure 4. Manifestations of diabetic retinopathy. (Case 3) Mild non-proliferative diabetic retinopathy (NPDR) in the left eye of a 40 -year – old male. (A) Isolated microaneurysm present in the nasal macula (arrow) using colour fundus photography. (B) Improved visualisation of microaneurysm with the red-free filter (arrow). (C) 6 × 6 mm OCT-A superficial capillary slab (defined as inner limiting membrane to posterior inner plexiform layer) highlights the microaneurysm noted on fundus photography (yellow circle) and an additional microaneurysm (red circle). (D) No visual abnormalities can be seen on structural OCT in the region matching the additional microaneurysm (rectangle). (Case 4) Foveal avascular zone enlargement associated with moderate NPDR in the left eye of a 37-year-old male. (E) Several microaneurysms and intraretinal haemorrhages centrally evident with colour fundus photography (arrowheads). (F) Visualisation of diabetic lesions enhanced with red -free filter (arrowheads). (G) Enlargement of foveal avascular zone (dashed line) (6×6 mm OCT-A superficial slab). (H) No visual abnormalities present on horizontal structural OCT through the fovea. (Case 5) Retinal ischaemia associated with severe NPDR in a 31 -year -old male. (I) Colour fundus photography shows numerous microaneurysms and intraretinal haemorrhages centrally. (J) Red-free filter displays enhanced visualisation of diabetic lesions. (K) Reduced capillary perfusion (asterisk) consistent with retinal ischaemia temporally in 6 × 6 mm OCT-A superficial slab. (L) Focal inner retinal thinning (bracket) corresponding to the region of reduced superficial capillary perfusion visualised using structural OCT. (Case 6) Focal proliferative diabetic retinopathy (PDR) within a region of retinal ischaemia in a 43-year-old. (M) Small abnormal vessel in the inferior mid-periphery (circle) using fundus colour photography. (N) Green separation channel improves visualisation of abnormal vessel (circle). (O) Reduced capillary perfusion surrounding the abnormal vessel (circle) detected using 12 × 12 mm OCT-A superficial slab (user-defined vitreous space to posterior inner plexiform layer). (P) Pre-retinal hyper-reflective tissue (arrowhead) corresponding to the abnormal vessel consistent with pre-retinal neovascularisation on structural OCT. (Case 7) Extensive PDR in a 55-year-old male involving the retina and posterior vitreous. The neovascular complexes can form fibrovascular sheets generating a posterior pre-cortical vitreous pocket forming a ‘wolf’s jaw’ configuration. The ‘wolf’s jaw’ configuration is evident in this case, with superior and inferior fibrovascular tissue evident in ultra-widefield imaging (Q) red-green channels and (R) green separation channel imaging. (S) 12 × 12OCT-A superficial slab shows abnormal frond-like vascular networks in the regions of fibrosis. (T) Pre-retinal hyper-reflective sheets (asterisks) with associated retinal distortion on structural OCT.
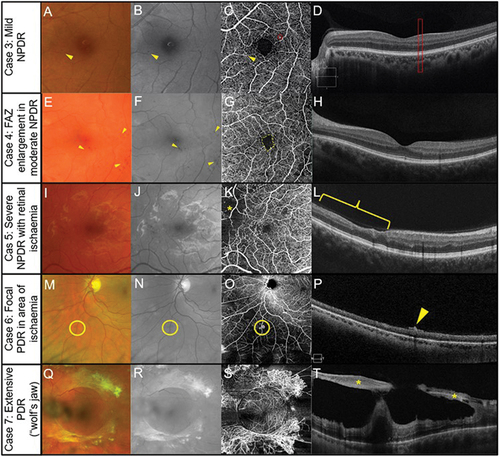
Case 4 shows an enlargement of the FAZ in the OCT-A image, microaneurysms and retinal haemorrhages in the colour fundus photographs with and without the red-free filter () with no anomalies evident in the structural OCT map () in a case of moderate NPDR with visual acuity of 6/9.5 right and 6/7.5 left. Capillary dropout (asterisk) is only evident in the OCT-A image (), with no evidence of anomalies present in colour fundus or red-free imaging () in case 5, a patient with NPDR with retinal ischaemia and visual acuity of 6/6 right and left. Structural OCT () shows a loss of retinal tissue corresponding to the area of capillary dropout.
Case 6 shows a small area of abnormal vessels (likely neovascularisation: ) surrounded by an area of capillary dropout in OCT-A imaging (: visual acuity of 6/6 R and L). OCT structural assessment shows a hyperreflective area within the retinal-vitreous interface consistent with neovascularisation (). Extensive proliferative retinopathy is shown in case 7 with surprisingly good visual acuities of 6/7.5 right and 6/9.5 left. In proliferative diabetic retinopathy involving both retina and posterior vitreous, the neovascular complexes can form fibrovascular sheets developing a posterior pre-cortical vitreous pocket.Citation47 The configuration is referred to as ‘wolf’s jaw’ and was present in 9% of 77 patients with retinal neovascular complexes.Citation47
display a frond-like vascular network and a peri-macular ring of fibrovascular material attached to the retina (asterisk) due to neovascular proliferation prominent in , absent in the temporal and nasal side characteristic of the ‘wolf jaw’ appearance.Citation48 Structural OCT shows pre-retinal reflective sheets (asterisks) with associated distortion ().
In summary, the use of OCT-A imaging facilitates identification of a multitude of vascular anomalies, at various locations within the retina, subretinal or pre-retinal slabs secondary to diabetic retinopathy. Importantly, vascular changes may supplement clinical information evident from other imaging modalities or may provide unique information such as areas of vascular dropout shown in cases 5 and 6. Correlation between poor macular OCT-A imaging indices with poor visual function may also provide additional useful clinical information.
Inherited retinal dystrophy
OCT-A imaging may elucidate vascular changes present in some retinal dystrophies,Citation49 (). Retinitis pigmentosa has a prevalence of around 1:4000 and reflects a diverse group of dystrophies initially of rod photoreceptor degeneration followed by cone photoreceptor degeneration and functional blindness.Citation49–52 Reduced vascular perfusion in advanced retinitis pigmentosa is evidenced by known attenuation of larger inner retinal vessels.Citation53 The strength of OCT-A studies is the potential for quantitative information regarding the capillary plexuses, particularly for the perfusion density, vessel length density, and vessel diameter index.Citation53
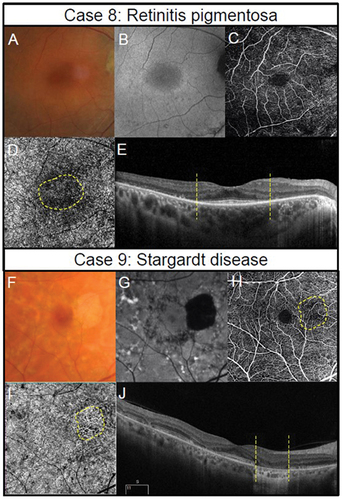
Figure 5. Multimodal imaging in inherited retinal dystrophies. Retinitis pigmentosa in a 40-year-old female (Case 8). (A) Fundus photography of the central retina. Outside this region, attenuated arterioles are present indicative of advanced stage of the disease process. The patient also has midperipheral spicule-like pigmentation not visible in the photograph. (B) Hyper-auto fluorescent ring around the macula (fundus autofluorescence imaging). (C) Subtle reduction in peripheral perfusion with 6 × 6 mm OCT-A superficial capillary slab (set from inner limiting membrane to posterior inner plexiform layer). (D) Impaired flow in the regions of outer retinal atrophy (outside the dashed yellow lines) with 6 × 6 mm OCT-A set at the level of the choriocapillaris (defined as 29 and 49 microns beneath the RPE). (E) Borders of preserved outer retina (yellow dashed lines) on structural OCT corresponding to borders of normal choriocapillaris flow on OCT-A corresponding to edge of remaining photoreceptors and the edge of the hyperfluorescent region in Figure 5B. The thinner retina outside the region identified by the yellow dashed line allows the deeper choroidal layers to be identified. (Case 9) Stargardt disease in a 62-year-old female. (F) Fleck-like fundus lesions with a region of outer retinal atrophy nasal to inferior to the fovea in the left eye. (G) Hypo-autofluorescence corresponding to the area of atrophy due to the loss of retinal pigment epithelial cells and the fleck-like lesions (hyper-auto fluorescent) are also more evident. (H) Subtle reduction in perfusion (yellow dashed region) in the area of atrophy detected using 6 × 6 mm OCT-A superficial capillary slab (set from inner limiting membrane to posterior inner plexiform layer). (I) 6 × 6 mm OCT-A choriocapillaris slab shows increased visibility of the choriocapillaris flow signal (yellow dashed region) corresponding to the area of atrophy. (J) Borders of atrophy delineated using structural OCT correspond to the region of flow impairment (yellow dashed lines). There is increased choroidal reflectance in the area of atrophy with a loss of photoreceptors and retinal pigment epithelium.
OCT-A imaging in patients with retinitis pigmentosa, includes vessel density reduction, both in the choroidal and intraretinal capillariesCitation49,Citation53 with moderate to advanced patients with retinitis pigmentosa displaying significant reduction in retinal ganglion cell densityCitation54 with a superficial vascular density reduction an expectant finding. In some studies, OCT-A anomalies have been reported primarily in deep retinal plexus with near normal superficial and choroidal plexus and in areas outside the retinal dystrophic region.Citation55 Changes in vessel characteristics have included altered choroidal circulation, vessel perfusion density and vessel length density negatively correlated with visual acuity and correlated with worsening mean deviation of the Humphrey Field Analyser.Citation56–58 OCT-A quantitative analysis showed improved vascular profile and less vascular disorganisation is associated with better clinical outcome for a subgroup of patients with retinitis pigmentosa.Citation49
Case 8 is an advanced case of retinitis pigmentosa (), in a 40-year-old female with only the central macular region of between 6 and 10 degree diameter showing a patent photoreceptor layer (). Visual acuity was 6/12 right and left, and kinetic visual fields were around 30 degrees in diameter, extending to around 50 degrees temporally (right and left). The superficial capillary slab () displays subtle impairment as expected due to the loss of retinal ganglion cellsCitation54 as does the choroidal vascular plexus due to the loss of photoreceptorsCitation50–52,Citation59 ().
The ABCA4 mutation causes several clinical phenotypes including Stargardt disease, juvenile macular degeneration, and fundus flavimaculatus, and is one of the most common causes of inherited retinal diseasesCitation60–62 characterised by cone photoreceptor degeneration often followed by rod degeneration. Vision dysfunction in patients with ABCA4 mutations may only be evident late in adulthood,Citation60 making discrimination from age-related macular degeneration difficult. The condition is characterised by flecks, macular atrophy, and sparing of the peripapillary region, and when there is rod involvement, loss of rod vision function progresses faster than loss of cone vision function.Citation60
Using OCT-A imaging, patients with Stargardt disease display altered foveal avascular zones and in retinal pigment epithelial atrophic areas, reduced choroidal circulation density.Citation63 In patients with the ABCA4 mutation, OCT-A imaging indices from the deep capillary plexus and in more advanced disease, with the superficial capillary plexus, are associated with other ocular imaging modalities and with visual function.Citation59 Morphological changes in choroidal vasculature, seen with OCT-A also correlate with visual function, with increased vessel tortuosity being a useful index to identify two Stargardt disease phenotype,Citation59,Citation64 suggestive of choriocapillaris involvement in the disease.
Case 9 is a 63-year-old female patient with Stargardt disease () with visual acuities of 6/6 right and 6/7.5 left and central visual field defects in both eyes as detected by Amsler grid. There is a region of outer retinal atrophy and retinal pigment epithelial dropout (). Vascular dropout corresponds with the region of retinal pigment epithelial dropout in the superficial () and choroidal slabs () and shows a region of increased flow signal corresponding to the area of atrophy.
In summary, in both ABCA4-related diseases, retinitis pigmentosa and other retinal dystrophies, OCT-A imaging use is evolving and requires further large-scale clinical trials to develop useful clinical guidelines.Citation59,Citation65 Furthermore, for both retinitis pigmentosa and Stargardt disease, the OCT-A imaging vascular perfusion results largely reflect retinal integrity, and correlation studies show better visual function when vasculature is minimally impacted.
Age-related macular degeneration
Age-related macular degeneration (AMD) is a condition impacting central vision which is the leading cause of vision loss in developed countries.Citation66 Both genetic and environmental factors such as smoking have been implicated in the aetiology and progression of AMD.Citation67 While vision loss typically progresses slowly, in some cases rapid vision loss may occur due to choroidal neovascularisation, which can be treated with anti-vascular endothelial growth factor (anti-VEGF) injections to improve visual acuity, prevent further vision loss or may not work at all.Citation68
SpaideCitation45 in a qualitative study of high-resolution OCT-A images described how repeated anti-VEGF treatment could result in vascular regression but that vascularisation remained abnormal post injection. Namely, post injection the large new vessels remained with anastomoses and regression of newly growing vessels.Citation45 In a group of six patients with choroidal neovascular membranes due to AMD, or various other retinal conditions, after anti-VEGF treatment, retinal fluid levels reduced and the quantification of the neovascularisation area was reduced when imaged using OCT-A.Citation69
Like the evolution of knowledge relating to vascular changes after anti-VEGF treatment, the development of treatment options for geographic atrophy will also result in improved understanding of this condition. For geographic atrophy, several clinical trials are in place targeting the impact of complement factor, neuroprotective agents, ocular gene therapy or the use of stem cells on atrophy progression, with overall good outcome.Citation68,Citation70
In February 2023, Pegcetacoplan (Syfovre; Apellis Pharmaceuticals) was approved in the United States to treat geographic atrophy secondary to AMD, based upon the OAKS and DERBY clinical trials,Citation71 although the long-term efficacy remains to be determined. It is likely the long-term efficacy will incorporate OCT-A derived clinical information of the outer vascular architecture secondary to intervention.
In intermediate AMD, retinal vasculature changes identified with OCT-A have been inconsistent; dilation and attenuation of retinal vasculature with loss of vascular density has been reported in superficial, intermediate and choroidal vascular slabsCitation72; however, others only found changes in deeper layers.Citation73,Citation74 In intermediate AMD, Trinh et al.Citation75 found a significant reduction in the superficial capillary plexus, altered morphology of the inner retinal vascular layers and no change in the FAZ.
Subsequent studies using clustering of images showed reduced vascular perfusion superficially and in the deep vascular complex: the reduced vascular perfusion was non-uniform for the superficial but not for the deep vascular plexus.Citation76 Sparing of radial peripapillary capillary plexus and impairment of underlying vasculature was suggested by the authors as being reflective of anterograde trans-synaptic degeneration in intermediate AMD.Citation76 In the choroid, reduced thickness as measured using OCT imaging is evident in neovascular and non-neovascular cases of AMD. Newer OCT-A-based metrics such as vessel tortuosity and vessel dispersion reflect the disorganisation caused by the neovascularisation.Citation77
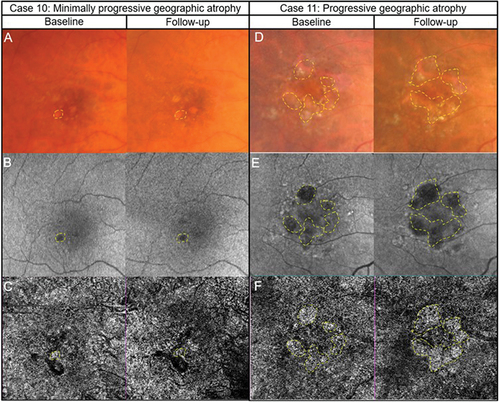
In geographic atrophy (), a loss of choriocapillaris flow and improved identification of choroidal vasculature can be observed as shown in panels . The two cases display different progression (slower for Case 10) with corresponding changes evident in both fundus autofluorescence and the anomalous choroidal blood flow derived from OCT-A imaging.
Figure 6. Two presentations of geographic atrophy with different rates of progression over a one-year-period. (Case 10) Slow progressing atrophy in a 71-year-old female with visual acuity of 6/15. (A) Medium and large drusen with focal geographic atrophy inferotemporal to the fovea in the right eye with colour fundus photography at baseline and follow-up visits. (B) Slight enlargement of hypo-autofluorescent area corresponding to an area of atrophy. (C) The areas where there is a subtle increase in flow signal demonstrates modest enlargement on 6 × 6 mm OCT-A image set at the choriocapillaris across visits (dashed lines). (Case 11) Fast progressing atrophy in an 83-year-old female with visual acuity of 6/19. (D) Medium and large drusen with pigmentary abnormalities and multiple areas of geographic atrophy demonstrating notable enlargement at follow-up. (E) Coalescence of hypo-autofluorescent regions between baseline and follow up. (F) 6 × 6 mm OCT-A image set at the choriocapillaris shows a greater extent of increased flow signal at baseline (dashed lines).
In summary, OCT-A imaging is likely to provide useful insights using a non-invasive technique on vasculature changes secondary to anti-VEGF treatment. It is also likely that it will provide useful insights on the impact of the new intervention measures for geographic atrophy. For early or intermediate AMD, conflicting changes in vasculature have been reported when using OCT-A imaging, and thus there are no practical guidelines to follow. In geographic atrophy, OCT-A imaging corroborate other methods such as fundus autofluorescence and thus OCT-A imaging is likely to be useful in monitoring the condition.
Choroidal neovascularization
Retinal neovascularisation is most commonly caused by diabetic retinopathy and retinal vein occlusions whereas age-related macular degeneration is the main cause of choroidal neovascularization (CNV). There are three subtypes of CNV: Type 1 in the sub-RPE space; Type 2 located in the sub-neural retinal space above the RPE and Type 3 originating in the neurosensory retina with anastomoses with the choroidal circulation.Citation78 The upregulation of VEGF leads to the development of new blood vessels which can have significant outcomes. Anti-VEGF compounds have revolutionised the management of both CNV and retinal neovascularisation.Citation79–81
CNVs have been described in two categories: first, ‘densely packed nets or sea-fans with high branching indices, extensive capillary sprouting and numerous anastomoses’ and second, ‘larger diameter filamentous vessels with lower branching indices and lower rates of capillary sprouting and anastomoses’.Citation78 OCT-A imaging provided both quantitative and qualitative information about the Type 1 CNV in AMD, although the extent of the lesion was significantly smaller than indocyanine green angiography.Citation82
A review by Schneider and FowlerCitation78 noted that sensitivity of OCT-A to detect CNVs, ranged between 50 to 87% compared to the gold standard of fluorescein angiography with or without OCT and specificity of 91 to 98% using spectral domain OCT-A. The lower detection rates were due to the presence of subretinal haemorrhages that obscure the vasculature and retinal pigment detachments.Citation78 Furthermore, OCT-A imaging can detect and monitor changes after anti-VEGF treatment.Citation26,Citation82,Citation83
With the advent of swept-source OCT-A, the longer wavelength facilitates deeper penetration allowing better identification of CNVs such as those that exist secondary to central serous chorioretinopathy polypoidal choroidal vasculopathy or AMD.Citation57,Citation58,Citation84,Citation85 Mastropasqua et al.Citation86 showed that the swept-source OCT-A detected 28 of 28 CNVs compared to the two spectral-domain OCTs which detected 26 of 28 CNVs. The studies are either case reports/series or contain small sample sizes. Thus, large multi-centre clinical trials are required to determine the efficacy of swept source OCT-A compared to the gold standard fluorescence angiography with and without standard OCT.
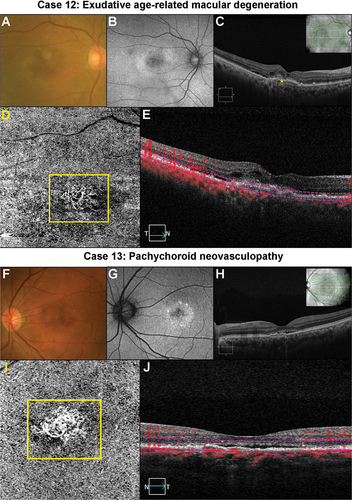
A case of likely CNV in a patient with AMD is shown in (Case 12). The sudden reduction in vision alerted the referring optometrist to the likely lesion which was confirmed with multi-model imaging and OCT-A results to be consistent with a CNV (). An urgent referral for management was made. Case 13 is that of pachychoroid neovasculopathy where a likely CNV is evident on OCT-A () supported by various other multi-model imaging. Again, an urgent referral for management was made.
Figure 7. Two cases of likely choroidal macular neovascularisation detected with OCT-A imaging. (Case 12) a 78-year-old male with visual acuities of 6/95–2 right eye and 6.9/5 + 2 left eye referred for a macular assessment. His referring optometrist noted a recent drop in his right eye’s vision from 6/12 to 6/120. (A) The right eye’s colour fundus photograph shows large drusen at the macula. (B) Fundus autofluorescence imaging showed speckled central hypo-autofluorescence. (C) Structural OCT imaging showed subretinal fluid, intraretinal cystic spaces and subretinal hyperreflective material (yellow asterisk) at the fovea. (D) A neovascular network (yellow box) is noted on the 6 × 6 mm ORCC OCT-A image. (E) The reference lines on the central OCT b-scan from the OCT-A image cube is depicted by the pink dashed lines. (Case 13) a 56-year-old male with visual acuities 6/6 right eye and 6/19 (pinhole 6/15 + 1) left eye. There was generalised waviness across the central 10 degrees of the Amsler grid in the left eye. (F) Colour fundus photographs shows pigmentary abnormalities centrally in the left eye. (G) Fundus autofluorescence imaging shows central hypo-autofluorescence with surrounding hyper-autofluorescence at the left macula. (H) There was subretinal fluid overlying a flat irregular pigment epithelial detachment in the left eye on OCT imaging. The inset in the upper right-hand corner shows the OCT b-scan location. (I) A neovascular network (yellow box) is present on 3 × 3 mm macular OCT-A image of the ORCC slab. (J) OCT b-scan derived from the OCT-A image cube shows the slab reference points (pink lines).
Pachychoroid disorders encompass a range of retinal conditions that include central serous chorioretinopathy, pachychoroid pigment epitheliopathy, pachychoroid neovasculopathy, polypoidal choroidal vasculopathy, peripapillary pachychoroid syndrome, and focal choroidal excavation all of which can have CNVs.Citation87,Citation88 ‘Pachy’ refers to the thickening of the Haller’s choroidal layer with attenuation of other choroidal layers.Citation87 Sagar et al.Citation89 proposed that swept source OCT-A may eventually be the best method to detect CNV secondary to pachychoroid disease.
In summary, OCT-A imaging has been shown to provide quantitative and qualitative information on choroidal neovascularisation with high sensitivity and specificity in detecting these membranes. OCT-A imaging is a very useful adjunct in patients suspected of having a neovascular membrane providing a quick and non-invasive method to assess the vasculature, and if a CNV is suspected, an urgent referral is required. Clearly in cases with subretinal fluid of unknown aetiology and a negative OCT-A imaging result, referral would still be required for fluorescein angiography.
Optic nerve head disease
WuDunn et al.Citation31 concluded that reasonably strong evidence exists for the correlation of peripapillary, macular, retinal nerve fibre layer (RNFL) and macular ganglion cell thickness changes and the location and severity of visual field defects, deep-layer peripapillary microvascular dropout correlation with visual field defects and progressive RNFL thinning in eyes with glaucoma. In this major review of the use of OCT-A in glaucoma diagnosis, the expert group concluded that OCT-A imaging may be useful in evaluating glaucoma suspects and monitoring advanced glaucoma when the visual field and OCT measurement floor has been reached.Citation31 The ‘measurement floor’ refers to OCT structural measurement outputs at which point no further deterioration in the loss can be detected.
Mean deviation (in decibels, dB) is often used to stage glaucoma, where a value of –12 dB or lower may signify the advanced stage of glaucoma. Overcoming limitations of structural OCT, perifoveal vessel density derived from OCT-A imaging may be useful in characterising advanced glaucoma. This is because the vessel density output has not reached the measurement floor (perifoveal vessel density estimated measurement floor was worse than the visual field mean deviation of −25.8 dB). Other clinically available structural OCT measurements reached the measurement floor at higher mean deviation levels (approximately –14 dB and –17 dB for the ganglion cell complex and circumpapillary RNFL, respectively), and thus, are arguably less suitable for monitoring patients with more advanced levels of glaucoma. Comparatively, circumpapillary capillary density acquired using OCT-A reaches the measurement floor at a lower mean deviation value (–19.3 dB).Citation90
There is even some evidence of the usefulness of OCT-A earlier in the disease process. Glaucomatous eyes display attenuated peripapillary, macular and choroidal vessel density, and some studies have proposed that these measures may be useful in pre-perimetric glaucoma.Citation31,Citation91,Citation92 For example, Vercellin et al.Citation92 reported reduced vascular density in the peripapillary, macular, global and regional areas in pre-perimetric glaucoma compared to healthy normal subjects. Yarmohammadi et al.Citation91 reported the association of various parameters to affected hemifield mean sensitivity loss in glaucoma. The correlations of mean sensitivity loss in glaucoma were best with hemiretinal circumpapillary vessel density (r = 0.707) and hemiretinal perifoveal vessel density (r = 0.615) and hemiretinal visual field mean sensitivity, compared to hemiretinal RNFL (r = 0.496) and hemiretinal ganglion cell complex (r = 0.482) with hemiretinal visual field mean sensitivity.Citation91
Patients with compressive optic neuropathy also displayed vascular loss in the peripapillary region using OCT-A imaging when compared to a similar group with normal tension glaucoma who had comparable RNFL loss and ganglion cell-inner plexiform layer damage.Citation93 These findings suggest an underlying vascular anomaly in different causes of optic neuropathy. In ischaemic optic neuropathy (see Kalloniatis et al.Citation15 for a full discussion on various ischaemic optic neuropathies), OCT-A imaging showed peripapillary capillary dropout and attenuation of the vascular around the optic nerve.Citation94
OCT-A imaging provided rapid high-resolution identification of optic nerve head vascular in cases of Leber optic neuropathy that included circumpapillary microangiopathy and dilated, tortuous vasculature in the active stage of the disease.Citation95 Superior segmental optic hypoplasia is a congenital anomaly of the optic nerve head that needs to be discriminated from changes induced by normal tension glaucoma.Citation96 Abe et al.Citation96 found poor radial peripapillary capillary density which they propose would help to discriminate superior segmental optic hypoplasia from normal tension glaucoma-related changes.
The case series in comprises primary open glaucoma cases (Case 14), retrograde degeneration (Case 15), ischaemic optic neuropathy (Case 16), Leber optic neuropathy (Case 17) and a case of optic nerve hypoplasia (Case 18). The superficial vascular dropout corresponds to the RNFL dropout and corresponding visual field loss in a case of early primary open angle glaucoma (). Temporal reduction in superficial capillary perfusion is evident in a patient with likely retrograde degeneration that corresponds to RNFL dropout and visual field deficit (). A focal reduction in the capillary plexus is evident in a case of ischaemic RNFL loss corresponding to structural deficits ().
Figure 8. Spectrum of optic nerve head diseases. (Case 14) Primary open angle glaucoma in the left eye of a 63-year-old male. (A) Broad superior RNFL defect with red-free photography. (B) Superior RNFL thinning with OCT RNFL thickness map. (C) 4.5 × 4.5 mm OCT-A superficial slab (defined as inner limiting membrane to posterior inner plexiform layer) shows reduced capillary perfusion corresponding to the RNFL thinning (dashed lines). (D) Inferior arcuate-like defect using the 24–2 visual field test grid corresponding to the structural loss. (Case 15) Retrograde degeneration in a 60-year -old male. (E) Temporal reduction in RNFL reflectivity in the right eye evident from the red-free image. (F) Concordant RNFL thinning with OCT RNFL thickness map. (G) Temporal reduction in capillary perfusion corresponding to location of RNFL thinning with 4.5 × 4.5 mm OCT-A superficial slab (dashed lines). (H) Right vertical central midline field loss with the 30–2 test grid. (Case 16) Ischaemic retinal nerve fibre layer loss in a 53-year-old female. (I) Superotemporal RNFL defect in the right eye evident from the red-free image. (J) Focal superotemporal RNFL thinning not contiguous with the disc on OCT RNFL thickness map. (K) Deep and focal reduction in capillary density in the region of RNFL thinning (dashed lines) using 4.5 × .4.5 mm OCT-A superficial slab. (L) No associated functional loss detected with the 24–2 test grid possibly due to the narrow RNFL loss and the course test grid (test spots are 6 degrees apart and the defect is roughly 3 degrees wide around 10 degrees from the ONH). (Case 17) Leber hereditary optic neuropathy in a 60-year-old male. (M) Temporal reduction in RNFL reflectivity in the right eye evident from the red-free image. (N) Temporal RNFL thinning, more marked inferiorly than superiorly with OCT RNFL thickness map. (O) 4.5 × 4.5 mm OCT-A superficial slab shows marked reduction in capillary perfusion temporally (dashed lines). (P) Superior paracentral defect on the 30–2 test grid. (Case 18) Superior segmental optic nerve hypoplasia in a 40-year-old male. (Q) Marked reduction in RNFL reflectivity in the superior and nasal peripapillary regions in the right eye shown in the red-free image. (R) Superior and nasal RNFL thinning on OCT RNFL thickness map. (S) Marked reduction in capillary perfusion in the regions of RNFL thinning with 4.5 × 4.5 OCT-A superficial slab (dashed lines). (T) Deep inferotemporal visual field defect on the 30–2 test grid. The key visual characteristics for these cases are: Case 14, visual acuity 6/6 R and L: mean deviation (MD) −3 dB L (24–2 test grid) and MD −7 dB (10–2 test grid); Case 15, visual acuity 6/7.5 R and L: MD R −4.4 dB L −5.6 dB (24–2 test grid); Case 16, visual acuity 6/6 R and L: MD R −0.6 dB L −0.3 dB (both 24–2 test grid); Case 17, visual acuity 6/38 R 6/48 L: MD −1.74 dB R and −4.73 L (both 24–2); Case 18, visual acuity 6/6 R and L: MD −8.53 dB R and −11.14 dB L (both 24–2 test grid).
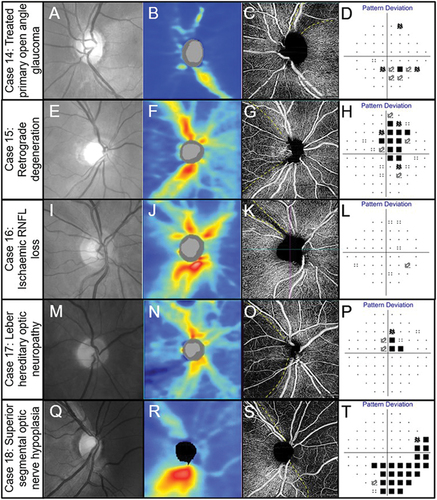
In a patient with Leber optic neuropathy, there is slight loss in the superficial plexus with major loss in the temporal region, and corresponding structural and visual function loss (). In a case of optic nerve hypoplasia with significant functional loss, there is correlation of OCT-A imaging showing reduced perfusion with structural loss (). Thus, in each example of several different optic nerve disorders, OCT-A information appears to complement closely other structural and functional clinical data.
In summary, OCT-A imaging is useful to monitor glaucoma patients with mean deviation of around −14 dB or worse, as other measures of objective imaging have reached their measurement floor.Citation31 OCT-A imaging provides confirmatory changes in cases of established RNFL loss secondary to several conditions (see examples in ) and would also be useful in assessing retinal vasculature in ischaemic optic neuropathies. Although there is some evidence for changes earlier in glaucoma, it is at an early stage and requires further research before clinical guidelines can be developed.
As this clinical research evolves, there is a need for strong evidence to guide clinical practice and attend to publications such as WuDunn et al.Citation31 who undertook a systematic review. Further, a limitation of current OCT-A instrumentation relevant to optic nerve disease is the inability to image deep optic nerve head vasculature and the peripapillary choroidal architecture.Citation31
Conclusion
OCT-A imaging has provided useful insights into various retinal and optic nerve diseases but has several limitations both in terms of technical capability and disease heterogeneity. As the technology evolves, future hardware and equipment upgrades will address many of the technical limitations, and larger scale trials will enable the nuances of disease heterogeneity to be captured. The information provided on the retinal and optic nerve vasculature has been useful to develop clinical biomarkers to assist in the diagnosis and management of ocular disease. Concurrently, there is a great need to evolve from small case studies to large-scale randomised clinical trials using coherent analytical approaches which should be developed to be equipment agnostic.
Acknowledgements
We thank the Centre for Eye Health clinical team for providing the cases used in this manuscript. Financial disclosure as per below.
Disclosure statement
No potential conflict of interest was reported by the author(s).
Additional information
Funding
References
- Huang D, Swanson EA, Lin CP et al. Optical coherence tomography. Science 1991; 254: 1178–1181. doi:10.1126/science.1957169.
- Ly A, Phu J, Katalinic P et al. An evidence-based approach to the routine use of optical coherence tomography. Clin Exp Optom 2019; 102: 242–259. doi:10.1111/cxo.12847.
- Pichi F, Invernizzi A, Tucker WR et al. Optical coherence tomography diagnostic signs in posterior uveitis. Prog Retin Eye Res 2020; 75: 100797. doi:10.1016/j.preteyeres.2019.100797.
- Spaide RF, Fujimoto JG, Waheed NK et al. Optical coherence tomography angiography. Prog Retin Eye Res 2018; 64: 1–55. doi:10.1016/j.preteyeres.2017.11.003.
- Laviers H, Zambarakji H. Enhanced depth imaging-OCT of the choroid: a review of the current literature. Graefes Arch Clin Exp Ophthalmol 2014; 252: 1871–1883. doi:10.1007/s00417-014-2840-y.
- Agrawal R, Ding J, Sen P et al. Exploring choroidal angioarchitecture in health and disease using choroidal vascularity index. Prog Retin Eye Res 2020; 77: 100829. doi:10.1016/j.preteyeres.2020.100829.
- Sazhnyev Y, Sin TN, Ma A et al. Choroidal changes in rhesus macaques in aging and age-related drusen. Invest Ophthalmol Vis Sci 2023; 64: 44. doi:10.1167/iovs.64.12.44.
- Kashani AH, Chen CL, Gahm JK et al. Optical coherence tomography angiography: a comprehensive review of current methods and clinical applications. Prog Retin Eye Res 2017; 60: 66–100. doi:10.1016/j.preteyeres.2017.07.002.
- Ferrara D, Waheed NK, Duker JS. Investigating the choriocapillaris and choroidal vasculature with new optical coherence tomography technologies. Prog Retin Eye Res 2016; 52: 130–155. doi:10.1016/j.preteyeres.2015.10.002.
- Ho S, Ly A, Ohno-Matsui K et al. Diagnostic accuracy of OCTA and OCT for myopic choroidal neovascularisation: a systematic review and meta-analysis. Eye (Lond) 2023; 37: 21–29. doi:10.1038/s41433-022-02227-8.
- Ong CJT, Wong MYZ, Cheong KX et al. Optical coherence tomography angiography in retinal vascular disorders. Diagno (Basel) 2023; 13: 1620. doi:10.3390/diagnostics13091620.
- Kornblau IS, El-Annan JF. Adverse reactions to fluorescein angiography: a comprehensive review of the literature. Surv Ophthalmol 2019; 64: 679–693. doi:10.1016/j.survophthal.2019.02.004.
- Chiang J, Wong E, Whatham A et al. The usefulness of multimodal imaging for differentiating pseudopapilloedema and true swelling of the optic nerve head: a review and case series. Clin Exp Optom 2015; 98: 12–24. doi:10.1111/cxo.12177.
- Ly A, Nivison-Smith L, Zangerl B et al. Advanced imaging for the diagnosis of age-related macular degeneration: a case vignettes study. Clin Exp Optom 2018; 101: 243–254. doi:10.1111/cxo.12607.
- Kalloniatis M, Wang H, Katalinic P et al. Ocular ischaemia: signs, symptoms, and clinical considerations for primary eye care practitioners. Clin Exp Optom 2022; 105: 117–134. doi:10.1080/08164622.2021.1999771.
- Wang H, Kalloniatis M. Clinical outcomes of the centre for eye health: an intra-professional optometry-led collaborative eye care clinic in Australia. Clin Exp Optom 2021; 104: 795–804. doi:10.1080/08164622.2021.1878821.
- Greig EC, Duker JS, Waheed NK. A practical guide to optical coherence tomography angiography interpretation. Int J Retina Vitreous 2020; 6: 55. doi:10.1186/s40942-020-00262-9.
- Linsenmeier RA, Zhang HF. Retinal oxygen: from animals to humans. Prog Retin Eye Res 2017; 58: 115–151. doi:10.1016/j.preteyeres.2017.01.003.
- Campbell JP, Zhang M, Hwang TS et al. Detailed vascular anatomy of the human retina by projection-resolved optical coherence tomography angiography. Sci Rep 2017; 7: 42201. doi:10.1038/srep42201.
- Savastano MC, Lumbroso B, Rispoli M. In vivo characterization of retinal vascularization morphology using optical coherence tomography angiography. Retina 2015; 35: 2196–2203. doi:10.1097/IAE.0000000000000635.
- Freiberg FJ, Pfau M, Wons J et al. Optical coherence tomography angiography of the foveal avascular zone in diabetic retinopathy. Graefes Arch Clin Exp Ophthalmol 2016; 254: 1051–1058. doi:10.1007/s00417-015-3148-2.
- Lee J, Moon BG, Cho AR et al. Optical coherence tomography angiography of DME and its association with anti-VEGF treatment response. Ophthalmology 2016; 123: 2368–2375. doi:10.1016/j.ophtha.2016.07.010.
- La Mantia A, Kurt RA, Mejor S et al. Comparing fundus fluorescein angiography and swept-source optical coherence tomography angiography in the evaluation of diabetic macular perfusion. Retina 2019; 39: 926–937. doi:10.1097/IAE.0000000000002045.
- Tan CS, Lim LW, Chow VS et al. Optical coherence tomography angiography evaluation of the parafoveal vasculature and its relationship with ocular factors. Invest Ophthalmol Vis Sci 2016; 57: 224–234. doi:10.1167/iovs.15-18869.
- Hwang TS, Jia Y, Gao SS et al. Optical coherence tomography angiography features of diabetic retinopathy. Retina 2015; 35: 2371–2376. doi:10.1097/IAE.0000000000000716.
- de Carlo TE, Romano A, Waheed NK et al. A review of optical coherence tomography angiography (OCTA). Int J Retina Vitreous 2015; 1: 5. doi:10.1186/s40942-015-0005-8.
- Pellegrini M, Cozzi M, Staurenghi G et al. Comparison of wide field optical coherence tomography angiography with extended field imaging and fluorescein angiography in retinal vascular disorders. PloS One 2019; 14: e0214892. doi:10.1371/journal.pone.0214892.
- Teussink MM, Breukink MB, van Grinsven MJ et al. OCT angiography compared to fluorescein and indocyanine green angiography in chronic central serous chorioretinopathy. Invest Ophthalmol Vis Sci 2015; 56: 5229–5237. doi:10.1167/iovs.15-17140.
- Tanaka K, Mori R, Kawamura A et al. Comparison of OCT angiography and indocyanine green angiographic findings with subtypes of polypoidal choroidal vasculopathy. Br J Ophthalmol 2017; 101: 51–55. doi:10.1136/bjophthalmol-2016-309264.
- Lim HB, Kim YW, Nam KY et al. Signal strength as an important factor in the analysis of peripapillary microvascular density using optical coherence tomography angiography. Sci Rep 2019; 9: 16299. doi:10.1038/s41598-019-52818-x.
- WuDunn D, Takusagawa HL, Sit AJ et al. OCT angiography for the diagnosis of glaucoma: a report by the American Academy of Ophthalmology. Ophthalmology 2021; 128: 1222–1235. doi:10.1016/j.ophtha.2020.12.027.
- Mehta N, Marco RD, Goldhardt R et al. Central retinal artery occlusion: acute management and treatment. Curr Ophthalmol Rep 2017; 5: 149–159. doi:10.1007/s40135-017-0135-2.
- Biousse V, Nahab F, Newman NJ. Management of acute retinal ischemia: follow the guidelines! Ophthalmology 2018; 125: 1597–1607. doi:10.1016/j.ophtha.2018.03.054.
- Bonini Filho MA, Adhi M, de Carlo TE et al. Optical coherence tomography angiography in retinal artery occlusion. Retina 2015; 35: 2339–2346. doi:10.1097/IAE.0000000000000850.
- Yang S, Liu X, Li H et al. Optical coherence tomography angiography characteristics of acute retinal arterial occlusion. BMC Ophthalmol 2019; 19: 147. doi:10.1186/s12886-019-1152-8.
- Rudkin AK, Lee AW, Chen CS. Ocular neovascularization following central retinal artery occlusion: prevalence and timing of onset. Eur J Ophthalmol 2010; 20: 1042–1046. doi:10.1177/112067211002000603.
- Kashani AH, Lee SY, Moshfeghi A et al. Optical coherence tomography angiography of retinal venous occlusion. Retina 2015; 35: 2323–2331. doi:10.1097/IAE.0000000000000811.
- Wakabayashi T, Sato T, Hara-Ueno C et al. Retinal microvasculature and visual acuity in eyes with branch retinal vein occlusion: imaging analysis by optical coherence tomography angiography. Invest Ophthalmol Vis Sci 2017; 58: 2087–2094. doi:10.1167/iovs.16-21208.
- Koulisis N, Kim AY, Chu Z et al. Quantitative microvascular analysis of retinal venous occlusions by spectral domain optical coherence tomography angiography. PloS One 2017; 12: e0176404. doi:10.1371/journal.pone.0176404.
- Hayreh SS, Rojas P, Podhajsky P et al. Ocular neovascularization with retinal vascular occlusion-III. Incidence of ocular neovascularization with retinal vein occlusion. Ophthalmology 1983; 90: 488–506. doi:10.1016/S0161-6420(83)34542-5.
- Natural history and clinical management of central retinal vein occlusion. The central vein occlusion study group. Arch Ophthalmol 1997; 115: 486–491. doi:10.1001/archopht.1997.01100150488006.
- Leasher JL, Bourne RR, Flaxman SR et al. Global estimates on the number of people blind or visually impaired by diabetic retinopathy: a meta-analysis from 1990 to 2010. Diabetes Care 2016; 39: 1643–1649. doi:10.2337/dc15-2171.
- Chua J, Sim R, Tan B et al. Optical coherence tomography angiography in diabetes and diabetic retinopathy. J Clin Med 2020; 9: 1723. doi:10.3390/jcm9061723.
- Samara WA, Shahlaee A, Adam MK et al. Quantification of diabetic macular ischemia using optical coherence tomography angiography and its relationship with visual acuity. Ophthalmology 2017; 124: 235–244. doi:10.1016/j.ophtha.2016.10.008.
- Spaide RF. Volume-rendered optical coherence tomography of diabetic retinopathy pilot study. Am J Ophthalmol 2015; 160: 1200–1210. doi:10.1016/j.ajo.2015.09.010.
- Spaide RF. Volume-rendered optical coherence tomography of retinal vein occlusion pilot study. Am J Ophthalmol 2016; 165: 133–144. doi:10.1016/j.ajo.2016.02.037.
- Vaz-Pereira S, Dansingani KK, Chen KC et al. Tomographic relationships between retinal neovascularization and the posterior vitreous in proliferative diabetic retinopathy. Retina 2017; 37: 1287–1296. doi:10.1097/IAE.0000000000001336.
- Kishi S. Vitreous anatomy and the vitreomacular correlation. Jpn J Ophthalmol 2016; 60: 239–273. doi:10.1007/s10384-016-0447-z.
- Arrigo A, Romano F, Albertini G et al. Vascular patterns in retinitis pigmentosa on swept-source optical coherence tomography angiography. J Clin Med 2019; 8: 1425. doi:10.3390/jcm8091425.
- Verbakel SK, van Huet RAC, Boon CJF et al. Non-syndromic retinitis pigmentosa. Prog Retin Eye Res 2018; 66: 157–186. doi:10.1016/j.preteyeres.2018.03.005.
- Kalloniatis M, Fletcher EL. Retinal degeneration: challenge and opportunity. Clin Exp Optom 2005; 88: 265–266. doi:10.1111/j.1444-0938.2005.tb06709.x.
- Kalloniatis M, Loh CS, Acosta ML et al. Retinal amino acid neurochemistry in health and disease. Clin Exp Optom 2013; 96: 310–332. doi:10.1111/cxo.12015.
- Inooka D, Ueno S, Kominami T et al. Quantification of macular microvascular changes in patients with retinitis pigmentosa using optical coherence tomography angiography. Invest Ophthalmol Vis Sci 2018; 59: 433–438. doi:10.1167/iovs.17-23202.
- Santos A, Humayun MS, de Juan E Jr. et al. Preservation of the inner retina in retinitis pigmentosa. A morphometric analysis. Arch Ophthalmol 1997; 115: 511–515. doi:10.1001/archopht.1997.01100150513011.
- Battaglia Parodi M, Cicinelli MV, Rabiolo A et al. Vessel density analysis in patients with retinitis pigmentosa by means of optical coherence tomography angiography. Br J Ophthalmol 2017; 101: 428–432. doi:10.1136/bjophthalmol-2016-308925.
- Miyata M, Oishi A, Hasegawa T et al. Concentric choriocapillaris flow deficits in retinitis pigmentosa detected using wide-angle swept-source optical coherence tomography angiography. Invest Ophthalmol Vis Sci 2019; 60: 1044–1049. doi:10.1167/iovs.18-26176.
- Shen C, Li Y, Wang Q et al. Choroidal vascular changes in retinitis pigmentosa patients detected by optical coherence tomography angiography. BMC Ophthalmol 2020; 20: 384. doi:10.1186/s12886-020-01640-5.
- Liu J, Shen MR, Rosenfeld PJ. OCT angiography imaging of macular neovascularization in AMD. In: Jacoby R, editor. Age-related macular degeneration and other causes of choroidal neovascularizaton. Moran CORE Open Source Ophthalmology Education for Students, Residents, Fellows, Healthcare Workers, and Clinicians; 2022 [accessed 2024 Feb 8]. https://morancore.utah.edu/section-12-retina-and-vitreous/oct-angiography-imaging-of-macular-neovascularization-in-amd/.
- Arrigo A, Bianco L, Antropoli A et al. New OCT and OCTA insights in inherited retinal dystrophies. In: Giudice G Gattazzo I, editors. Optical coherence tomography. Rijeka: Intech Open; 2023 [accessed 2023 Feb 8]. https://www.intechopen.com/chapters/85971.
- Cideciyan AV, Swider M, Aleman TS et al. ABCA4 disease progression and a proposed strategy for gene therapy. Hum Mol Genet 2009; 18: 931–941. doi:10.1093/hmg/ddn421.
- Alonso-Caneiro D, Kugelman J, Tong J et al. Use of uncertainty quantification as a surrogate for layer segmentation error in Stargardt disease retinal OCT images. In Zhou J, Salvado O, Sohel F, Borges P, Vinicius K Wang S, editors. Proceedings of the 2021 Digital Image Computing: Techniques and Applications (DICTA); p. 1–8; 2021; United States of America: Institute of Electrical and Electronics Engineers Inc.
- Al-Khuzaei S, Broadgate S, Foster CR et al. An overview of the genetics of ABCA4 retinopathies, an evolving story. Genes (Basel) 2021; 12: 1241. doi:10.3390/genes12081241.
- Battaglia Parodi M, Cicinelli MV, Rabiolo A et al. Vascular abnormalities in patients with Stargardt disease assessed with optical coherence tomography angiography. Br J Ophthalmol 2017; 101: 780–785. doi:10.1136/bjophthalmol-2016-308869.
- Arrigo A, Romano F, Aragona E et al. OCTA-based identification of different vascular patterns in Stargardt disease. Transl Vis Sci Technol 2019; 8: 26. doi:10.1167/tvst.8.6.26.
- Heath Jeffery RC, Chen FK. Stargardt disease: multimodal imaging: a review. Clin Exp Ophthalmol 2021; 49: 498–515. doi:10.1111/ceo.13947.
- Wong WL, Su X, Li X et al. Global prevalence of age-related macular degeneration and disease burden projection for 2020 and 2040: a systematic review and meta-analysis. Lancet Glob Health 2014; 2: e106–116. doi:10.1016/S2214-109X(13)70145-1.
- Wang W, Gawlik K, Lopez J et al. Genetic and environmental factors strongly influence risk, severity and progression of age-related macular degeneration. Signal Transduct Target Ther 2016; 1: 16016. doi:10.1038/sigtrans.2016.16.
- Ammar MJ, Hsu J, Chiang A et al. Age-related macular degeneration therapy: a review. Curr Opin Ophthalmol 2020; 31: 215–221. doi:10.1097/ICU.0000000000000657.
- Muakkassa NW, Chin AT, de Carlo T et al. Characterizing the effect of anti-vascular endothelial growth factor therapy on treatment-naive choroidal neovascularization using optical coherence tomography angiography. Retina 2015; 35: 2252–2259. doi:10.1097/IAE.0000000000000836.
- Khan H, Aziz AA, Sulahria H et al. Emerging treatment options for geographic atrophy (GA) secondary to age-related macular degeneration. Clin Ophthalmol 2023; 17: 321–327. doi:10.2147/OPTH.S367089.
- Biarnés M, Garrell-Salat X, Gómez-Benlloch A et al. Methodological appraisal of phase 3 clinical trials in geographic atrophy. Biomedicines 2023; 11: 1548. doi:10.3390/biomedicines11061548.
- Toto L, Borrelli E, Di Antonio L et al. Retinal vascular plexuses’ changes in dry age-related macular degeneration, evaluated by means of optical coherence tomography angiography. Retina 2016; 36: 1566–1572. doi:10.1097/IAE.0000000000000962.
- Borrelli E, Shi Y, Uji A et al. Topographic analysis of the choriocapillaris in intermediate age-related macular degeneration. Am J Ophthalmol 2018; 196: 34–43. doi:10.1016/j.ajo.2018.08.014.
- Cicinelli MV, Rabiolo A, Sacconi R et al. Retinal vascular alterations in reticular pseudodrusen with and without outer retinal atrophy assessed by optical coherence tomography angiography. Br J Ophthalmol 2018; 102: 1192–1198. doi:10.1136/bjophthalmol-2017-311317.
- Trinh M, Kalloniatis M, Nivison-Smith L. Vascular changes in intermediate age-related macular degeneration quantified using optical coherence tomography angiography. Transl Vis Sci Technol 2019; 8: 20. doi:10.1167/tvst.8.4.20.
- Trinh M, Kalloniatis M, Nivison-Smith L. Radial peripapillary capillary plexus sparing and underlying retinal vascular impairment in intermediate age-related macular degeneration. Invest Ophthalmol Vis Sci 2021; 62: 2. doi:10.1167/iovs.62.4.2.
- Carnevali A, Mastropasqua R, Gatti V et al. Optical coherence tomography angiography in intermediate and late age-related macular degeneration: review of current technical aspects and applications. Appl Sci 2020; 10: 8865. doi:10.3390/app10248865.
- Schneider EW, Fowler SC. Optical coherence tomography angiography in the management of age-related macular degeneration. Curr Opin Ophthalmol 2018; 29: 217–225. doi:10.1097/ICU.0000000000000469.
- Campochiaro PA. Molecular pathogenesis of retinal and choroidal vascular diseases. Prog Retin Eye Res 2015; 49: 67–81. doi:10.1016/j.preteyeres.2015.06.002.
- Pugazhendhi A, Hubbell M, Jairam P et al. Neovascular macular degeneration: a review of etiology, risk factors, and recent advances in research and therapy. Int J Mol Sci 2021; 22: 1170. doi:10.3390/ijms22031170.
- Finger RP, Daien V, Eldem BM et al. Anti-vascular endothelial growth factor in neovascular age-related macular degeneration - a systematic review of the impact of anti-VEGF on patient outcomes and healthcare systems. BMC Ophthalmol 2020; 20: 294. doi:10.1186/s12886-020-01554-2.
- Costanzo E, Miere A, Querques G et al. Type 1 choroidal neovascularization lesion size: indocyanine green angiography versus optical coherence tomography angiography. Invest Ophthalmol Vis Sci 2016; 57: 307–313. doi:10.1167/iovs.15-18830.
- Huang D, Jia Y, Rispoli M et al. Optical coherence tomography angiography of time course of choroidal neovascularization in response to anti-angiogenic treatment. Retina 2015; 35: 2260–2264. doi:10.1097/IAE.0000000000000846.
- Staropoli PC, Iyer P, Gregori G et al. Identification of macular neovascularization in central serous chorioretinopathy using swept-source OCT angiography. Am J Ophthalmol Case Rep 2023; 30: 101843. doi:10.1016/j.ajoc.2023.101843.
- Shen M, Zhou H, Kim K et al. Choroidal changes in eyes with polypoidal choroidal vasculopathy after anti-VEGF therapy imaged with swept-source OCT angiography. Invest Ophthalmol Vis Sci 2021; 62: 5. doi:10.1167/iovs.62.15.5.
- Mastropasqua R, Evangelista F, Amodei F et al. Optical coherence tomography angiography in macular neovascularization: a comparison between different OCTA devices. Transl Vis Sci Technol 2020; 9: 6. doi:10.1167/tvst.9.11.6.
- Brown RB, Mohan S, Chhablani J. Pachychoroid spectrum disorders: an updated review. J Ophthalmic Vis Res 2023; 18: 212–229. doi:10.18502/jovr.v18i2.13188.
- Borooah S, Sim PY, Phatak S et al. Pachychoroid spectrum disease. Acta Ophthalmol 2021; 99: e806–e822. doi:10.1111/aos.14683.
- Sagar P, Sodhi PS, Roy S et al. Pachychoroid neovasculopathy: a comparative review on pathology, clinical features, and therapy. Eur J Ophthalmol 2022; 32: 767–780. doi:10.1177/11206721211036290.
- Moghimi S, Bowd C, Zangwill LM et al. Measurement floors and dynamic ranges of OCT and OCT angiography in glaucoma. Ophthalmology 2019; 126: 980–988. doi:10.1016/j.ophtha.2019.03.003.
- Yarmohammadi A, Zangwill LM, Diniz-Filho A et al. Peripapillary and macular vessel density in patients with glaucoma and single-hemifield visual field defect. Ophthalmology 2017; 124: 709–719. doi:10.1016/j.ophtha.2017.01.004.
- Verticchio Vercellin A, Siesky B, Antman G et al. Regional vessel density reduction in the macula and optic nerve head of patients with pre-perimetric primary open angle glaucoma. J Glaucoma 2023; 32: 930–941. doi:10.1097/IJG.0000000000002310.
- Lee EJ, Han JC, Kee C et al. Peripapillary vascular density in compressive optic neuropathy and normal-tension glaucoma: a severity-controlled comparison. Invest Ophthalmol Vis Sci 2023; 64: 10. doi:10.1167/iovs.64.12.10.
- Ling JW, Yin X, Lu QY et al. Optical coherence tomography angiography of optic disc perfusion in non-arteritic anterior ischemic optic neuropathy. Int J Ophthalmol 2017; 10: 1402–1406. doi:10.18240/ijo.2017.09.12.
- De Rojas JO, Rasool N, Chen RW et al. Optical coherence tomography angiography in Leber hereditary optic neuropathy. Neurology 2016; 87: 2065–2066. doi:10.1212/WNL.0000000000003313.
- Abe M, Omodaka K, Kikawa T et al. Radial peripapillary capillary density in superior segmental optic hypoplasia measured with OCT angiography. BMC Ophthalmol 2020; 20: 199. doi:10.1186/s12886-020-01453-6.