
ABSTRACT
Clinical Relevance
Children with vision impairment can have difficulty accessing classroom reading material and knowledge of which students are likely to have improved performance reading performance with reverse polarity would be of value to educators.
Background
Printed material is typically presented as black text on a white background; however, reversing the polarity to white text on a black background may improve the reading speed for children with vision impairment. This study sought to identify the visual function or pathological features of children with vision impairment where reversing the polarity of text would improve their reading performance.
Methods
Forty-eight vision-impaired participants (27 male), aged 5–18 years with binocular visual acuities between 0.18–1.52 logMAR, were included. Reading performance was assessed by changes in Critical Print Size (ΔCPS), Maximum Reading Speed (ΔMRS) in normal and reverse polarity digital print, and numeric reading speed (ΔNRS) with normal and reverse polarity fonts. Correlations were made with 30 Hz flicker electroretinogram amplitude and high/low contrast acuity. Paired nonparametric tests evaluated significance in pathological condition groups.
Results
Significant negative correlations were only found between the 30 Hz flicker amplitude and ΔMRS (r = −.42, p = .028) and ΔNRS (r = −.46, p = .027). Follow-up pairwise comparisons based on pathology group only showed a significant effect of the retinal dystrophy group and CPS (n = 12, z = −2.24, p = .025). All other pairwise comparisons based on group were non-significant (p > .05).
Conclusions
This study did not identify a specific pathological group or visual functional measure that could be used as a clinical marker to predict the impact of reversing polarity. However, significant improvements could be made in reading performance for some children and so a reading performance assessment is recommended for all children with vision impairment.
Introduction
Children with vision impairment can have difficulty accessing classroom reading material, which can negatively impact their overall academic achievement.Citation1–4 Most reading material in school is presented in normal polarity (black font on a white background). Normal polarity stimulates predominantly the OFF-signalling pathways in the retina, as a dark letter stimulates the centre receptive field, which is surrounded by a brighter surround generating negative contrast. Whereas reverse polarity text (white text on a black background) stimulates predominantly the ON-signalling pathways.Citation5
Children with vision impairment report poorer overall enjoyment of school, with a high proportion experiencing negative comments and episodes of bullying related to their vision impairment.Citation6,Citation7 Worldwide there are an estimated 19 million school-aged children affected by vision impairment,Citation8,Citation9 and despite advances in medical interventions, greater access to healthcare, and more awareness of the additional supports these children require in the classroom, there remains a considerable burden placed on families, education and health services to adequately support these individuals to achieve full independence.Citation10–12
Children with any disability have the right to a quality education and learningCitation13 and most students with vision impairment are now educated within mainstream schools alongside their normally sighted peers.Citation14 Guidelines to assist teaching students with vision impairment exist,Citation13 however, teachers acknowledge that support could be improved with access to a greater understanding of available adaptive technologies.Citation15 These adaptive technologies can include the use of reverse polarity text, and the knowledge of which students are likely to have improved performance with reverse polarity would be of value to educators.
Current estimates of classroom tasks for school-aged children are 47% near, 29% distance, 15% combined distance to near, and 9% computer-based.Citation16 However, for children with vision impairment, most learning materials are near-based, with a greater use of screens to enable the use of adaptive technologies which enable adjustable font sizes, voice activation and audio to facilitate learning.Citation17 Due to these interventions, near and computer-based digital visual demands are greater for students with vision impairment but also easier to manipulate to optimise parameters such as: font size, text polarity and contrast to improve reading performance. Therefore, early, and appropriate support for developing reading is essential for students with vision impairment, so that they can attain the required skills to maximise their reading performance and achieve their full academic potential.Citation18–20
The qualitative impact of vision impairment on the education of a a child has been explored using focus groups. The findings indicated that vision impaired children dislike reading and try to avoid it, compared to their normally sighted peers.Citation6 This is because reading requires extra effort for an individual with vision impairment and can produce additional visual fatigue and tiredness.Citation21 The dislike and avoidance of reading in children with vision impairment may additionally limit any supplementary recreational reading at home which further reduces their reading experiences outside of the classroom for pleasure and further learning.
There are limited studies in this field that have explored possible interventions that could improve the overall reading performance and satisfaction with reading despite the growing integration of children with vision impairment being educated alongside their normally sighted peers.Citation22 Corn et al.Citation23 demonstrated that there was a significant increase in reading speed for students in grades 1–3 with vision impairment after four months of using an optimised optical device, however the improvements were not observed in children in later years of education. They concluded that educational interventions aimed at enhancing reading proficiency should be introduced in the early stages of education during the ‘learning to read’ period. This timing ensured the development of foundational skills that were essential to ensure students have a broader and more effective access to reading materials in school.
Legge et al.Citation24 performed a small study in 16 individuals with low vision aged 14–76 years, with varying aetiologies. The study investigated various factors that could potentially impact reading performance and found that near reading acuity, extent of any central scotoma, and the clarity of ocular media were the best predictors for maximal reading speed and overall reading performance as measured by the number of words per minute read from text scanned across a monitor. Given that clarity the of ocular media caused by cataract and hence glare would reduce reading performance, the group then studied the impact of reducing glare by using reverse polarity on reading performance.Citation25
In a larger sample of 141 low vision subjects, they compared the effect of reversing polarity print on individuals with clear or cloudy media.Citation26 If there was any evidence of corneal scarring, cataract, or vitreous debris, the ocular media was identified as ‘cloudy’ (n = 45), otherwise it was identified as clear. They found that individuals who preferred the reverse polarity did so because they were impacted by glare and light scatter from cloudy media, compared with normal polarity text. Based on this observation it may be that children with pathologies that cause glare, such as albinism or cone dystrophy,Citation6 would benefit more from reversed polarity text by reducing the larger glare source associated with normal (black on white) polarity text.
Normal polarity increases the legibility of text – termed the ‘positive polarity’ advantage.Citation27 The mechanism is believed to be due to a constriction of the pupil as the overall illuminance is higher and decreases spherical aberrations giving a clearer retinal image.Citation28 One study reported that when screen luminance was kept constant by controlling text and background illumination so that pupil size was constant for either reversed or normal polarity text, then the ‘positive polarity’ advantage was not apparent, supporting the hypothesis that miosis and reduced spherical aberrations contribute to better reading performance with normal polarity text.Citation28
This study aimed to identify children with vision impairment who would benefit from reverse polarity to improve their reading performance in the classroom.
To further assess the impact of reverse polarity digital, and paper-based print on reading performance in children with vision impairment, this study examined changes in reading performance based on clinical diagnosis and visual function, to ascertain if changes in text polarity would impact reading performance based on these clinical measures.
As previous studies have concluded that an improvement in reading performance using reverse polarity print was due to reduced light scatter and glare,Citation25,Citation26 this study further investigated the impact of reverse polarity text on visual functional measures including visual electrophysiology to determine if reading performance was related to retinal function.
Methods
Participants
Participants were recruited from the South Australian state-wide support service for children with vision impairment. Exclusion criteria included intellectual disability, autism spectrum disorder,Citation29 dyslexia or an inability to read either normal or reverse polarity text using the maximum print size available on the screen (58 point-font).
Forty-eight of eighty children (age, mean ± standard deviation 12.4 ± 3.0 and academic year, 6.5 ± 3.0; with n = 27 males) passed screening and were enrolled in the study. Binocular visual acuities ranged from 0.18 to 1.52 logMAR with the majority n = 40, (83%) having nystagmus as their primary cause of vision impairment or as a comorbid complication of their main pathology which included: albinism (n = 14), retinal dystrophies (n = 12), optic nerve disorders (n = 10), infantile nystagmus(n = 4), retinopathy of prematurity (n = 2), uveitis (n = 2) and one case each of congenital glaucoma, congenital cataracts, retinal detachment or iris/choroidal coloboma.
Pathology groups
Participants were divided into four broad groups based on pathological numbers, to determine if certain pathologies had an improved performance with reverse polarity. No significant differences (p > .05) between groups for sex, age, academic year, visual acuity, or contrast sensitivity. See for details of the pathology group demographics.
Table 1. Characteristics of vision impairment study population by pathology group.
Due to fixational instability, extreme glare sensitivity, and non-compliance, not all tests of visual function were completed on all children with a range of 23–43 measures completed across the categories.
Visual function
Binocular distance visual acuity and binocular near contrast sensitivity were measured under normal classroom illumination of 200–250 lux with habitual correction if required. All tests used Landolt Cs with four alternative forced choice test strategy for high and low contrast acuity thresholds using the Freiburg Visual Acuity Test,Citation30 incorporating best Parameter Estimation Sequential Testing to determine the best estimate of each acuity measure.Citation31
Assessment of retinal cone function was performed using the full field light adapted 30 Hz flicker electroretinogram recorded using the handheld RETeval (LKC Technologies Inc, Gaithersburg, MD, USA) with skin electrodes located 2 millimetres below the lower lid as per the manufacturer’s recommendations and in accordance with current clinical standards.Citation32 30 Hz flicker ERG was selected as it produced the highest signal-to-noise ratio, and the highest ERG amplitude was taken as it represented the maximum cone response. The Troland protocol was used, which dynamically changes the stimulus intensity according to the pupil size, so that mydriasis was not required.Citation33
A 32 Td.s white light with no background was always presented to the right eye first then the left eye. The largest reported peak amplitude from either the right or left eye was used for analysis as an indication of best retinal function.
Reading performance
Digital material
Digital reading performance was assessed using the MNREAD, a reading application, developed by the Minnesota Laboratory for Low Vision ResearchCitation34 running on an iPad7, 10.2-inch retina display (2160 by 1620-pixel resolution at 264 pixel per inch, refresh rate 60 Hz). MNREAD assesses several reading metrics including minimum font size read (reading acuity), critical print size (CPS) and maximum reading speed (MRS).
The test distance was inputted before testing for each participant, typically this was 40 centimetres, but in cases of very low visual acuity the reading distance was reduced to 10 centimetres. The MNREAD programme displays a single sentence in the centre of the screen at the tap of a finger, which also starts the timer. The participant was asked to read the sentence aloud, as quickly and as accurately as possible. Once read, a finger tap on the screen stopped the built-in timer and the score screen displayed the time taken to read the sentence. Additional sentences were then displayed at reducing print sizes until the participant could no longer read the text, or the participant made 10 or more errors.
Each participant was encouraged to read even when the print size was difficult and to stop only when the print was too small to be read. A practice test was performed before reading normal and reverse polarity text to familiarise the subject with the test. The reading distance was measured using a metal ruler before each trial and was visually monitored throughout reading. The output screen displayed the calculations of performance measures for reading acuity, CPS in logMAR and MRS in words per minute.
Of these metrics, two measures of reading performance were used. The CPS is the minimum font size to enable sustained reading performance, and is defined as the smallest print size that an individual can read at 90% of their MRS.Citation35 The MRS is calculated as the average words per minute read when reading speed is not limited by print size, before the CPS is reached.Citation36 All measures were performed using high contrast normal polarity (black on white) and reverse (white on black) Times New Roman Print.
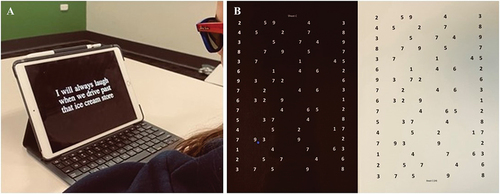
The luminance values of normal and reverse polarity screens were measured using a Minolta Colorimeter CS-100 (Konica, Minolta, Japan) with overall photopic luminance 112 cd/m2 and 9.6 cd/m2 respectively. Each measure of MRS and CPS was recorded for normal then reverse polarity with the change in digital reading performance measures (ΔCPS and ΔMRS) defined as the difference between the normal minus the reverse polarity condition. shows a participant reading reverse polarity text generated by the MNREAD application on an iPad.
Figure 1. A: Participant reading reverse polarity digital text using the MNREAD platform on an iPad. Participants were asked to read aloud as quickly and as accurately as possible until they could no longer see the text or made 10 or more errors in their reading. B: Printed laminated matte A4 cards with reverse polarity numerals (N24 Times New Roman) with 16 lines with 1.5 line spacing and 5 numerals per line. The participant was instructed to read from top to bottom left to right as quickly and as accurately as possible. The time taken was recorded using a stopwatch in seconds with a second added for each misread numeral to the total time.
Paper material
Printed material using 24-point Times New Roman text on high contrast A4 black on white (normal) or white on black (reversed) matte laminated cards were used to evaluate numerical reading speed (NRS) based on the design of the Horizontal Developmental Eye Movement test.Citation37 Each card contained eighty numerals (1–9) that were randomly spaced on the card forming a grid of 16 lines with 1.5-line spacing consisting of 5 numerals randomly spaced along each line (see ).
Participants were instructed to read the numbers aloud, horizontally from left to right, as quickly and accurately as possible. The time taken to read every number on the card was recorded using the Apple stopwatch in the Clock App with one second added for any incorrectly read numeral. Two practice runs were allowed with different number cards prior to the timed test to minimise any learning effects.
The change in numerical reading speed (ΔNRS) (normal minus reversed) was calculated in seconds with the normal polarity always presented first. A lower numerical value of time indicated an improved performance as the participant was able to read the numbers on the card at a faster rate.
Statistics
Statistical analyses were performed using SPSS Version 28.0.1 with Pearson correlation coefficients used to determine the relationships between reading performance and functional vision parameters. For paired data the effects of reading performance between normal polarity and reverse polarity were assessed using the Wilcoxon paired signed ranked test. A two-tailed p-value of < .05 was regarded as significant. All results are reported as mean ± standard deviation, with a range of minimum and maximum measures obtained, unless otherwise stated.
This study was approved by the Women’s and Children’s Health Network, Human Research Ethics Committee, South Australia, and the South Australian Department of Education. All children and parents gave informed written informed consent prior to participation and conformed to the tenets of the declaration of Helsinki for research involving human subjects.
Results
Reading performance and visual function
When the changes in reading performance (ΔMRS, ΔCPS and ΔNRS) were correlated with measures of visual function (acuity, contrast sensitivity and the 30 Hz flicker amplitude), there were only significant relationships between the 30 Hz flicker amplitude and the changes in reading speed for digital and paper-based reading performance (see ). The ΔMRS and ΔNRS were 1.0 ± 14.8 with range + 37.0 to −29.0 words per minute and 0.3 ± 4.9 with range −8.39 to +14.3 seconds respectively.
The ΔCPS was 0.01 ± 0.1 with range −0.4 to +0.4 logMAR. There was a significant negative correlation between ΔMRS (r = −.42, p = .028) and ΔNRS (r = −.46, p = .027) with the 30 Hz flicker amplitude. In contrast, there were no significant correlations between binocular visual acuity or contrast sensitivity with any measures of reading performance (p > .21). See and for details.
Figure 2. Change in maximal reading speed (ΔMRS) between digital normal and reverse polarity and 30 Hz flicker amplitude. A positive MRS indicated that text was read faster with reverse polarity font, and a negative MRS was slower. A significant negative correlation (p = .028) was found indicating that retinal cone function was associated with reduced MRS when the polarity of the print was reversed.
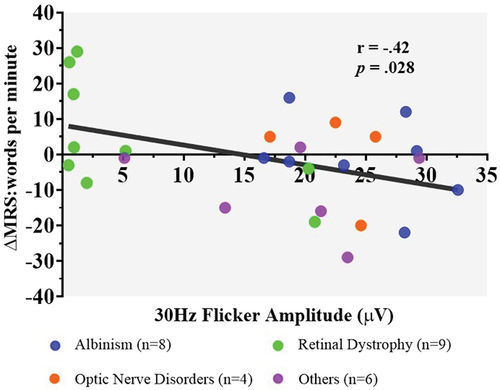
Figure 3. Relationship between change in paper-based numeric reading speed (ΔNRS) using paper-based reading material and 30 Hz flicker amplitude as a measure of retinal function. A significant (p = .027) was observed indicating that NRS decreased with reversed polarity when cone function was greater. A positive ΔNRS value indicates the number of seconds faster the card was read, while a negative value reflects the number of seconds it was slower.
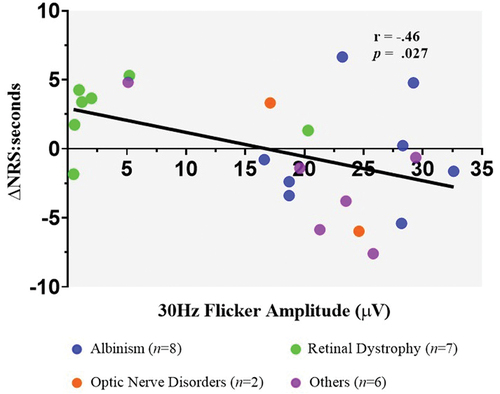
Table 2. Pearson correlation coefficients and significance levels, for changes in mean reading speed (ΔMRS), critical print size (ΔCPS), and numerical reading speed (ΔNRS) between normal and reverse polarity with measures of visual function: (30 Hz flicker amplitude, binocular visual acuity (logMAR) and contrast sensitivity (logCS).
Reading performance and pathology
Pairwise comparisons between normal and reverse polarity showed no significant differences for all participants (n = 48) using digital text: CPS (z = .01; p = .99) and MRS (z = .31; p = .76) or printed text (n = 31): NRS (z = .42; p = .67).
Exploratory follow-up pairwise comparisons were conducted to investigate the impact of pathology on reading performance with reverse polarity text. The measures of reading performance only showed a significant effect of the retinal dystrophy group and CPS () (n = 12, z = −2.24, p = .025). All other pairwise comparisons based on group were not significant (p > .05), see for details and that illustrate the mean changes in reading performance measures based on group.
Figure 4. A: Change in mean maximum reading speed (ΔMRS) between normal and reverse polarity using digital text compared with pathological group. Albinism and the retinal dystrophy group demonstrated a mean increase in MRS, and the optic nerve disorder and ‘other’ group had a mean decrease in MRS with reverse polarity text. B: Change in mean numerical reading speed (ΔNRS) between normal and reverse polarity using printed numbers, compared with pathological group. The albinism and optic nerve disorder groups demonstrated a mean increase in NRS, and retinal dystrophy and ‘other’ group had a mean decrease in NRS with the reverse polarity text. The dotted lines indicate the standard error of the mean. C: Change in critical print size (ΔCPS) that can be read on an electronic device. compared with pathological group. Albinism and the ‘other’ group showed a mean increase in font size required indicating a poorer performance whilst the retinal dystrophy group had a significantly (p = .025) better performance as indicated by a reduced CPS when using reverse polarity digital text.
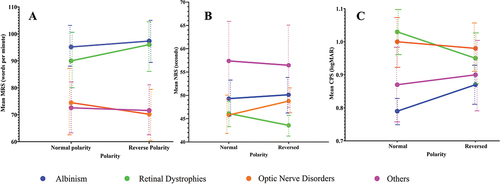
Figure 5. A: Change in maximal reading speed (ΔMRS) between normal and reverse polarity using digital text in individuals in the retinal dystrophy group. A higher MRS indicates a faster reading speed and better reading performance. B: Change in critical print size (ΔCPS) that can be read on an electronic device in the individuals from the retinal dystrophy group. An increase in CPS indicated a larger font size was required and therefore reduced reading performance. Each colour represents an individual participant’s performance in the normal and reverse polarity condition for the reading task.
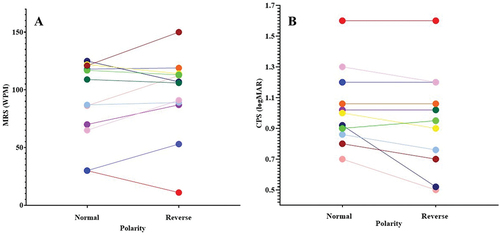
Table 3. Results of Wilcoxon pairwise signed ranked test of significance for reading performance measures (mean reading speed (MRS), numerical reading speed (NRS) and critical print size (CPS)) and group based on primary pathology.
Discussion
This study investigated the effects of reversing the polarity of digital and printed reading material in children with vision impairment.
Reading performance and visual function
One of the aims of the study was to determine if any measures of visual function could be used to identify children who might benefit from reversing the polarity of their reading material. Of the measures of visual function, only the 30 Hz flicker amplitude, which is a measure of retinal cone function had a significant negative correlation with improvements in reading speed for digital (p = .028) and printed materials (p = .027). No other measures of reading performance (acuity or contrast sensitivity) reached significance (p > .05). Therefore, these standard clinical measures of distance vision and contrast sensitivity were poor predictors of likely improvement in reading speed with reverse polarity print.
Impact of pathology
To further explore the possibility that improvements in reading performance may be linked to the underlying pathological cause of the vision impairment, comparisons were made of reading performance by group, using normal to reversed digital and printed text materials. In the retinal dystrophy group (n = 12), there was a significant improvement in CPS required when using reverse polarity compared to normal polarity digital text (p = .025). This suggested that children with a retinal dystrophy may be more likely to achieve better reading performance when reverse polarity is used.
Although ΔMRS using reverse polarity text did not reach significance for the groups (p > .35) there was a trend for faster reading times in children with a diagnosis of a retinal dystrophy or albinism, whilst MRS decreased for those with an optic nerve or other disorder classification. However, the results were variable, and an individual assessment of reading performance is required to determine if students would benefit from using reverse polarity font.
Critical print size
The requirement for a larger font size with reverse polarity print for participants with albinism and optic nerve disorders corroborates previous research on electronic reverse polarity and individuals with normal vision, which showed that when negative polarity displays were used (such as in car dashboards at night), then a larger font size was required.Citation27,Citation28 This is important when supporting students in the classroom because they may find reverse polarity media more comfortable to use. Depending on their underlying pathology, however, they may require a larger text size. This study also suggests that the comfort benefit of using reverse polarity may be limited to electronic screen use for students with albinism and optic nerve disorders due to higher illumination levels, as the same advantage does not appear to exist with paper-based text.
Retinal dystrophy
In contrast, students with retinal dystrophies did not need to increase text size to read faster, and they also demonstrated a similar benefit from reading electronic and paper-based material with reverse polarity media. The change in font size requirement ranged from −0.05 to 0.40 logMAR (see ), indicating that for some students a significantly smaller font size was required in reverse polarity font. This is contrary to individuals with normal vision who require a larger font size to read in reverse polarity.Citation27,Citation28
One possible explanation could be that in addition to glare, other mechanisms could contribute to the improvement in reading performance. The reduced, 30 Hz flicker amplitude demonstrated that there was generalised retinal cone dysfunction and this was correlated with improved reading performance when reverse polarity text was used.
Using normal polarity on MNREAD increases screen luminance and decreases pupil size, resulting in a clearer retinal image as aberrations are reduced, and light rays are focused on the central, rod-free, fovea. In a retinal dystrophy however, particularly one that involves cone dysfunction, this may result in a deterioration in vision. It is also possible that a larger pupil is required to utilise an increased area of photoreceptor function due to an increase in cone spacing – as cone photoreceptor spacing is correlated with visual acuity in individuals with retinal degenerations.Citation38
Impact of glare
Glare is a common finding in students with vision impairment and can lead to visual fatigue during the school day. This may be due to iris transillumination in albinism, an increase in nystagmus associated with poor acuity or ocular-motor control, or photophobia due to cone dysfunction. As a result, many students with vision impairment are more comfortable working under reduced room illumination.Citation21,Citation39
Font displayed on an electronic screen using normal polarity results in higher illumination levels than with reverse polarity. For students sensitive to glare, converting the screen to reverse polarity reduces the illumination levels (while maintaining the same contrast) and may consequently produce a more comfortable working medium for these students. Despite previous studies suggesting that glare is a predictor of increased reading performance with reverse polarityCitation25,Citation26 this study did not find that students with albinism demonstrated a significant improvement, however, this may have been due to the small sample size and larger studies would be recommended. More studies are required to investigate other factors that may impact improved reading performance with reverse polarity, such as tracking eye movements and changes in pupil diameter with screen luminance. It was noted that four students with largest increases in MRS with reverse polarity all had manifest nystagmus, whereas the four largest decreases in reading speed with reverse polarity did not have nystagmus.
Future studies could investigate the contribution of the ON- and OFF-retinal pathways in retinal dystrophies, as normal polarity stimulates the OFF-pathway and reverse polarity the ON-pathway. Possible changes in these pathways in children with retinal dystrophies may result in the improvement in reading performance with reverse polarity.
There was a large variability within the groups at an individual level with some children showing an improvement in reading performance whilst others did not when reverse polarity text was used. There was no direct physiological explanation for these findings. For example, a 12-year-old female with cone dystrophy, had a 30 Hz flicker amplitude of 1.0 µV, a visual acuity of 1.00 logMAR was excluded from analysis due to her low reading speed with normal polarity print, which made it not possible to calculate a critical (optimal) print size. However, when polarity was reversed, the minimum font size she could read reduced from 46-point font with normal polarity, to 23-point font with reverse polarity.
CPS was recorded as 1.12 logMAR and MRS increased from 4.69 words per minute with normal polarity to 40 words per minute with reverse polarity. A recent case report of a child with a cone-dystrophy has also shown that reverse polarity can improve reading performance based on measures of reading speed and print size requirements supporting the potential of reverse polarity print to assist some students with vision impairment to improve their reading performance.Citation39 In contrast a 14-year-old male with optic nerve hypoplasia and a visual acuity of 0.40 logMAR demonstrated poorer reading performance with reverse polarity font. His minimum acuity increased from 12-point font with normal polarity, to 15-point font with reverse polarity. CPS size increased from 14-point to 18-point font and MRS reduced from 84 to 58 words per minute.
Study limitations
This research was an exploratory study to determine if improvements could be made for students with vision impairment when using reverse polarity. It was also to investigate if these improvements were solely due to glare or related to retinal function. Due to the prevalence of childhood vision impairment in South Australia and the research conducted during the COVID-19 pandemic then the sample size was small. Further research with a larger sample size would be warranted including using a reversed reading test order for normal and reverse polarity print to eliminate possible practice effects.
Although multifocal ERG would have given a better indication of cone function at the macula used for reading, the majority of students had nystagmus and, therefore difficulty with fixation, so flicker ERG was used to give a measure of overall retinal function during daylight conditions. Further research with a larger sample size would be warranted and the use of extended flash ERG to investigate the role of ON and OFF pathways and reverse polarity.
Conclusions
Childhood vision impairment is complex, and different pathologies demonstrate different visual behaviours. This study has shown that reverse polarity print has a role to play in the support of some students with vision impairment, particularly students with retinal dystrophies. However, retinal dystrophies are a complex and heterogeneous collection of disorders, with a wide range of defects at the molecular and cellular level affecting primarily rod or cone pathways or the macular region.Citation40
It may not be possible to fully understand the process of why some students prefer reverse polarity. Individual assessments, however, may provide enhanced support for students with vision impairments and allow for tailored requirements to their specific needs. This would determine the most appropriate, and comfortable, tools to access educational materials throughout education.
Students with retinal dystrophies may benefit from using reverse polarity on electronic and printed materials without the need for larger font sizes. Students affected by glare, such as albinism and nystagmus, may also benefit from the use of reverse polarity text while using electronic font, but may require enlargement of font size for sustained reading.
Further work is required to investigate a comprehensive range of functional requirements, on an individual basis, to enable adequate support of a child with vision impairment through education.
Acknowledgments
The authors thank the students and teachers at the South Australian School and Services for Vision Impaired. The authors would also like to thank The South Australian Department of Education for their cooperation.
Disclosure statement
No potential conflict of interest was reported by the author(s).
References
- White SLJ, Wood JM, Black AA et al. Vision screening outcomes of Grade 3 children in Australia: differences in academic achievement. Int J Educ Res 2017; 83: 154–159. doi:10.1016/j.ijer.2017.03.004.
- de Verdier K, Ek U. A longitudinal study of reading development, academic achievement, and support in Swedish inclusive education for students with blindness or severe visual impairment. J Vis Impair Blind 2014; 108: 461–472. doi:10.1177/0145482X1410800603.
- Naipal S, Rampersad N. Visual ability in adolescents with visual impairment. Br J Vis Impair 2020; 38: 151–159. doi:10.1177/0264619619892993.
- Loh L, Prem-Senthil M, Constable PA. A systematic review of the impact of childhood vision impairment on reading and literacy in education. J Optom 2024; 17: 100495. doi:10.1016/j.optom.2023.100495.
- Aleman A, Wang M, Schaeffel F. Reading and myopia: contrast polarity matters. Sci Rep 2018; 8: 10840. doi:10.1038/s41598-018-28904-x.
- Decarlo DK, McGwin G, Bixler ML et al. Impact of pediatric vision impairment on daily life: results of focus groups. Optom Vis Sci 2012; 89: 1409–1416. doi:10.1097/OPX.0b013e318264f1dc.
- Khadka J, Ryan B, Margrain TH et al. Listening to voices of children with a visual impairment: a focus group study. Br J Vis Impair 2012; 30: 182–196. doi:10.1177/0264619612453105.
- Solebo AL, Teoh L, Rahi J. Epidemiology of blindness in children. Arch Dis Child 2017; 102; 853–857. doi:10.1136/archdischild-2016-310532.
- Gilbert C, Foster A. Childhood blindness in the context of VISION 2020 - the right to sight. Bull World Health Organ 2001; 79: 227–232.
- Mitry D, Bunce C, Wormald R et al. Causes of certifications for severe sight impairment (blind) and sight impairment (partial sight) in children in England and Wales. Br J Ophthalmol 2013; 97: 1431–1436. doi:10.1136/bjophthalmol-2013-303578.
- Shirley K, Chamney S, Satkurunathan P et al. Impact of healthcare strategies on patterns of paediatric sight impairment in a developed population: 1984–2011. Eye 2017; 31: 1537–1545. doi:10.1038/eye.2017.206.
- Steinkuller PG, Du L, Gilbert C et al. Childhood blindness. J AAPOS 1999; 3: 26–32. doi:10.1016/s1091-8531(99)70091-1.
- Inclusive education: unicef. [ accessed 2022 Nov 28]. https://www.unicef.org/education/inclusive-education.
- Nind M, Wearmouth J. Including children with special educational needs in mainstream classrooms: Implications for pedagogy from a systematic review. J Res Spec Educ Needs 2006; 6: 116–124. doi:10.1111/j.1471-3802.2006.00069.x.
- Brown JE, Beamish W. The changing role and practice of teachers of students with visual impairments: practitioners’ views from Australia. J Vis Impair Blind 2012; 106: 81–92. doi:10.1177/0145482x1210600203.
- Narayanasamy S, Vincent SJ, Sampson GP et al. Visual demands in modern Australian primary school classrooms. Clin Exp Optom 2016; 99: 233–240. doi:10.1111/cxo.12365.
- Douglas G, McLinden M, McCall S et al. Access to print literacy for children and young people with visual impairment: findings from a review of literature. Eur J Spec Needs Educ 2011; 26: 25–38. doi:10.1080/08856257.2011.543543.
- Butler SRM, Herbert W, Sheppard MJ et al. Seven-year longitudinal study of the early prediction of reading achievement. J Educ Psychol 1985; 77: c349–361. doi:10.1037/0022-0663.77.3.349.
- Loh L, Prem-Senthil M, Constable PA. Visual acuity and reading print size requirements in children with vision impairment. Clin Exp Optom 2023: 1–7. doi:10.1080/08164622.2023.2279190.
- Purpura DJ, Hume LE, Sims DM et al. Early literacy and early numeracy: the value of including early literacy skills in the prediction of numeracy development. J Exp Child Psychol 2011; 110: 647–658. doi:10.1016/j.jecp.2011.07.004.
- Schakel W, Bode C, Elsman EBM et al. The association between visual impairment and fatigue: a systematic review and meta-analysis of observational studies. Null Physiol Opt 2019; 39: 399–413. doi:10.1111/opo.12647.
- Thomas R, Barker L, Rubin G et al. Assistive technology for children and young people with low vision. Cochrane Database Syst Rev 2015; 6: CD011350. doi:10.1002/14651858.CD011350.pub2.
- Corn AL, Wall RS, Jose RT et al. An initial study of reading and comprehension rates for students who received optical devices. J Vis Impair Blind 2002; 96: 322–334. doi:10.1177/0145482X0209600504.
- Legge GE, Rubin GS, Pelli DG et al. Psychophysics of reading - II. Low vision. Vis Res 1985; 25: 253–265. doi:10.1016/0042-6989(85)90118-x.
- Elliott DB, Patla A, Bullimore MA. Improvements in clinical and functional vision and perceived visual disability after first and second eye cataract surgery. Br J Ophthalmol 1997; 81: 889–895. doi:10.1136/bjo.81.10.889.
- Legge GE, Ross JA, Isenberg LM et al. Psychophysics of reading. Clinical predictors of low-vision reading speed. Invest Ophthalmol Vis Sci 1992; 33: 677–687.
- Piepenbrock C, Mayr S, Buchner A. Smaller pupil size and better proofreading performance with positive than with negative polarity displays. Ergonomics 2014; 57: 1670–1677. doi:10.1080/00140139.2014.948496.
- Buchner A, Mayr S, Brandt M. The advantage of positive text-background polarity is due to high display luminance. Ergonomics 2009; 52: 882–886. doi:10.1080/00140130802641635.
- Do B, Lynch P, Macris EM et al. Systematic review and meta-analysis of the association of autism spectrum disorder in visually or hearing-impaired children. Ophthalmic Physiol Opt 2017; 37: 212–224. doi:10.1111/opo.12350.
- Bach M. The Freiburg visual acuity test - automatic measurement of visual acuity. Optom Vis Sci 1996; 73: 49–53. doi:10.1097/00006324-199601000-00008.
- Lieberman HR, Pentland AP. Microcomputer-based estimation of psychophysical thresholds: The best PEST. Behav Res Meth Instrum 1982; 14: 21–25. doi:10.3758/BF03202110.
- Robson AG, Frishman LJ, Grigg J et al. ISCEV Standard for full-field clinical electroretinography. Doc Ophthalmol 2022; 144: 165–177. doi:10.1007/s10633-022-09872-0.
- Davis CQ, Kraszewska O, Manning C. Constant luminance (cd·s/m2) versus constant retinal illuminance (Td·s) stimulation in flicker ERGs. Doc Ophthalmol 2017; 134: 75–87. doi:10.1007/s10633-017-9572-3.
- Legge GE, Ross JA, Luebker A et al. Psychophysics of reading - VIII. The Minnesota low vision reading test. Optom Vis Sci 1989; 66: 843–853. doi:10.1097/00006324-198912000-00008.
- Calabrèse A, To L, He Y et al. Comparing performance on the MNREAD iPad application with the MNREAD acuity chart. J Vis 2018; 18: 8. doi:10.1167/18.1.8.
- Calabrèse A, Cheong AM, Cheung SH et al. Baseline MNREAD measures for normally sighted subjects from childhood to old age. Invest Ophthalmol Vis Sci 2016; 57: 3836–3843. doi:10.1167/iovs.16-19580.
- Ayton LN, Abel LA, Fricke TR et al. Developmental eye movement test: what is it really measuring? Optom Vis Sci 2009; 86: 722–730. doi:10.1097/opx.0b013e3181a6a4b3.
- Ratnam K, Carroll J, Porco TC et al. Relationship between foveal cone structure and clinical measures of visual function in patients with inherited retinal degenerations. Invest Ophthalmol Vis Sci 2013; 54: 5836–5847. doi:10.1167/iovs.13-12557.
- Loh L, Gatsios A, Prem-Senthil M et al. Cone dystrophy, childhood vision impairment and education: are clinical measures of visual function adequate to support a child through education? Clin Exp Optom 2022; 105: 774–777. doi:10.1080/08164622.2021.1971044.
- Verbakel SK, van Huet RAC, Boon CJF et al. Non-syndromic retinitis pigmentosa. Prog Retin Eye Res 2018; 66: 157–186. doi:10.1016/j.preteyeres.2018.03.005.