
ABSTRACT
Interleukin-17A (IL-17A)-expressing T cells, including T helper 17 (Th17) and T helper 17.1 (Th17.1) cells, play a significant role in inflammatory bowel diseases (IBDs). Identifying the mechanisms underlying the heterogeneity and plasticity of IL-17A-expressing T cells is crucial for understanding and controlling their pathogenicity. The role of E74 like ETS transcription factor 3 (ELF3) in regulating the pathogenicity of IL-17A-expressing T cells has not been studied before. Dextran sulfate sodium was used to induce acute colitis in transgenic mice co-expressing IL-17A and enhanced green fluorescent protein (EGFP). IL-17A-expressing T cells were analyzed by flow cytometry. ELF3 expression was evaluated by reverse transcription and quantitative polymerase chain reaction. Lentivirus-mediated ELF3 overexpression was performed to assess the effect of ELF3 on Th17 and Th17.1 cells in vitro. The in vivo effect of ELF3 on Th17.1 cells was analyzed in an adoptive transfer colitis model. ELF3 was expressed by IL-17A-expressing T cells in the colonic lamina propria after colitis induction. Th17 cells and Th17.1 cells were distinguished based on the expression of C-X-C motif chemokine receptor 3, cytokine production, and key regulators. Th17 cells expressed higher ELF3 than Th17.1 cells. Ectopic ELF3 overexpression did not alter Th17 cell function while suppressing Th17.1 cell function in vitro. When adoptively transferred into Rag1 knockout mice to induce colitis, ELF3-overexpressing Th17.1 cells were less pathogenic than the control Th17.1 cells. ELF3 suppresses the pathogenicity of Th17.1 cells in colitis.
Introduction
Inflammatory bowel diseases (IBDs) are caused by continuous inflammatory reactions in the gastrointestinal tract (Saravanarajan et al. Citation2020). T cells, especially CD4+ T helper cells, contribute to the onset, progression, remission, and recurrence of IBDs, owing to their production of inflammatory cytokines and autoimmune mediators (Giuffrida and Di Sabatino Citation2020). Upon receiving instructions from antigen-presenting cells, naïve CD4+ T cells differentiate into distinct effector cells, such as T helper 1 (Th1), T helper 2 (Th2), T helper 9 (Th9), T helper 17 cells (Th17), and induced regulatory T cells (iTregs). In particular, Th17 cells are significant players in the pathogenesis of inflammatory disorders including IBDs, because they produce abundant pro-inflammatory cytokines such as IL-17A, IL-21, and IL-22 (Bakheet et al. Citation2019; Hou and Bishu Citation2020; Nadeem et al. Citation2019a, Citation2019b). Traditional Th17 cells are defined as IL-17A-expressing CD4+ T cells. However, IL-17A-expressing CD4+ T cells comprise subsets with distinct phenotypes and functions (Guo and Bai Citation2019; Soukou et al. Citation2021). Th17.1 cells (Also termed Th1-like Th17 or Th17/Th1 cells), with the characteristics of both Th17 cells and Th1 cells, play important roles in inflammatory disorders including IBDs (Arger et al. Citation2020; Harbour et al. Citation2015; Kamali et al. Citation2019; Maeda et al. Citation2019). Compared with Th17 cells, Th17.1 cells express lower IL-17A but higher CXCR3 and IFN-γ (Annunziato et al. Citation2009; van Hamburg et al. Citation2018). Th17.1 cells are pathogenic in intestinal inflammation (Harbour et al. Citation2015). However, the mechanisms regulating the pathogenicity of Th17.1 cells are not completely understood. It is important to identify transcription factors and signaling pathways key to the generation and activity of Th17.1 cells in IBDs.
E74 like ETS transcription factor 3 (ELF3), also known as ESE-1, is an epithelial cell-specific transcription activator highly expressed in the gastrointestinal tract, salivary gland, bladder, liver, and prostate (Luk et al. Citation2018). It binds to the consensus nucleotide sequence GGA[AT] of several gene promoters. It is also expressed in colorectal, gastric, breast, liver, and non-small cell lung cancer and acts as a tumor promoter (Luk et al. Citation2018). No studies have reported ELF3 function in T cells because it is not constitutively expressed by T cells. However, under pathological conditions, T cells might express several transcription factors that are not expressed under normal conditions. Therefore, ELF3 might be expressed by pathogenic T cells in IBDs.
This study discovered ELF3 expression in IL-17A-expressing CD4+ T cells in the lamina propria (LP) of colitic mice. Interestingly, we identified Th17 cells and Th17.1 cells in these IL-17A-expressing CD4+ T cells. We also found that Th17 cells expressed higher ELF3 than Th17.1 cells. Further experiments showed that EFL3 inhibited the pathogenicity of Th17.1 cells in murine colitis. Therefore, we unveiled a novel mechanism by which Th17.1 cells are modulated in colitis.
Materials and methods
Animals
This study was approved by the Wuhan Fourth Hospital Animal Care and Use Committee and conducted according to the Wuhan Fourth Hospital Animal Use Guidelines. IL-17A-EGFP transgenic mice (C57BL/6-Il17attm1/Bcgen, male, 8-week) were obtained from Beijing Biocytogen Co., Ltd. These mice have an IRES-EGFP-encoding sequence after the stop codon of the Il17a alleles so IL-17A and EGFP are co-expressed. Wild-type C57BL/6J mice were purchased from the same supplier. Male Rag1 knockout mice (B6;129S-Rag1tm1(loxP-EGFP−PolyA−loxP−Neo−loxP)Smoc, 8-week) were purchased from Shanghai Model Organisms.
Murine dextran sulfate sodium (DSS) colitis model
Dextran sodium sulfate (DSS) powder (Sigma-Aldrich) was dissolved in autoclaved water at the final concentration of 3%. Twenty-eight B-IL17-EGFP transgenic mice were given orally the 3% DSS solution for 7 days. The DSS solution was replenished every 3 days.
Cell isolation from spleens, mesenteric lymph nodes, and lamina propria
Mice were sacrificed by CO2 inhalation. Mouse spleens were taken, immersed in 2 ml of PBS, and pressed through a 70-µm cell strainer to make single-cell suspensions. Mesenteric lymph nodes (mLNs) were harvested and processed the same way. Each mouse’s colon was minced into small pieces, followed by digestion in RPMI 1640 medium supplemented with 3 mg/ml Collagenase VIII, 4 mM ethylenediaminetetraacetic acid (EDTA), 200 U/ml DNase I, 2.5 mM 4-(2-hydroxyethyl)-1-piperazineethanesulfonic acid (HEPES), 1 mM dithiothreitol, and 10% fetal calf serum (FCS) for 40 minutes at 37°C The digested colon tissue was pressed through a 70-µm cell strainer to make a single-cell suspension. The single-cell suspensions were centrifuged at 300 ×g for 5 minutes. The supernatants were discarded and erythrocytes were removed by suspending cells in red blood cell lysis buffer for 5 minutes at room temperature. All reagents were purchased from Sigma-Aldrich.
Flow cytometry
Flow cytometry antibodies were listed in . For cell surface staining, cells were incubated with 5 µg/ml of each fluorophore-conjugated antibody for 20 minutes at 4°C For intracellular staining, cells were fixed with 3% paraformaldehyde for 15 minutes at room temperature, followed by permeabilization in 90% methanol-PBS on ice for half an hour. After that, cells were incubated with 5 µg/ml of each fluorophore-conjugated antibody for 1 hour at room temperature. Cell apoptosis was quantified by incubating cells with PE Annexin V (BioLegend) and 5 µg/ml propidium iodide (BioLegend) following the supplier’s protocol. Samples were analyzed on an LSRII flow cytometery (BD biosciences). Cell sorting was achieved on a FACSAria Flow Cytometery (BD biosciences).
Table 1. Antibodies for flow cytometry
RNA purification, reverse transcription, and quantitative polymerase chain reaction (q-PCR)
An RNAprep pure micro kit (Tiangen Biotech) was used to purify RNAs from a small number of cells following the supplier’s instructions. RNAs were then reversely transcribed into cDNAs using a SuperScript™ VILO™ cDNA synthesis kit (Invitrogen) following the manufacturer’s protocol. Quantitative PCR was performed using an SYBR™ green PCR master mix (Molecular probes) on a LightCycler 480 real-time PCR system (Roche). Relative mRNA levels of target genes were normalized to β-actin and quantified using the 2−ΔΔCt method. ΔΔCT = normalized ΔCT(target sample) − normalized ΔCT(control sample). The final result is presented as the fold change (2−ΔΔCt) of target gene expression in a target sample relative to a control sample, after normalization to β-actin. The primer sequences are demonstrated in .
Table 2. Primer sequences
Immunoblotting
Proteins were isolated by incubating cells in RIPA buffer supplemented with protease inhibitors (Abcam) for 30 minutes on ice. Polyclonal goat anti-human/mouse ELF3 antibody was purchased from R&D Systems (Final concentration = 1 µg/ml, catalog # AF5787). Monoclonal mouse anti-β-Actin IgG1 was purchased from Abcam (Final dilution = 1:1000, catalog # ab8226). Horseradish peroxidase-conjugated rabbit anti-goat IgG (Final dilution = 1:5000, catalog # ab6741) and horseradish peroxidase-conjugated goat anti-mouse IgG (Final dilution = 1:2000, catalog # ab97023) were purchased from Abcam.
Fluorescent staining
Sorted T cells were seeded onto poly-L-lysine-coated coverslips and air-dried. Cells were fixed in ice-cold acetone for 30 minutes. Cells were washed with PBS and blocked with goat serum for 30 minutes at room temperature. Cells were then incubated with 5 µg/ml goat anti-ELF3 antibody (The same one for Immunoblotting) overnight at 4°C Cells were washed with PBS and incubated with 2 µg/ml PE-conjugated donkey anti-goat IgG (Abcam, catalog # ab7004) for 1 hour at room temperature. Cells were then rinsed with PBS and covered with a mounting medium with DAPI (Abcam). Images were taken using a B×50 fluorescence microscope (Olympus).
Lentivirus preparation
Mouse ELF3 lentivector (Catalog # 1920506) and its control vector (Catalog # LV590) were purchased from Applied Biological Materials Inc. Lentiviral packaging, purification, and titration were achieved by Cloud-Clone Co., Ltd (Wuhan, China).
In vitro T cell polarization and lentiviral infection
Mouse splenic CD4+ T cells were isolated from wild-type C57BL/6J mice using an ImmunoSep mouse CD4 T cell enrichment kit (Precision Biomedicals Co., Ltd.) following the manufacturer’s manual. For Th17 polarization, 1 × 10⁵ splenic CD4+ T cells were suspended in 100 µl of supplemented RPIMI-1640 medium and seeded into each well of a 96-well culture plate, in the presence of 5 µg/ml plate-bound anti-CD3ε antibody (Clone # 145-2C11), 2 µg/ml soluble anti-CD28 mAb (Clone # 37.51), 20 ng/ml IL-6 (Catalog # 575704), 1 ng/ml TGF-β1 (Catalog # 781802), 20 ng/ml IL-23 (Catalog # 589002), 10 µg/ml anti-mouse IL-4 antibody (Catalog # 504122), and 10 µg/ml anti-mouse IFN-γ antibody (Catalog # 505834). On day 2, lentiviral particles were added into the culture at the multiplicity of infection (MOI) of 10. Cells were incubated for 16 hours in the presence of 5 µg/ml polybrene (Sigma-Aldrich). The supernatant was then replaced with 100 µl of fresh media containing the same cytokines and antibodies. On day 6, cells were loaded on the flow cytometery to determine the infection efficiency. The reagents were purchased from BioLegend.
In vitro Th17.1 polarization was conducted based on previous research with modifications (Harbour et al. Citation2015; Lexberg et al. Citation2010). Briefly, splenic CD4+ T cells were treated the same way as described above, except that the anti-mouse IFN-γ antibody was replaced with 10 ng/ml IL-12 (Catalog # 419-ML-010/CF, R&D Systems) and 10 ng/ml IFN-γ (Catalog # 485-MI-100/CF, R&D Systems). The lentiviral infection procedures were the same way as above.
For cytokine detection in Th17 and Th17.1 cells, four hours before the end of culture, cells were treated with 20 ng/ml phorbol 12-myristate 13-acetate (PMA, Sigma-Aldrich) plus 1 μg/ml ionomycin (Sigma-Aldrich) and 10 μg/ml brefeldin A (Sigma-Aldrich). Cells were then subjected to intracellular cytokine staining and flow cytometry assays.
Adoptive transfer colitis model
Ninety Rag1−/− mice were randomized into three groups (30 animals per group) so that each group had a similar average weight. Group 1: Rag1−/− mice transferred with PBS. Group 2: Rag1−/− mice transferred with control Th17.1 cells. Group 3: Rag1−/− mice transferred with ELF3-overexpressing Th17.1 cells. For randomization, thirty ones, thirty twos, and thirty threes were written on 90 pieces of paper. The 90 pieces of paper were folded and placed in a receptacle which was shaken. A piece of paper was withdrawn, and the first animal was assigned to the indicated treatment and so on. CD4+ T cells were cultured under the Th17.1 polarizing condition and infected with lentiviruses as described above. A total of 1 × 10⁶ Th17.1 cells were intraperitoneally infused into age-matched Rag1−/− recipients. Mice were weighed weekly. Four weeks after transfer, mice were sacrificed and their colons were harvested for further assays.
Hematoxylin and eosin staining
Mouse colons were fixed with formalin and embedded in paraffin and five-micron thick sections were prepared. The sections were stained with hematoxylin and eosin following the standard protocol. The severity of tissue damage was graded on a four-point scale: 0 indicates no signs of inflammation; 1 indicates minimal inflammation; 2 indicates low/moderate leukocyte infiltrates; 3 indicates notable leukocyte infiltrates, increases in vasculatures, and thickening of colon walls; 4 indicates remarkable goblet loss, thickening of colon walls, and transmural infiltrates.
ELISA
Mouse colons were manually homogenized in PBS containing 10 mM EDTA, 0.1 mM phenylmethylsulfonyl fluoride, 0.1 mM benzethonium chloride, 0.05% Tween-20, and 20 U aprotinin A (50 μl per 1 mg of tissue). All reagents were purchased from Sigma-Aldrich. The homogenates were centrifuged at 13,000 ×g for 5 minutes at 4°C and the supernatants were harvested. Cytokines were quantified using a LEGEND MAX™ mouse IL-17A/F ELISA kit (BioLegend), LEGEND MAX™ mouse IFN-γ ELISA kit (BioLegend), and LEGEND MAX™ mouse TNF-α ELISA kit (BioLegend), respectively.
Statistics
Data were presented as means ± standard deviations. Each experiment was independently repeated 2 or 3 times. Unpaired two-tailed Student’s t-test or one-way ANOVA with Tukey’s test was applied for statistical analysis. A P value less than 0.05 is regarded as significant. The minimum mouse number necessary for attaining a statistical significance of P < 0.05 with an 80% probability was determined by the Sample Size & Power Calculator, which is a sample size tool provided by the Chinese University of Hong Kong (http://www.lasec.cuhk.edu.hk/sample-size-calculation.html), according to means and standard deviations in pilot experiments.
Results
IL-17A-expressing CD4+T cells express ELF3 in colitic LP
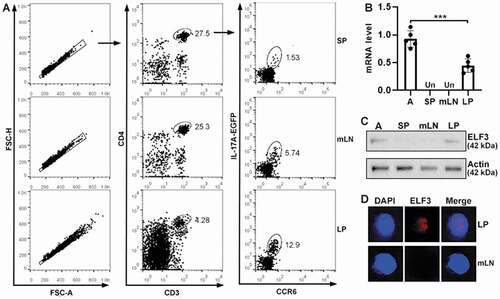
Acute colitis was induced in IL-17A-EGFP transgenic mice (Figure S1). To evaluate ELF3 expression in IL-17A-expressing CD4+ T cells, we isolated immune cells from mouse spleens, mLNs, and lamina propria (LP). As displayed in , single cells were gated according to forward scatter A and forward scatter H. CD3+CD4+ T cells were recognized among single cells. IL-17A+CCR6+ T cells were then distinguished in CD3+CD4+ T cells in spleens, mLNs, and LP. These IL-17A+CCR6+ T cells were sorted and ELF3 mRNA levels were quantified by q-RTPCR. A549 cell line was used as a positive control of ELF3. As indicated in , ELF3 mRNA was not detected in splenic IL-17A+CCR6+ T cells or mLN IL-17A+CCR6+ T cells. However, ELF3 mRNA was found in LP IL-17A+CCR6+ T cells and its level was half of that in A549 cells (P < 0.001, Table S1). Immunoblotting confirmed ELF3 expression in LP IL-17A+CCR6+ T cells (). ELF3 was primarily expressed in the nuclei of LP IL-17A+CCR6+ T cells (). Non-IL-17A-expressing CD4+ T cells did not express ELF3 (Figure S2).
Figure 1. ELF3 expression in IL-17A-expressing CD4+T cells. (a) Flow cytometry gating strategy for IL-17A-expressing CD4+ T cells in DSS-induced colitis model. SP: spleen. mLN: mesenteric lymph nodes. LP: lamina propria. (b) ELF3 mRNA levels in IL-17A-expressing CD4+ T cells sorted from spleens, mesenteric lymph nodes, and lamina propria of DSS-treated mice. A: A549 cell line. Un: under detection limit. N = 5 mice per group. ***: P <0.001 compared with A549 cell line. Student’s t-test. (c) Immunoblotting image showing ELF3 protein in sorted IL-17A-expressing CD4+ T cells. Note that the “SP” group represents splenic CD4+ T cells due to the low number of splenic IL-17A-expressing CD4+ T cells. The images represent 2 independent experiments. (d) Fluorescent staining of ELF3 in sorted LP or mLN IL-17A-expressing CD4+ T cells.
Th17 cells express higher ELF3 than Th17.1 cells
Although Th17 cells were traditionally defined as CD4+IL-17A+CCR6+ T cells, Th17.1 cells also express IL-17A and CCR6 (Hou and Yuki Citation2022; van Langelaar et al., Citation2018). However, Th17.1 cells express CXCR3 while Th17 cells do not (Annunziato et al. Citation2009; van Hamburg et al. Citation2018). Therefore, to find Th17 cells and Th17.1 cells, CD4+IL-17A+CCR6+ T cells were divided into two subsets: CXCR3- cells (Subset I) and CXCR3+ cells (Subset II) (). The frequency of LP subset II was significantly higher than the frequency of mLN subset II (P < 0.001) (). q-RTPCR showed equivalent RORγt mRNAs in subset I and subset II (). In either mLNs or LP, compared with subset I, subset II expressed more T-bet (P < 0.001), IFN-γ (P < 0.001), TNF-α (P < 0.05in mLNs and P < 0.01 in LP) but less IL-17A (P < 0.001) (). Therefore, we concluded that subset II (i.e. CD4+IL-17A+CCR6+CXCR3+) was Th17.1 cells while subset I (i.e. CD4+IL-17A+CCR6+CXCR3-) was Th17 cells. IL-17A-EGFP intensity was also lower in LP Th17.1 cells compared with LP Th17 cells (P < .001) (). Furthermore, LP Th17.1 cells expressed higher IFN-γ than LP Th17 cells after in vitro stimulation with PMA/ionomycin (P < 0.001) (). Interestingly, LP Th17 cells expressed more ELF3 mRNA than LP Th17.1 cells (P < 0.001) (). The fold changes of corresponding mRNA levels were listed in Tables S2–S6.
Figure 2. ELF3 expression in Th17 cells and Th17.1 cells. (a) Flow cytometry dot plots showing CXCR3 expression on the surface of CD4+IL-17a+ccr6+ T cells in mLns and LP. (b) Frequencies of subset I (CXCR3-) and subset II (Cxcr3+) in CD4+IL-17a+ccr6+ T cells. (c to g) mRNA levels of indicated molecules in subset I and subset II. (h) IL-17A-EGFP intensities of LP subset I and subset II. Left panel: flow cytometry histograms. Right panel: statistics. (i) IFN-γ expression in LP subset I and subset II after stimulation with PMA/ionomycin. Left panel: flow cytometry contour plots. Right panel: statistics. (j) mRNA levels of ELF3 in LP subset I and subset II. N = 5 mice per group. *: P <.05; **: P <.01; ***: P <.001. One-way ANOVA for B to G. Student’s t-test for H to J.
ELF3 overexpression does not affect Th17 cell generation in vitro
To evaluate the function of ELF3, we cultured wild-type mouse splenic CD4+ T cells under Th17 polarization condition and infected them with ELF3-and-GFP-encoding lentivirus (Figure S3). According to GFP expression, the viral infection efficiency reached approximately 80% (). Th17 polarization did not induce ELF3 expression (Figure S4). Exogenous ELF3 expression in lentivirus-infected T cells was confirmed by Immunoblotting (). Equivalent Annexin V+ cells were observed in ELF3-overexpressing Th17 cells and control Th17 cells (P > .05), suggesting that ELF3 overexpression did not affect Th17 cell apoptosis (). Equivalent Ki67+ cells were found in ELF3-overexpressing Th17 cells and control Th17 cells (P > .05), suggesting that ELF3 overexpression did not affect Th17 cell proliferation (). Furthermore, ELF3 overexpression did not change IL-17A or IFN-γ expression in Th17 cells (P > .05) (). Therefore, ELF3 had no significant impact on Th17 polarization and function.
Figure 3. Effect of ELF3 overexpression on Th17 cell generation in vitro. (a) GFP expression in wild-type splenic CD4+ T cells after in vitro Th17 polarization and lentiviral infection. Blank: infection medium only. LC: infection with control lentivirus without ELF3-encoding sequence. LE: infection with ELF3-encoding lentivirus. The images represent 2 independent experiments. (b) ELF3 protein in splenic CD4+ T cells after in vitro Th17 polarization and lentiviral infection. The images represent 2 independent experiments. (c) Splenic CD4+ T cell apoptosis after Th17 polarization and lentiviral infection. Left panel: representative flow cytometry dot plots. Right panel: statistics of Annexin V+ apoptotic cells. (d) Ki67 staining in splenic CD4+ T cells after Th17 polarization and lentiviral infection. Left panel: representative flow cytometry histograms. Right panel: statistics of Ki67+ cells. (e and f) Expression of IL-17A (e) and IFN-γ (f) in splenic CD4+ T cells after Th17 polarization and lentiviral infection. Left panels: representative flow cytometry dot plots. Right panel: statistics of IL-17a+ and IFN-γ+ cells. N = 3 (T cells from 3 mice) per group. Student’s t-test.
ELF3 overexpression suppresses Th17.1 cell generation in vitro
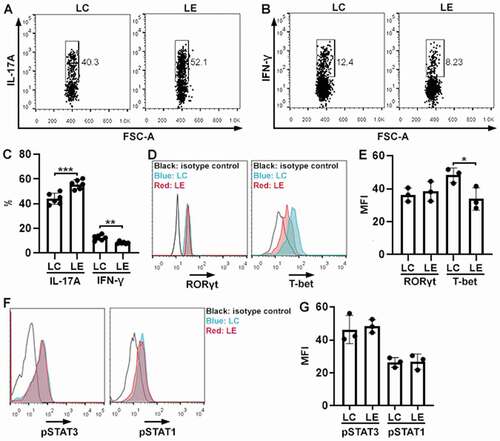
To study the effect of ELF3 on Th17.1 cells, we cultured wild-type mouse splenic CD4+ T cells under Th17.1 polarization condition and infected them with lentiviruses. Th17.1 polarization did not induce ELF3 expression (Figure S4). As shown in , compared with Th17.1 cells infected with the control virus, ELF3-overexpressing Th17.1 cells expressed higher IL-17A (P < .001) but lower IFN-γ (P < .01). Comparable RORγt expression was observed in control Th17.1 cells and ELF3-overexpressing Th17.1 cells (P > 0.05) (). However, ELF3-overexpressing Th17.1 cells expressed lower T-bet compared with control Th17.1 cells (P < .05) (). We also quantified the activating phosphorylation of STAT3 (key signaling to Th17) and STAT1 (key signaling to Th1) in Th17.1 cells. As indicated in , control Th17.1 cells and ELF3-overexpressing Th17.1 cells had comparable amounts of phosphorylated STAT3 and phosphorylated STAT1, respectively (P > .05). Therefore, ELF3 suppresses Th17.1 differentiation probably by inhibiting T-bet expression.
Figure 4. Effect of ELF3 overexpression on Th17.1 cell generation in vitro. (a and b) Flow cytometry dot plots showing the expression of IL-17A (a) and IFN-γ (b) in splenic CD4+ T cells after Th17.1 polarization and lentiviral infection. LC: infection with control lentivirus without ELF3-encoding sequence. LE: infection with ELF3-encoding lentivirus. (c) Frequencies of IL-17a+ and IFN-γ+ cells after Th17.1 polarization and lentiviral infection. N = 6 (T cells from 6 mice) per group. (d) Flow cytometry histograms showing the expression of RORγt and T-bet in splenic CD4+ T cells after Th17.1 polarization and lentiviral infection. (e) Mean fluorescence intensities of RORγt and T-bet in splenic CD4+ T cells. N = 3 (T cells from 3 mice) per group. (f) Flow cytometry histograms showing the phosphorylation of STAT3 and STAT1 in splenic CD4+ T cells after Th17.1 polarization and lentiviral infection. (g) Mean fluorescence intensities of phosphorylated STAT3 and STAT1. N = 3 (T cells from 3 mice) per group. *: P <.05; **: P <.01; ***: P <.001. Student’s t-test.
ELF3 overexpression represses Th17.1 cell function in vivo
To study the effect of ELF3 in vivo, control Th17.1 cells and ELF3-overexpressing Th17.1 cells were generated in vitro and adoptively transferred into Rag1−/− mice. Four weeks later, GFP+ cells, i.e. transferred Th17.1 cells, were sorted from the recipients’ LP (). We assessed ELF3 expression in these exogenous Th17.1 cells. As shown in , ELF3-overexpressing Th17.1 cells expressed significantly higher ELF3 mRNA than control Th17.1 cells in vivo (P < 0.001). Control Th17.1 cells did not express ELF3 in vivo, suggesting that chronic intestinal inflammation could not trigger ELF3 expression in Th17.1 cells. We then evaluated the proliferation of exogenous Th17.1 cells and found fewer Ki67+ cells in ELF3-overexpressing Th17.1 cells relative to control Th17.1 cells, suggesting that ELF3-overexpressing Th17.1 cells were less proliferative (P < .01) (). Compared with control Th17.1 cells, ELF3-overexpressing Th17.1 cells expressed higher IL-17A (P < 0.001) and lower IFN-γ (P < .001) (). Furthermore, compared with control Th17.1 cells, ELF3-overexpressing Th17.1 cells expressed more IL-22 (P < .01) and less TNF-α (P < .01) ( and Table S7).
Figure 5. Effect of ELF3 overexpression on Th17.1 cell function in vivo. (a) Flow cytometry dot plots showing exogenous GFP+ T cells in the LP of Rag1−/− mice four weeks after transfer. LC: control Th17.1 cells without ELF3 expression. LE: ELF3-overexpressing Th17.1 cells. (b) ELF3 mRNA levels in cultured Th17.1 cells (in vitro) or Th17.1 cells sorted from the recipients’ LP (in vivo). Un: under detection limit. (c) Flow cytometry histograms showing Ki67 staining in exogenous LP Th17.1 cells. (d) Statistics of Ki67+ cells in (c). (e and f) Flow cytometry dot plots showing the expression of IL-17A (e) and IFN-γ (f) in exogenous Th17.1 cells after sorting from LP and stimulation with PMA/ionomycin. (g) Statistics of the frequencies of IL-17a+ and IFN-γ+ cells in exogenous Th17.1 cells. (h) mRNA levels of IL-22 and TNF-α in exogenous Th17.1 cells. N = 3–6 mice per group. **: P <.01; ***: P <.001. Student’s t-test.
ELF3 overexpression mitigates Th17.1-mediated colitis
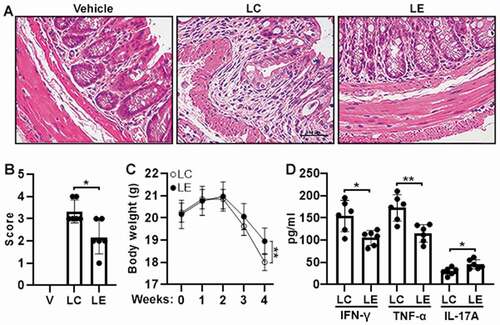
We also analyzed colon tissue damage after Th17.1 cell transfer. H&E staining showed significant goblet cell distortion, thickening of mucosal layers, and a high tissue damage score in mice transferred with control Th17.1 cells. However, in mice transferred with ELF3-overexpressing Th17.1 cells, colon tissue damage was relatively mild (P < .05) (). Transfer of control Th17.1 cells caused a significant body weight loss, whereas transfer of ELF3-overexpressing Th17.1 cells caused a relatively moderate body weight loss 4 weeks after transfer (P < .01 at week 4) (). Besides, compared with mice transferred with control Th17.1 cells, mice transferred with ELF3-overexpressing Th17.1 cells had lower IFN-γ (P < .05) and TNF-α (P < .01) but higher IL-17A (P < .05) in their colons ().
Figure 6. Severity of adoptive transfer-induced colitis. (a) H&E staining of colons four weeks after adoptive transfer of Th17.1 cells. Vehicle: Rag1−/− mice transferred with PBS. LC: Rag1−/− mice transferred with control Th17.1 cells. LE: Rag1−/− mice transferred with ELF3-overexpressing Th17.1 cells. (b) Histological scores. (c) Mouse body weight. (d) Concentrations of indicated cytokines in colon tissues. N = 6–8 mice per group. *: P <.05; **: P <.01. Student’s t-test.
Discussion
IL-17A-expressing T cells play significant roles in the pathogenesis of multiple disorders (Ahmad et al. Citation2018; Al-Harbi et al. Citation2016; Nadeem et al. Citation2020). Our study revealed the effect of ELF3 on IL-17A-expressing T cells in mouse colitis. Interestingly, ELF3 was expressed in LP IL-17A-producing T cells only, implying that ELF3 was induced by the inflammatory LP microenvironment rather than immune factors in the spleen and mLNs. Although LP IL-17A-expressing T cells did not express as much ELF3 as A549 cells, the ELF3 up-regulation was still considerable compared with IL-17A-expressing CD4+ T cells in the spleen and mLNs. When dividing IL-17A-expressing T cells into CXCR3- Th17 cells and CXCR3+ Th17.1 cells, we found that LP Th17.1 cells expressed lower ELF3 than LP Th17 cells. The cause of the ELF3 up-regulation in LP IL-17A-expressing CD4+ T cells remains unidentified. Early research reported that lipopolysaccharide (LPS) induced ELF3 expression in monocytes (Grall et al. Citation2005). LP Th17 cells express Toll-like receptor 4 (Davila and Kolls Citation2010; Park et al. Citation2015; Reynolds et al. Citation2012) and might be exposed to LPS derived from colonic gram-negative bacteria when colon mucosa is compromised. Therefore, LPS could trigger ELF3 expression in Th17 cells. Besides, other pro-inflammatory mediators might increase ELF3 expression in Th17 cells. We will test whether LPS or pro-inflammatory cytokines such as TNF-α and IL-18 would up-regulate ELF3 in Th17 cells and Th17.1 cells.
Consistent with previous reports (Bailey et al. Citation2014; van Hamburg et al. Citation2018) LP Th17.1 cells expressed lower IL-17A but higher IFN-γ and TNF-α than LP Th17 cells, indicating CXCR3 as a reliable Th17.1 cell marker. However, it is unclear whether LP Th17.1 cells originated from LP Th17 cells or other CD4+ T helper subsets. Lineage tracing analysis would tell the origin of LP Th17.1 cells in the future. We assume that LP Th17 cells are the primary source of LP Th17.1 cells because the two subsets are phenotypically and functionally related.
Interestingly, in vitro Th17 or Th17.1 polarization could not induce ELF3 expression, implying that signaling pathways activated by CD3, CD28, TGF-β, IL-6, IFN-γ, and IL-12 were not related to ELF3 expression. Therefore, other stimuli are responsible for ELF3 up-regulation. Using lentivirus-mediated ELF3 overexpression, we found that ELF3 did not affect Th17 cell polarization, proliferation, and cytokine expression, suggesting that ELF3 could not influence the pathogenicity of Th17 cells. However, ELF3 overexpression suppressed Th17.1 cell generation. Since LP Th17.1 cells express lower ELF3 than LP Th17 cells, ELF3 might act as a Th17.1 suppressor, and Th17.1 cells down-regulate ELF3 to sustain their function.
Furthermore, T-bet was down-regulated in ELF3-overexpressing Th17.1 cells, suggesting that ELF3 repressed T-bet expression. Although ELF3 is a transcriptional activator in most cases, it may repress promoter activity in esophageal and cervical epithelial cancer cell lines (Brembeck et al. Citation2000). Therefore, ELF3 might inhibit T-bet transcription in Th17.1 cells. However, ELF3 must bind to the consensus sequence GGA[AT] to exert its effect (Andreoli et al. Citation1997; Cooper et al. Citation2014; Hollenhorst et al. Citation2011). Whether this consensus sequence exists in the TBX21 gene promoter remains unknown. Our ongoing study is trying chromatin immunoprecipitation (ChIP) or electrophoresis mobility shift assay (EMSA) to determine if ELF3 binds to the promoter of the RORC or TBX21 gene.
The in vivo study results also strongly suggest ELF3 as a negative regulator of LP Th17.1 cells. Unlike LP Th17.1 cells in the DSS-induced colitis model, control Th17.1 cells did not express ELF3 in recipients’ LP in the adoptive transfer colitis model. This could be explained by two reasons: 1) Compared with DSS-driven acute colitis, adoptive transfer-induced colitis is chronic inflammation with slow mucosa damage and low inflammatory factors. ELF3 might not be induced when intestinal inflammation is not severe enough. 2) The recipients were Rag1−/− mice devoid of mature T cells and B cells. If ELF3 expression needs T cell- or B cell-derived factors/signals, Rag1−/− mice are unable to induce EFL3 expression in exogenous Th17.1 cells. Further research is necessary to identify the factor(s) key to ELF3 induction in LP Th17 and Th17.1 cells.
Despite these findings, this study has several limitations. First, the dynamic change of ELF3 remains unknown. ELF3 expression should be thoroughly evaluated during the onset, progression, and remission of colitis to find the potential link between ELF3 expression and colitis severity. Second, DSS triggers acute colitis. Whether ELF3 shows the same expression pattern and function in chronic colitis is unknown. Third, the phenotypes of Th17 and Th17.1 cells remain unclear. Although CXCR3 is a Th17.1 cell marker, CXCR3+IL-17A-expressing T cells might contain distinct subsets. Fourth, the mechanisms of ELF3’s effect have not been revealed. Whether ELF3 directly suppresses T-bet transcription or influences Th17.1-related signaling pathways remains a mystery. Therefore, further investigations are necessary to elucidate the role of ELF3 in modulating Th17.1 cell activity.
In summary, for the first time, this research showed that ELF3 suppresses the pathogenicity of Th17.1 cells in acute colitis. We discovered a new mechanism by which Th17.1 cell function is modulated. Whether ELF3 has the same effect on Th17.1 cells in other inflammatory or autoimmune disorders deserves further studies.
Supplemental Material
Download PDF (290 KB)Disclosure statement
The authors declare no financial or commercial conflict of interest.
Data availability statement
The data are available from the correspondence author upon reasonable request.
Supplementary material
Supplemental data for this article can be accessed online at https://doi.org/10.1080/08820139.2022.2084409.
Additional information
Funding
References
- Ahmad SF, Nadeem A, Ansari MA, Bakheet SA, Alshammari MA, Attia SM. 2018. The PPARdelta agonist GW0742 restores neuroimmune function by regulating Tim-3 and Th17/Treg-related signaling in the BTBR autistic mouse model. Neurochem Int. 120:251–61.
- Al-Harbi NO, Nadeem A, Al-Harbi MM, Ansari MA, AlSharari SD, Bahashwan SA, Attia SM, Al-Hosaini KA, Al Hoshani AR, Ahmad SF, et al. 2016. Airway oxidative stress causes vascular and hepatic inflammation via upregulation of IL-17A in a murine model of allergic asthma. Int Immunopharmacol. 34:173–82.
- Andreoli JM, Jang SI, Chung E, Coticchia CM, Steinert PM, Markova NG. 1997. The expression of a novel, epithelium-specific ets transcription factor is restricted to the most differentiated layers in the epidermis. Nucleic Acids Res. 25(21):4287–95.
- Annunziato F, Cosmi L, Liotta F, Maggi E, Romagnani S. 2009. Human Th17 cells: are they different from murine Th17 cells? Eur J Immunol. 39(3):637–40.
- Arger NK, Machiraju S, Allen IE, Woodruff PG, Koth LL. 2020. T-Bet expression in peripheral Th17.0 cells is associated with pulmonary function changes in sarcoidosis. Front Immunol. 11:1129.
- Bailey SR, Nelson MH, Himes RA, Li Z, Mehrotra S, Paulos CM. 2014. Th17 cells in cancer: the ultimate identity crisis. Front Immunol. 5:276.
- Bakheet SA, Ansari MA, Nadeem A, Attia SM, Alhoshani AR, Gul G, Al-Qahtani QH, Albekairi NA, Ibrahim KE, Ahmad SF, et al. 2019. CXCR3 antagonist AMG487 suppresses rheumatoid arthritis pathogenesis and progression by shifting the Th17/Treg cell balance. Cell Signal. 64:109395.
- Brembeck FH, Opitz OG, Libermann TA, Rustgi AK. 2000. Dual function of the epithelial specific ets transcription factor, ELF3, in modulating differentiation. Oncogene. 19(15):1941–49.
- Cooper CD, Newman JA, Gileadi O. 2014. Recent advances in the structural molecular biology of Ets transcription factors: interactions, interfaces and inhibition. Biochem Soc Trans. 42(1):130–38.
- Davila E, Kolls J. 2010. A “Toll” for Th17 cell expansion. J Leukoc Biol. 88(1):5–7.
- Giuffrida P, Di Sabatino A. 2020. Targeting T cells in inflammatory bowel disease. Pharmacol Res. 159:105040.
- Grall FT, Prall WC, Wei W, Gu X, Cho JY, Choy BK, Zerbini LF, Inan MS, Goldring SR, Gravallese EM, et al. 2005. The Ets transcription factor ESE-1 mediates induction of the COX-2 gene by LPS in monocytes. Febs J. 272(7):1676–87.
- Guo Y, Bai AP. 2019. Plasticity of Th17 cells contributes to crohn’s disease. Gastroenterology. 157(6):1689.
- Harbour SN, Maynard CL, Zindl CL, Schoeb TR, Weaver CT. 2015. Th17 cells give rise to Th1 cells that are required for the pathogenesis of colitis. Proc Natl Acad Sci USA. 112(22):7061–66.
- Hollenhorst PC, McIntosh LP, Graves BJ. 2011. Genomic and biochemical insights into the specificity of ETS transcription factors. Annu Rev Biochem. 80(1):437–71.
- Hou G, Bishu S. 2020. Th17 Cells in inflammatory bowel disease: an update for the clinician. Inflamm Bowel Dis. 26(5):653–61.
- Hou L, Yuki K. 2022. CCR6 and CXCR6 identify the Th17 cells with cytotoxicity in experimental autoimmune encephalomyelitis. Front Immunol. 13:819224.
- Kamali AN, Noorbakhsh SM, Hamedifar H, Jadidi-Niaragh F, Yazdani R, Bautista JM, Azizi G. 2019. A role for Th1-like Th17 cells in the pathogenesis of inflammatory and autoimmune disorders. Mol Immunol. 105:107–15.
- Lexberg MH, Taubner A, Albrecht I, Lepenies I, Richter A, Kamradt T, Radbruch A, Chang H-D. 2010. IFN-γ and IL-12 synergize to convert in vivo generated Th17 into Th1/Th17 cells. Eur J Immunol. 40(11):3017–27.
- Luk IY, Reehorst CM, Mariadason JM. 2018. ELF3, ELF5, EHF and SPDEF transcription factors in tissue homeostasis and cancer. Molecules. 23(9):2191.
- Maeda S, Osaga S, Maeda T, Takeda N, Tamechika SY, Naniwa T, Niimi A. 2019. Circulating Th17.1 cells as candidate for the prediction of therapeutic response to abatacept in patients with rheumatoid arthritis: an exploratory research. PLoS One. 14(11):e0215192.
- Nadeem A, Ahmad SF, Al-Harbi NO, Attia SM, Bakheet SA, Ibrahim KE, Alqahtani F, Alqinyah M. 2019b. Nrf2 activator, sulforaphane ameliorates autism-like symptoms through suppression of Th17 related signaling and rectification of oxidant-antioxidant imbalance in periphery and brain of BTBR T+tf/J mice. Behav Brain Res. 364:213–24.
- Nadeem A, Ahmad SF, Al-Harbi NO, El-Sherbeeny AM, Alasmari AF, Alanazi WA, Alasmari F, Ibrahim KE, Al-Harbi MM, Bakheet SA, et al. 2020. Bruton’s tyrosine kinase inhibitor suppresses imiquimod-induced psoriasis-like inflammation in mice through regulation of IL-23/IL-17A in innate immune cells. Int Immunopharmacol. 80:106215.
- Nadeem A, Ahmad SF, Attia SM, Al-Ayadhi LY, Bakheet SA, Al-Harbi NO. 2019a. Oxidative and inflammatory mediators are upregulated in neutrophils of autistic children: role of IL-17A receptor signaling. Prog Neuropsychopharmacol Biol Psychiatry. 90:204–11.
- Park JH, Jeong SY, Choi AJ, Kim SJ. 2015. Lipopolysaccharide directly stimulates Th17 differentiation in vitro modulating phosphorylation of RelB and NF-κB1. Immunol Lett. 165(1):10–19.
- Reynolds JM, Martinez GJ, Chung Y, Dong C. 2012. Toll-Like receptor 4 signaling in T cells promotes autoimmune inflammation. Proc Natl Acad Sci USA. 109(32):13064–69.
- Saravanarajan K, Douglas AR, Ismail MS, Omorogbe J, Semenov S, Muphy G, O’-Riordan F, McNamara D, Nakagome S. 2020. Genomic profiling of intestinal T-cell receptor repertoires in inflammatory bowel disease. Genes Immun. 21(2):109–18.
- Soukou S, Huber S, Krebs CF. 2021. T cell plasticity in renal autoimmune disease. Cell Tissue Res. 385(2):323–33.
- van Hamburg JP, Tas SW, van Hamburg JP. 2018. Molecular mechanisms underpinning T helper 17 cell heterogeneity and functions in rheumatoid arthritis. J Autoimmun. 87:69–81.
- van Langelaar J, van der Vuurst de Vries RM, Janssen M, Wierenga-Wolf AF, Spilt IM, Siepman TA, Dankers W, Verjans GMGM, de Vries HE, Lubberts E. et al. 2018. T helper 17.1 cells associate with multiple sclerosis disease activity: perspectives for early intervention. Brain. 141(5):1334–49.