
ABSTRACT
Purpose
To evaluate the usefulness of measuring orbital fat density in identifying post-septal involvement when initial differential diagnosis between orbital and periorbital cellulitis (OC and POC) is unclear.
Materials and Methods
Retrospective study of patients with clinical diagnosis of OC or POC who underwent contrast-enhanced computerized tomographic scans over a span of 10 years. Intraconal orbital fat density was measured with Hounsfield units (HU) in six areas on axial scans consisting of nasal and temporal intraconal sites. These measurements correlated with the initial and final diagnoses. Main outcome measures were HU values at the initial and final diagnoses.
Results
Fifty-seven patients were included. Mean HU measurement was −52 ± 18 HU for the involved side vs. −63 ± 13 for the uninvolved side (P < .001). The values were higher in cases of a final diagnosis of OC in the involved side (P < .001). The HU values were significantly higher in the nasal vs. the temporal locations of each orbit bilaterally (P < .001). The initial POC diagnosis of 20 patients (35%) was revised to OC.
Conclusion
Intraconal fat density measurements can assist in the primary assessment of orbital involvement in patients with an uncertain initial diagnosis, with a HU value higher than −50 is suggestive of orbital involvement.
INTRODUCTION
Orbital cellulitis (OC) is a serious infection seen more commonly in childhood.Citation1 Orbital and periorbital infections range from deep orbital involvement, with or without subperiosteal abscess (SPA), to a more subtle anteriorly located preseptal cellulitis. Treatment depends upon the severity and the extent of orbital infection, ranging from oral antibiotics, in cases of preseptal cellulitis, to hospitalization and intravenous antibiotics for orbital infection. Surgical intervention is considered in cases with deep tissue involvement, non-resolving SPA, or compromise vision.Citation2,Citation3 Adjunct use of systemic steroids can also be considered in both settings. Clinical manifestations of ocular motility limitation, proptosis, or visual function deterioration suggest orbital involvement, however, may be difficult to assess in the pediatric population as well as among uncooperative patients.
Distinguishing between subtle preseptal and postseptal involvement is of utmost importance since the clinical courses and sequential morbidity vary substantially.Citation4,Citation5 Computerized tomography (CT) may aid in differential diagnosis and, in select cases, the initial diagnosis will be revised based upon the clinical course and imaging findings.Citation6 Our goal was to evaluate whether orbital fat density measurements can act as a diagnostic tool for early postseptal involvement. This information could assist in clarifying cases of uncertainty at the initial diagnosis.
MATERIALS AND METHODS
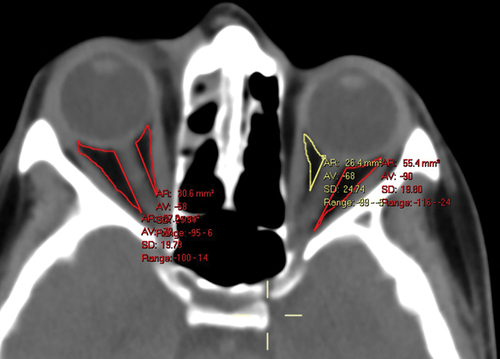
Data on all patients with a clinical diagnosis of OC or peri-orbital cellulitis (POC) who underwent contrast-enhanced CT (CE-CT) scans during a 10–year period at Sheba Medical Center were collected and analyzed. Slice width ranged between 0.63 to 3.00 millimeters in all cases. Intraconal orbital fat density was measured with Hounsfield units (HU) in six areas on axial scans. These measurements were manually performed in each area using the freehand tool of the imaging processing software (Vue Pacs 2021 © Koninklijke Philips N.V.), with care taken to include only fat tissue and exclude other tissues such as the posterior sclera, extraocular muscles, and the optic nerve. The imaging software generated mean HU values for the selected areas. The scans consisted of nasal and temporal intraconal sites at the axial equator plane, with one section above and one below (). These standardized HU measurements within the intraconal orbital fat were chosen to provide a representative view of central intraconal fat, with axial locations consistently defined for all patients, regardless of the specific orbital involvement in each case. Of note, the total spatial distance between the upper and lower sections varied based on the scan’s sliced width. The nasal and temporal intraconal HU values, as well as the total mean values, were obtained from both the involved and uninvolved sides. These measurements correlated with the initial and final diagnoses.
Figure 1. Intraconal orbital fat density as measured in the axial equator plane in a patient with right periorbital cellulitis. The text in the yellow font is automatically extracted from the manually selected area delineated by the yellow surrounding line. AR (area): 26.4 mm2 represents the surface, VA (value): −68 represents the mean hounsfield units (HU) in that area, SD (Standard Deviation): 24.74 represents the standard deviation, and range: −99 to − 3 represents the HU range in that area. The HU were measured for each study participant in 6 separate spaces of the CT scans (nasal and temporal at the axial equator plane, one section above and one below).
STATISTICAL ANALYSIS
The Chi-square test was used to calculate proportional differences between categorical groups. An independent samples t-test was used to compare means of independent continuous variables, such as HU measurements, by initial/final diagnosis. The ANOVA multivariable analysis was used to compare HU differences when comparing multiple patient groups based on differences between their initial and final diagnoses. The statistical analysis was carried out using SPSS (version 26, SPSS Inc., Chicago, IL). All results are presented as mean ± standard deviation (SD).
The described research adhered to the tenets of the Declaration of Helsinki, the study was HIPAA-compliant, and Institutional Review Board (IRB) approval was obtained. Patient consent was waived for this anonymized retrospective study.
RESULTS
The mean ± SD age of the 57 included patients was 17 ± 19 years (range 0–90), and 43 were males (75%). Eighteen cases (32%) had unilateral right-side involvement, 35 (61%) had left-side involvement, and one case presented with bilateral POC. The mean follow-up duration was 25 ± 88 days, and the mean hospitalization was 7 ± 3 days. Previous medical history included asthma in one patient and a general allergic tendency in another (3%). The mean duration of symptoms prior to presentation was 2 ± 4 days (range 0–21).
CLINICAL PRESENTATION
Initial and final visual acuities were similar for both the involved side and the uninvolved side. Signs and symptoms at presentation included eyelid edema, swelling, or erythema in all patients. Additional presentations included proptosis (n = 22, 39%), conjunctival irritation (n = 10, 17%), pain with ocular movement (n = 12, 21%), and chemosis (n = 7, 12%). Nineteen patients (33%) had ophthalmoplegia, while only 5 patients (9%) reported diplopia. None of the patients in this cohort had a relative afferent pupillary defect. Systemic signs included fever in 16 patients (28%), vomiting in 2 (3%), upper respiratory tract infection in 14 (25%), lower respiratory tract infection in 1 (2%), otitis media in 1 (2%), and allergic rhinitis in 1(2%).
Concomitant sinusitis was observed in 32 cases (56%), including involvement of the ethmoid sinus in 23 (40%), maxillary sinus in 19 (33%), frontal sinus in 9 (16%), and sphenoid sinus in 8 (14%). The mastoid bone was involved in 2 (3%) cases. Pansinusitis was documented in 11 cases (19%). Periocular insect bite and eyelid trauma were documented in 1 case each (2%), orbital trauma in 3 (5%), recent dental pathology in 2 (3%), local foreign body in 1 (2%), and hematogenous seeding in 1 (2%).
Management included systemic antibiotics in all cases. Steroid treatment was not used until recently and therefore excluded from the analysis. Surgical intervention due to sub-periosteal abscesses was performed in 6 cases (10%), including endoscopic sinus surgery in 4 (7%) and trans-orbital abscess drainage in 2 (3%).
The preliminary diagnosis was established by means of clinical examination, with or without imaging, and was POC in 34 patients (60%) and OC in 23 (40%). The final diagnosis remained unchanged (n = 36) or was revised (n = 21) based on the clinical course and CT imaging in all cases. A total of 15 patients (26%) were diagnosed as having POC and 42 (74%) as having OC. The demographics of the study population according to the final diagnosis are described in .
Table 1. Demographics and clinical presentation of 57 patients with a final diagnosis of periorbital cellulitis (POC) or orbital cellulitis (OC). The groups differ in concomitant sinusitis (being higher in the OC Group).
INTRACONAL FAT DENSITY
The mean intraconal fat density measured −52 ± 18 HU for the involved side vs. −63 ± 13 for the non-involved side (P < .001, paired samples t-test). There was a strong correlation between the HU of both orbits (R = 0.42, P = .001, Spearman’s correlation). The HU values were higher in cases of a final diagnosis of OC vs. POC in both orbits, although it was significant only for the involved side (involved side −68 POC vs. −46 OC, P < .001 and non-involved side −68 vs. −61, P = .09, independent samples t-test). The same effect was observed when considering HU measurements solely of the nasal intraconal space (involved nasal fat −62 POC vs. −30 OC, P < .001 and uninvolved nasal fat −66 vs. −55, P = .05, independent samples t-test). The average HU values for each axial section are summarized in .
Table 2. Intraconal fat density measured by hounsfield units on Contrast-enhanced Computerized Tomography (CT) in 57 patients with periorbital or orbital cellulitis. Measurements were taken on Axial CT Scan Views and obtained in 6 locations per Patient.a.
The HU values were significantly higher in the nasal vs. the temporal locations of each orbit, and this was observed both on the involved and noninvolved orbits (P < .001, paired samples t-test) (). This was also observed both in cases with ethmoidal involvement (involved side P < .001 and non-involved side P = .003, independent samples t-test) and without ethmoidal involvement (P < .001 and P < .001, respectively, independent samples t-test).
Table 3. Difference of Intraconal Fat Density between the nasal and temporal aspects of the orbit as measured by computerized tomography (CT) in 57 patients with periorbital cellulitis or orbital Cellulitis.a.
When comparing the HU values in the pediatric (age <18, n = 42) and adult (age ≥18, n = 15) patient groups, and the final diagnosis was POC, the HU values were similar between the groups in all areas, both in the involved and uninvolved sides (P > .05, independent samples t-test). However, when the final diagnosis was OC, the HU values in the pediatric group were higher in the involved side when assessing the nasal orbit (−25.1 vs. −49.6, P < .001, independent samples t-test), as well as the total orbit (−43.7 vs −56.6, P = .020, independent samples t-test), and on the nasal orbit in the uninvolved side (−52.0 vs −65.3, P = .016, independent samples t-test).
Stratification of the patients into four groups based upon initial and final diagnosis of OC and POC revealed a similar trend of higher fat density in cases with a final diagnosis of OC. These differences were significant for the involved side (P < .001, ANOVA multivariable analysis) and greater for the nasal side (P < .001, ANOVA multivariable analysis) ().
Figure 2. Orbital fat density and alteration in diagnosis from initial to final visit in 57 patients with peri-orbital cellulitis (POC) or orbital cellulitis (OC(. Left, involved orbit, right, uninvolved sides; A,B: entire orbits, C,D: nasal orbits. For the nasal orbits (C,D), these measurements represent the mean HU in the orbit, defined as the mean HU in the nasal superior, nasal at equator, and nasal inferior aspects. For the entire orbits (A,B), these measurements represent the mean HU in all aspects of the orbit (nasal superior, temporal superior, nasal at equator, temporal at equator, nasal inferior, and temporal inferior).
DISCUSSION
The differential diagnosis of early post-septal involvement in patients with peri-orbital infection and uncertain OC and POC can be altered by subsequent clinical manifestations as well as investigative findings. The current study examined the use of intraconal orbital fat density on CT scans as an effective tool to identify post-septal involvement in suspected cases. Higher HU measurements were observed in cases with a final diagnosis of OC.
HU values were similar between children and adults in POC cases. However, in OC cases, the values were higher in children. Interestingly, this difference was observed not only in the involved orbit but also on the nasal aspect of the uninvolved orbit.
The nasal intraconal fat was more extensively involved compared with that of the temporal quadrants in all three axial planes. This was observed not only in the involved orbit but also in the clinically uninvolved contralateral orbit. Comparison of the HU values at initial vs. final diagnoses revealed a similar pattern for both orbits (), suggesting that the uninvolved, contralateral orbit may also show radiographic evidence of hyperemia, or subclinical involvement. Of note, in a recent unpublished study, we found increased HU density in the nasal aspect of normal orbits. Overall, HU values were higher (less negative) than −50 in cases of OC.
ORBITAL AND PERIORBITAL CELLULITIS
The orbital septum is a membranous tissue that extends from the tarsal plate to the orbital rim, where it fuses with the periorbita in a fibrous condensation known as the “arcus marginalis”.Citation7 By definition, POC is differentiated from OC by the presence of postseptal involvement.Citation8 However, OC and POC may be two entities on a single continuum.Citation9 Differentiating between these conditions is based mostly upon clinical examination alone; proptosis and opthalmoplegia are the most common distinguishing signs while reduced visual function can be seen in progressive OC cases.Citation1 An imaging study is mandatory when OC is suspected, and it is also indicated in select cases of POC, such as worsening clinical manifestations despite appropriate medical therapy, uncooperative patients with uncertain diagnoses, any clinical suspicion suggestive of other causes (e.g., history of high-grade lymphoma), or a lack of response to antibiotics over 48 hours.Citation2
Pre-septal cellulitis is diagnosed on imaging by soft tissue swelling and inflammation confined to the preseptal structures.Citation2,Citation3 Imaging may provide additional evidence of disease extension as well as a concurrent sinus or dental disease origin.Citation10 CE-CT is the modality of choice, since it delineates both soft-tissue components as well as bony involvement. The contrast material is very helpful in cases of suspected infection by optimizing the visualization of abscesses as well as highlighting inflammation and infiltration. A hallmark feature of orbital cellulitis is postseptal fat stranding.
Although magnetic resonance imaging (MRI) spares the patients from the ionizing radiation of CT scans, it is usually less available as well as has limited utility in the pediatric population, due to the need for sedation and typically reserved for use in patients with poor cooperation.Citation11 MRI is reportedly beneficial in cases where intracranial complications, such as cavernous sinus thrombosis, are suspected.Citation12
Rarely, a patient may present with minimal external findings and an apparently normal CT scan, which can be falsely reassuring.Citation13 We aimed to demonstrate that intraconal fat, which may appear normal at first glance, can actually be involved in select cases, and that HU measurements can accurately demonstrate this subclinical involvement, as well as assist in identifying early postseptal infection.
FAT DENSITY AND INFLAMMATORY CONDITIONS
HU are objective measures that are independent of local PACS systems or screen displays, and that will not alter while “windowing” the image.Citation14,Citation15 Previous studies have emphasized the role of fat density measurements in the diagnosis and understanding of various inflammatory conditions. The importance of HU measurements has been demonstrated in systemic conditions as well. For instance, increased density in the fat surrounding the internal carotid artery, suggesting perivascular inflammation, was identified ipsilateral to stroke.Citation16 Coronary artery inflammation and plaque were also demonstrated by peri-coronary fat density.Citation17,Citation18 Greater subcutaneous fat density was associated with greater systemic inflammation among patients with HIV,Citation19 and abdominal intermuscular adipose tissue density was associated with inflammatory markers.Citation20 The increase in HU in orbital cellulitis could be influenced by various factors, including both infection within the fat and reactive inflammation of the fat due to the surrounding infection. Understanding the precise mechanisms underlying these HU alterations is complex and may involve a combination of factors, including the type and extent of infection, the host’s immune response, and the individual patient’s unique characteristics.
An interesting observation in this study was the higher HU values in children with OC compared to adults. Several theories can explain these findings. First, differences in tissue composition between children and adults, such as variations in the amount of fat and water in their soft tissues, may lead to variations in HU values, especially during orbital involvement. Second, the inflammatory response in children with orbital cellulitis may be more pronounced, as seen in pediatric cataract surgery, where children exhibit a more robust inflammatory reaction than adults.Citation21 Third, it is possible that the initial infection in the pediatric group in this cohort was more extensive or severe; however, this possibility was not examined. Since the HU values were also higher on the uninvolved side (in the nasal aspect), this increase may be attributed to more pronounced hyperemia or other components of the inflammatory response. Further research is needed to investigate and characterize these potential differences.
Similarly, HU may serve as a viable tool in the initial evaluation of POC and OC. Orbital inflammation or edema will cause a relative increase in intraconal fat HU values (i.e., a less negative value). Normal fat measures in the negative range of −50 to −150 in non-CE-CT, but are are higher in CE-CT. In addition, it can be useful to compare the fat density of one orbit to that of the contralateral orbit. Higher measurement values can be indicative of subclinical orbital involvement, progression of the infection, or an erroneous initial diagnosis, and therefore, may warrant a more aggressive management, such as hospital admission or intravenous instead of oral antibiotics. Based upon the results of this study, we recommend measuring the mean HU values at least in the nasal aspect of the involved orbit. The implications of contralateral radiologic involvement that were revealed in our investigation warrant further study.
Limitations of the current study may include a selection bias, since the study population included patients who presented to a single, tertiary referral medical center and no patients had milder cases of preseptal cellulitis. In addition, patients who did present to our hospital, but were diagnosed as POC without undergoing subsequent orbital imaging, were also excluded. We presume that the true orbital fat density in milder cases of POC is probably lower (i.e., more negative) than represented in this study. Another limitation of this study stems from the variation in the sites of involvement among patients. This is in contrast to the standardized intraconal fat measurements, which remained consistent among all patients.
In conclusion, intraconal orbital fat density can assist in the primary assessment of orbital involvement in patients with an uncertain initial diagnosis. An HU value higher (less negative) than −50 suggests orbital involvement, whereas one below −60 may rule it out. The nasal intraconal fat may be more sensitive, and its measurements can be diagnostic. The clinically uninvolved orbit may also have higher HU values. We propose that HU measurements can aid in the early identification of orbital involvement in cases of uncertainty, and thereby enhance management.
Disclosure statement
No potential conflict of interest was reported by the author(s).
Additional information
Funding
References
- Tsirouki T, Dastiridou AI, Ibánez Flores N, et al. Orbital cellulitis. Surv Ophthalmol. 2018;63(4):534–553. doi:10.1016/j.survophthal.2017.12.001.
- Roelofs KA, Weis E. Pre-septal Orbital Cellulitis. In: Ben Simon G, Greenberg G Landau Prat D, eds. Atlas of Orbital Imaging. Springer International Publishing; 2022:591–598. doi:10.1007/978-3-030-62426-2_66.
- Roelofs KA, Weis E. Orbital Cellulitis. In: Ben Simon G, Greenberg G Landau Prat D, eds. Atlas of Orbital Imaging. Springer International Publishing; 2022:599–604. doi:10.1007/978-3-030-62426-2_67.
- Georgakopoulos CD, Eliopoulou MI, Stasinos S, Exarchou A, Pharmakakis N, Varvarigou A. Periorbital and orbital cellulitis: a 10-year review of hospitalized children. Eur J Ophthalmol. 2010;20(6):1066–1072. doi:10.1177/112067211002000607.
- Williams KJ, Allen RC. Paediatric orbital and periorbital infections. Curr Opin Ophthalmol. 2019;30(5):349–355. doi:10.1097/ICU.0000000000000589.
- Dohlman JC, Habib LA, Cunnane ME, Yoon MK. Subperiosteal masqueraders as compared to subperiosteal abscess: contrasting clinical presentation and radiographic densities. Ophthalmic Plast Reconstr Surg. 2020;36(6):596–600. doi:10.1097/IOP.0000000000001659.
- Rootman J, Rootman DB, Stewart B, et al. Ocular Adnexa, Soft Tissue, and Extraocular Muscles. In: Ben Simon G, Greenberg G Landau Prat D, eds. Atlas of Orbital Imaging. Springer International Publishing: 2022: pp. 33–46.10.1007/978-3-030-62426-2_3.
- Baiu I, Melendez E. Periorbital and Orbital Cellulitis. JAMA. 2020;323(2):196. doi:10.1001/jama.2019.18211.
- Wong SJ, Levi J. Management of pediatric orbital cellulitis: A systematic review. Int J Pediatr Otorhinolaryngol. 2018;110:123–129. doi:10.1016/j.ijporl.2018.05.006.
- Jabarin B, Eviatar E, Israel O, Marom T, Gavriel H. Indicators for imaging in periorbital cellulitis secondary to rhinosinusitis. Eur Arch Otorhinolaryngol. 2018;275(4):943–948. doi:10.1007/s00405-018-4897-4.
- Jain SF, Ishihara R, Wheelock L, et al. Feasibility of rapid magnetic resonance imaging (rMRI) for the emergency evaluation of suspected pediatric orbital cellulitis. J Aapos. 2020;24(5):e289.1–e289.4. doi:10.1016/j.jaapos.2020.05.018.
- Jyani R, Ranade D, Joshi P. Spectrum of Orbital Cellulitis on Magnetic Resonance Imaging. Cureus. 2020;12(8):e9663. doi:10.7759/cureus.9663.
- Basily A, Mansukhani S, Anzeljc A, Gutierrez P. Orbital Cellulitis-When Computed Tomography imaging is falsely reassuring. Pediatr Emerg Care. 2021;37(1):e48–e50. doi:10.1097/PEC.0000000000001521.
- Greenberg G, Landau PD, Ben SG. Orbital Imaging Pearls. In: Ben Simon G, Greenberg G Landau Prat D, eds. Atlas of Orbital Imaging. Springer International Publishing; 2022:pp. 179–187. doi:10.1007/978-3-030-62426-2_127.
- Kim DS, Lobo RR, Kahana A. Orbital CT. In: Ben Simon G, Greenberg G Landau Prat D, eds. Atlas of Orbital Imaging. Springer International Publishing; 2022:pp. 99–102. doi:10.1007/978-3-030-62426-2_111.
- Baradaran H, Myneni PK, Patel P, et al. Association Between Carotid Artery Perivascular Fat Density and cerebrovascular ischemic events. J Am Heart Assoc. 2018;7(24):e010383. doi:10.1161/JAHA.118.010383.
- Gaibazzi N, Martini C, Botti A, Pinazzi A, Bottazzi B, Palumbo AA. Coronary inflammation by computed tomography pericoronary fat attenuation in MINOCA and Tako-Tsubo Syndrome. J Am Heart Assoc. 2019;8(17):e013235. doi:10.1161/JAHA.119.013235.
- Goeller M, Tamarappoo BK, Kwan AC, et al. Relationship between changes in pericoronary adipose tissue attenuation and coronary plaque burden quantified from coronary computed tomography angiography. Eur Heart J Cardiovasc Imaging. 2019;20(6):636–643. doi:10.1093/ehjci/jez013.
- Lake JE, Debroy P, Ng D, et al. Associations between subcutaneous fat density and systemic inflammation differ by HIV serostatus and are independent of fat quantity. Eur J Endocrinol. 2019;181(4):451–459. doi:10.1530/EJE-19-0296.
- Vella CA, Allison MA. Associations of abdominal intermuscular adipose tissue and inflammation: the multi-ethnic study of atherosclerosis. Obes Res Clin Pract. 2018;12(6):534–540. doi:10.1016/j.orcp.2018.08.002.
- Whitman MC, Vanderveen DK. Complications of pediatric cataract surgery. Semin Ophthalmol. 2014;29(5–6):414–420. doi:10.3109/08820538.2014.959192.