
 ?Mathematical formulae have been encoded as MathML and are displayed in this HTML version using MathJax in order to improve their display. Uncheck the box to turn MathJax off. This feature requires Javascript. Click on a formula to zoom.
ABSTRACT
A model-based investigation of the interplay between furnace setup and spatio-temporal evolution of particles’ state variables is also presented. The effect of feed size distribution and processing of ultrafine ore are discussed. The process is controlled primarily by the wall temperature and secondarily the air feeding rate; an increase of furnace wall temperature from 900 to 1200°C reduced the final density to 484, 979, and 1262 kg/m3 for feed size of 150 μm, 250 μm, and 350 μm. Model predictions are in good agreement with the experimental measurements possessing differences below 10% in most cases.
1. Introduction
The development of hollow, inorganic, and lightweight microparticles has gained attention due to their massive use as filler in composites, with glass microspheres being considered among the most commonly used ones due to their low weight, high sphericity, size homogeneity, and acceptable resistance to crushing. Typical applications are in syntactic foams (Anirudh et al. Citation2022; Bai et al. Citation2022; Sonti, Vincent, and Narala Citation2022), additive manufacturing (Brzeski et al. Citation2021), ceramics (Dong et al. Citation2020; Tatlisu et al. Citation2022), drilling fluid (Konbul, Ozbayoglu, and Mata Citation2020), cementitious composites (Cuevas et al. Citation2021; Scott et al. Citation2022), leading to weight, shrinkage and warpage reduction, improved rheology, thermal and sound insulating characteristics, or even providing with functional characteristics such as conductivity, wave absorption, and electromagnetic shielding (Bu et al. Citation2020).
Expanded mineral microspheres are lightweight, with multicellular inner structure and spherical shape. Τhey are produced by thermal treatment of hydrous volcanic glass of rhyolitic composition and is a cost-effective alternative to glass microspheres. The expansion occurs at temperature over 800°C and is attributed to the parallel release of water species (molecular water and hydroxyl groups) as volatiles and the softening of the grain, causing plastic deformation to its structure. This leads to the development of dense air bubbles’ network in its structure and the up to 16 times increase of the original volume. Typical applications of the material are as filler in lightweight cementitious products (Chen et al. Citation2020; Leong et al. Citation2020), organic composites (Angelopoulos et al. Citation2022; Rallini et al. Citation2018; Spoerk et al. Citation2017), or even for energy storage (Li et al. Citation2022). The expansion process on pilot or production level is challenging because it is highly temperature- and time-sensitive, rendering products’ quality control cumbersome. Moreover, the production of fine mineral microspheres is impossible in the conventional perlite expansion devices, primarily because of the fineness of the feed and the lack of adequate control of particles heating time and temperature (Angelopoulos, Gerogiorgis, and Paspaliaris Citation2013).
A new expansion method has been developed based on indirect heating technology, and Vertical Electric Furnace prototype (VEF) was built. The new equipment enables accurate control of the expansion process and mild heating of ultrafine particles, allowing the production of high quality mineral microspheres from hydrous volcanic minerals (Angelopoulos, Gerogiorgis, and Paspaliaris Citation2013). Particles move downwards under the effect of gravity and the co-current air stream in the vertical heating chamber, which is heated externally by heating resistances. The expanded microspheres produced in the electric furnace acquire up to 6 times higher compressive strength, 20% lower water absorption capacity and lower porosity compared to samples of similar expansion degree that were produced conventionally (Angelopoulos et al. Citation2016). Similar to other metallurgical processes, a precise knowledge of processing conditions is impossible due to the limited accessibility in the heating chamber and the extreme prevailing conditions, thus process optimization is restricted to parametric investigation of both process and material (feed) parameters in terms of the product quality in the frame of properly designed experimental campaigns (Jamali et al. Citation2022; Meshram and Abhilash Citation2020; Mookherjee et al. Citation1992; Song and Jokilaakso Citation2022). Alternatively, process simulation through computational fluid dynamics (CFD) has emerged as an important tool in process optimization and comprehension of the involved phenomena (Chang, Irons, and Jiao Citation2005; Chattopadhyay, Isac, and Guthrie Citation2001; Jokilaakso et al. Citation1995). This is because, after proper implementation, CFD modeling allows determination of all crucial flow field properties and particles state variables, which are too complicated and expensive to determine experimentally.
There are a few published studies dealing with the modeling of vertical gas- or oil-fired and electrical furnace, and the expansion of perlite, including CFD modeling. The features of the bibliographic models are presented in .
Table 1. Comparison of models developed to simulate perlite expansion and furnace conditions.
Papanastassiou was the first who investigated the kinematic behavior of perlite particles inside a conventional gas-fired furnace by a simplified mathematical model, accounting only for heat transfer by convection, and ignoring thermal radiation and expansion (Papanastassiou Citation1980). Klipfel et al. developed CFD code model for the expansion of perlite particles on a gas-fired pilot scale furnace (Klipfel et al. Citation1998). An empirical correlation that links the temperature-dependent dynamic viscosity of the grain with the density was applied to simulate expansion, while water release kinetics, water content and the chemical composition of the grain were ignored. Zahringer et al. applied a foam growth model to simulate water vapor bubble growth in softened perlite melt taking into consideration the temperature-dependent physical properties of the melt (Zähringer, Martin, and Petit Citation2001). Despite its usefulness in investigating the phenomenon, the model is not applicable to real scale simulation. Regarding the VEF system, Angelopoulos et al. developed a first-principle mathematical model for the prediction of the spatial evolution of major flow field properties inside the furnace heating chamber, and simulated motion, heating and expansion of a single perlite particle along its trajectory in one dimension (Angelopoulos, Gerogiorgis, and Paspaliaris Citation2013, Citation2014). The expansion has been simulated by combining Navier-Stokes equation for spherical creeping flow, the bubble surface stress balance, and the melt radial velocity equation, yielding an ODE for bubble radius evolution, taking into account the thermophysical properties of the particle. Model limitations arise from the single grain approach, the ignorance of turbulence, the consideration of particle displacement along one dimension only, and the assumption of negligible radial variation of air temperature and velocity. On an earlier study, the researchers applied commercial CFD code to investigate air temperature and velocity profiles in the heating chamber in terms of furnace setup (Angelopoulos, Kapralou, and Taxiarchou Citation2011). Major weakness constitutes the fact that, the study was limited to the fluid phase ignoring the presence of solid particles that affect both flow characteristics and the thermal energy distribution in the system.
An integrated model capable to simulate mineral microspheres’ processing and expansion in the VEF is of practical interest, contributing in deeper understanding of the process and involved phenomena, and also identification of the interplay between the raw material quality, the applied conditions and the furnace design. It will allow identification of problems related to local overheating, vortexes that may cause particles’ recirculation, mass accumulation points, backflow and updrifts, and to investigate potential improvements of the current system performance. From a wider viewpoint, certain aspects of the process possess fundamental challenges in the field of two-phase flow and heat transfer; (1) the study of particles’ kinematic behavior and heating is complex due to the expansion and density reduction along their trajectories, (2) the study of radiation mode of heat transfer is complicated, especially due to temperature gradation among heating zones, (3) air enters the system in high velocity forming vena contracta region at the furnace head, and (4) the need for a phenomenological model to model expansion of hydrous volcanic glass, that accounts for water release kinetics as the determining factor.
The study presents a new CFD model that was built to simulate thermal processing of mineral microspheres in a VEF. Based on the geometry of the furnace, a 3D computational grid has been created and turbulent model applied to predict the flow field characteristics. Particles were introduced and modeled as a discrete phase, accounting for their effect on the flow field characteristics (two-way coupling), and coal swelling model has been employed to mimic the expansion of volcanic glass for the first time in the literature. Model regulation prerequisites knowledge of water release kinetics for the material, thus both activation energy and pre-exponential factor were calculated for volcanic glass by Friedman and Kissinger method, respectively, using thermogravimetric data. The model allows investigation of the interplay between furnace setup, expansion conditions and evolution of particles’ state variables enabling also the prediction of obtained density which is the primary qualitative metric. Certain cases of interest like narrow and wide size dispersion of the feed and feeding of ultrafine ore are studied and discussed.
2. Materials and methods
2.1. The vertical electric furnace (VEF) and model domain
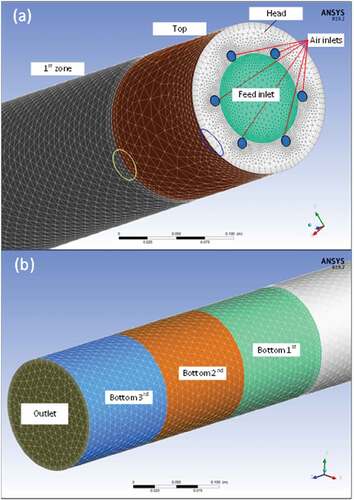
The installation consists of the VEF main body, the air supply system, the air hammer, and the furnace head where raw material feed and air injection take place in the heating chamber (). The heating chamber is made of FeCrAl alloy of 12 mm thickness, it is 3 m long with diameter of 0.135 m (CitationKanthal Company official webpage). The heating chamber is surrounded by six semi-cylindrical heating modules of 2 kW wattage. The air supply system consists of an air compressor, capable to supply up to 400 L/min, and a set of flowmeters and pressure gauges for the regulation of the volumetric air flow rate. A 4-kW tubular air preheater allows heating of the feeding air stream up to 400°C. The air stream is injected at the furnace head; at this location the air is distributed to a hollow cylindrical section and it’s fed inside the heating chamber is done through six holes with diameter of 6 mm. Granular raw material is loaded on a conical silo that lies above the furnace. The material is fed inside the furnace through an air-lock valve, located at the basis of the silo. Special design of airlock valve prevents hot air updrafts escaping and smooth material flowing inside the furnace heating chamber.
Figure 1. Photo of the Vertical electric furnace used for microspheres production (a), and schematic with furnace peripheral (b).
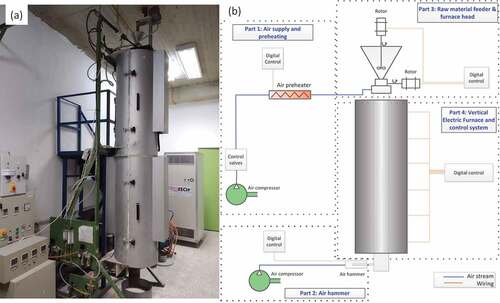
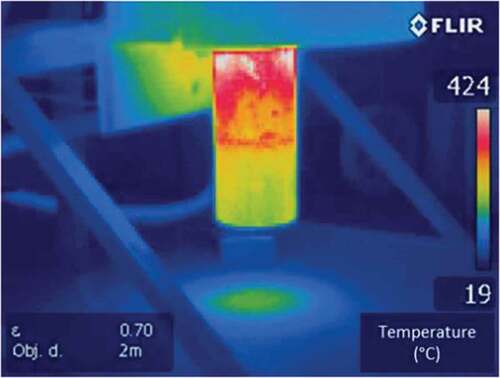
The model domain constitutes the volume enclosed by the internal surface of the heating chamber (). The domain consists of six cylindric volumes corresponding to the six heating zones formed by the heating resistances. One more cylindric volume exists at the top of the heating chamber (top at ). The central hole from which raw material is fed is located at the top of the chamber, surrounded by six peripheral air injection holes. The bottom part of the heating chamber, which is not insulated presents intensive temperature gradation toward the furnace exit, as seen in thermal image of . Such gradation has been considered in the model by splitting the surface in three equally sized cylinders, thus allowing individual temperature setting at each surface according to preceded experimental measurements.
Figure 2. Sketch of the VEF open view (a), and modelled geometry with boundaries conditions (b).
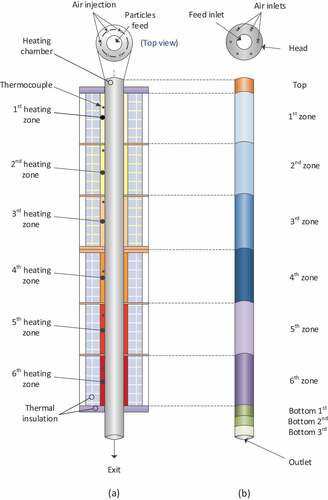
Figure 3. Thermal image of the bottom part of the furnace showing intensive temperature gradation.
2.2. The CFD model
A Eulerian – Lagrangian approach is applied to simulate the production of expanded microspheres in the furnace heating chamber, where gaseous phase is modeled as a continuum, while the particles are tracked discretely. The gas phase is assumed incompressible, and is modeled using 3D steady states realizable k-ε model (Shih et al. Citation1995). Compared to the standard k-ε model, it includes a new formulation for turbulent viscosity, and a new transport equation for the dissipation rate, derived from an exact equation for the transport of the mean-square vorticity fluctuation. It have been shown that, compared to other turbulence models, the aforementioned modifications increased the performance of the model for cases that involve strong streamline curvature, recirculation and separation zones, vortices and rotation (Kannan, Karthikeyan, and Sundararaj Citation2017; Sugash et al. Citation2021). Recent representative applications of the model constitute its use for modeling of inclined negatively buoyant jet (Tahmooresi and Ahmadyar Citation2021), a gas-liquid venturi scrubber (Yang et al. Citation2019), pneumatic conveying of particles (Zhou et al. Citation2018), and fluid catalytic cracking regenerator (Azarnivand, Behjat, and Safekordi Citation2018). Species’ transport model was used to consider particles’ motion. The use of turbulence model was chosen based on Reynolds number at the furnace inlet which exceeded 3500 units for air feeding rate of ≥100 L/min, as well as because of the vena contracta region that is detected at the furnace inlet and the consecutive and intensive change of the furnace wall temperature along the heating chamber that causes disturbance of the flow streamlines favoring turbulence formation. The expansion of microspheres was modeled by enabling species transport of combustible particles with combustible fraction set to zero, volatile fraction to non-zero value and swelling factor set over unity, denoting particles expansion during devolatilization. Radiation heat transfer mechanism from the internal surface of the chamber to the particles was included through Discrete Ordinates (DO) model.
The model was built using ANSYS Fluent 19.2 and solved in double precision mode. The continuity equation, momentum and energy equation were discretized using a second-order upwind method, while pressure-velocity coupling was performed by the SIMPLE algorithm. The fundamental equations for the fluid phase (mass and momentum conservation, k-ε turbulent model), equations for estimation of temperature-dependent thermophysical properties, and equation for particles’ motion and heating (convective and radiation) are presented in Appendix A, thus below only the equations related to the new expansion model (water release kinetics from hydrous volcanic glass and microspheres’ expansion model) are presented.
Dynamic water release from perlite microspheres is considered by applying single kinetic rate devolatilization model, which assumes that the devolatilization rate is first-order dependent on the amount of volatile remaining in the particle. The model was developed to simulate thermal decomposition of pulverized coal particles under rapid heating conditions (Badzioch and Hawksley Citation1970). In that case, the temporal evolution of particle mass due to volatile release is calculated by the following equation:
where fv,i is mass fraction of volatiles initially present in the particle, mp,i is the initial particle mass, and k is the kinetic rate of devolatilization. For particles that swell during devolatilization, particles’ diameter is calculated by the following equation:
where dp,i and dp are initial and current particle diameter. Csw is the swelling coefficient determined by the user as the ratio of the expected maxima and initial diameter of the particle. The model allows linkage between devolatilization phenomenon and particle swelling and is utilized to mimic the expansion of perlite microspheres under thermal treatment ().
Figure 4. Particle expansion model.
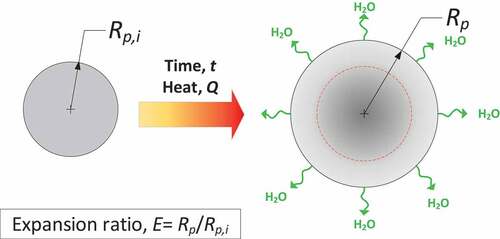
As far as the swelling coefficient setting value is concerned, for rhyolitic volcanic glass the minimum achievable bulk density is around 60 kg/m3, thus a maximum diameter increase (and swelling coefficient value) by 2.7 is assumed considering initial density of 2293 kg/m3.
The kinetic rate, k of EquationEquation (1)(1)
(1) is defined by the Arrhenius equation:
where A is the preexponential factor, Ea is the activation energy and is the universal gas constant (8.314 J∙mol−1∙K−1). A kinetic analysis is required for the determination of A and Ea of water release from perlite microspheres during thermal treatment. For this purpose, experimental thermogravimetric analyses under four different heating rates were implemented and weight loss curves were obtained. In solid state reactions, the decomposition rate is given by the following generalized equation:
da/dt denotes the conversion rate (min−1), t is the time (min) and f(a) is the differential form of the reaction model. a is the conversion degree which is expressed as:
In EquationEquation (5)(5)
(5) , mi is the initial mass, mt is the mass at time t and mf is the mass that corresponds to the end of conversion. By substituting EquationEquation (3)
(3)
(3) , EquationEquation (4)
(4)
(4) takes the following form:
Under non-isothermal conditions at a constant heating rate, β=dT/dt, EquationEquation (6)(6)
(6) takes the following form:
An isoconversional analysis was implemented for the determination of Ea. The isoconversional principle states that the reaction rate at constant extent of conversion is a function of temperature, while relevant methods are also known as ‘model-free’ since they allow determination of the activation energy without taking into account the reaction model. The Friedman method constitutes one of the most common isoconversional methods, that allows accurate calculation of Ea over the entire conversion degree, and its use is referred by the International Confederation for Thermal Analysis and Calorimetry (ICTAC) (Vyazovkin et al. Citation2011). Friedman’s equation result from logarithm and rearrangement of EquationEquation (6)(6)
(6) (Friedman Citation1963):
A plot of ln(da/dT) versus 1/T at constant a for a set of β values gives a family of straight lines with slope equal to -Ea/R, allowing estimation of Ea at various conversion degrees of interest. Knowing the Ea value, the calculation of the pre-exponential factor A can be carried out through Kissinger’s method (Sronsri, Noisong, and Danvirutai Citation2017; Vyazovkin et al. Citation2011).
Subscript max on temperature denotes relevant values when sample weight loss rate maximizes. Under the assumption of first-order reaction order, f’(a)=(1-a)’=-1.
2.3. Discretization, boundary conditions and solution strategy
Modeling domain is discretized in 559,469 cells of which 162,118 are wedges forming a layer of five elements at the chamber wall and along the entire geometry, and 397,351 tetrahedra ().
Figure 5. Top-side view of meshing at the furnace head and the 1st zone (a), and at the bottom of the furnace (b). Blue ellipse encloses the layer of fine wedges applied nearby and along the furnace walls, and the yellow one depicts enhancement of mesh fineness at the proximity of boundaries.
A list of the boundaries and boundaries’ types exist in the modeled geometry is tabulated in .
Table 2. Boundaries’ types and range of setting values.
The identification of the level of interaction between the solid and the fluid phase that needs to be considered is primarily dictated by the volume fraction of particles in the heating chamber (ap=Vp/V) (Elghobashi Citation1994; Greifzu et al. Citation2016). In one-way coupling, the affection of flow field pattern by the particle flow is neglected, which is valid when volume fraction is on the level of 10−6 or below, while for greater volume fractions particles’ feedback is taken into account on the fluid (two-way coupling). When the volume fraction is even larger than 10−3, collision between particles becomes important and four-way coupling is applied. Volume of perlite particles was calculated for a typical case; for particle residence time of 4 s, perlite feeding rate of 4 kg/h, average particles density of 600 kg/m3, particles’ mass fraction was found to be 1.7∙10−4, while for the extreme case where average particles density is 300 kg/m3 and residence time is 8 s, it is 6.7∙10−4. Under these conditions, the effect of the solid particles on the flow regime needs to be considered, thus two-way coupling was applied. The solution strategy is presented in .
Figure 6. Solution strategy in two-way coupling scheme.
The model was solved on an Intel(R) pc with a i7 8750 H type CPU running at 2.20 GHz, and a 16 GB RAM. Simulation time was on average around 6 h for the fluid phase and another 10 h for the discrete phase model under two-way coupling.
2.4. Microspheres expansion, experimental measurements, and characterization analyses
Elemental analysis of perlite sample was performed through X-ray fluorescence technique on a ZSX Primus IV tube-above sequential wavelength dispersive X-ray fluorescence spectrometer (Rigaku, Tokyo, Japan). Perlite sample was grounded to fine powder and subjected to drying overnight at 105°C. 4 g of sample was collected and pressed into pellets with the addition of 1 g of CEREOX binder (Fluxana, Bedburg-Hau, Germany) on a hydraulic press at 200 kN. For the thermogravimetric analysis, raw perlite was grounded and sieved, and −125 μm grade was collected and dried overnight at 105°C. The thermogravimetric analyses (TGA) were carried out on a NETZSCH STA449 Jupiter F5 device (NETZSCH Holding, Selb, Germany). 10 ± 1 mg of dry perlite sample was subjected to controlled heating under ambient atmospheres, in temperature range between 25 and 1100°C and heating rate of 2.5, 5.0, 10, and 20°C/min.
Air velocity and air temperature measurements were performed at the furnace exit for model validation purposes. The specific location was chosen aiming minimization of the incident radiation from the inner furnace walls to the sensor surface, which is a known source of measurement error, favored by extreme wall temperature and low air velocity (Blevins and Pitts Citation1999; Brohez, Delvosalle, and Marlair Citation2004). Air temperature was measured with a k-type thermocouple equipped with pointed stainless-steel sensor (Omega Engineering, Connecticut, USA), while for air velocity an Extech hot wire thermos-anemometer was used (model SDL350, Extech Instruments, Flir Systems, Oregon, USA). The error in temperature and velocity measurement is 0.75% and 5%, respectively. Thermal imaging camera was used for temperature mapping of the outer surface at the furnace exit (model E75, Extech Instruments, Flir Systems, Oregon, USA).
For the validation of the expansion model, an experimental campaign was organized including the thermal treatment of fine perlite toward the production of expanded microspheres at different furnace wall temperature. Furnace wall temperature ranged between 800 and 1200°C, while other process parameters were: air feeding rate of 50 L/min, feed air temperature 25°C, material feeding rate of 4 kg/m3. As far as the raw feed granulometry is concerned, two grades were prepared by mechanical sieving of dry sample and tested; the fine with size between 149–177 μm (100 and 80 mesh, respectively), and the course with size between 250 and 297 μm (60 and 50 Mesh, respectively).
3. Results and discussion
3.1. Grid independence
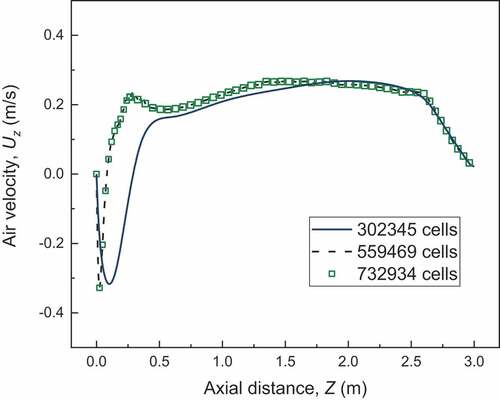
Reliable results from CFD analysis should be independent to the computational grid (Greifzu et al. Citation2016). To check this, the common practice is the discretization of the computational geometry to grids of different density and compare the simulation results. In this study, further to the standard grid of 559,469 cells, a denser and thinner discretization scheme were applied to the modeled geometry, consisted of 732,934 and 302,345 cells, respectively, with five-layer wedges and tetrahedral cells. A standard isothermal case of 1000°C wall temperature and 50 L/min air feeding rate was solved for all grids and the calculated spatial evolution of the air velocity along the furnace centreline for each grid is depicted in . The comparison does not reveal any remarkable deviation in calculated values for the cases of standard and dense discretization scheme (559469 and 732,934 cells, respectively). As far as the thinner grid is concerned, despite the fact that it gave similar air velocity values with other grids at the main body of the furnace (z >1 m), it failed in the calculation of the sharp deviation identified at the entrance region. Consequently, standard grid was chosen as the most appropriate for the implementation of the calculation, because it ensures sufficient accuracy in the calculations and wise use of the computational power.
Figure 7. Axial velocity of air along the furnace centerline for different mesh thickness (Tw=1000°C, Qair,in=50 L/min).
3.2. Kinetics of water release and expansion
Naturally hydrated rhyolite was used as feed for the production of expanded microspheres. The composition of the feed material is presented in . The material content in aluminosilicates reaches 73 wt. %, with alkali content (K and Na) of almost 8 wt. %, while according to its LOI content it is categorized as perlite (Le Maitre et al. Citation2002).
Table 3. Chemical composition of mineral fed.
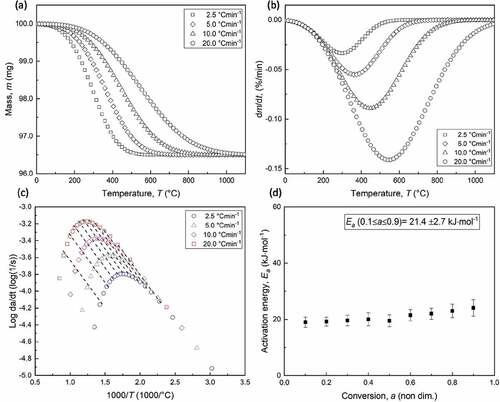
depicts weight loss of perlite sample versus temperature under four different heating rates and environmental conditions. All four samples experienced weigh loss of 3.5 ± 0.1% at a temperature range between 100 and 900°C, which is solely attributed to the release of different water types (loosely held and chemically bound molecular water, hydroxyl groups) (Angelopoulos et al. Citation2020, Citation2021). The derivatives of weight loss curves versus temperature for all measurements that were carried out under different heating rate are depicted in . It appears that curves obtained under higher heating rate are shifted to the right (higher temperature), which is attributed to the heat transfer that occurs within the sample and the decrease in the exposure time as the heating rate increases (Hu et al. Citation2016). Weight loss rate maximizes at 298.1, 363.1, 446.9, and 543.3°C for applied heating rates of 2.5, 5.0, 10.0, and 20.0°C/min, respectively. Friedman plots along conversion degree range of 0.1 to 0.9 with step of 0.1 are depicted in . The lines are almost parallel thus denoting insignificant change of activation energy value over the applied conversion degree. Indeed, calculated Ea values of perlite decomposition possesses imperceptible increase by increase of conversion degree; at a = 0.1 Ea value is 19 ± 1.8 kJ/mol and at a = 0.9 it is 24.1 ± 3.0 kJ/mol, presenting mean Ea value along the entire conversion of 21.4 kJ/mol. The relatively small deviation (<15%) of calculated Ea values over considered conversion range renders valid the single stage reaction assumption (Vyazovkin et al. Citation2011). Other researchers who estimated Ea for perlite based on thermogravimetric data found similar values; for samples with initial water content of 4.01 and 4.12 wt. %, the calculated Ea were 36.3 and 22.4, respectively (Bagdassarov, Ritter, and Yanev Citation1999).
Figure 8. Mass loss (a) and derivative of mass loss (b) versus temperature of perlite particles (−125+90 μm) under four different heating rates, and Friedman plot (c) and the calculated activation energy of perlite decomposition versus conversion degree (d).
Under the assumption that perlite decomposition is obeyed by reaction order model of the first order, and using the mean Ea value calculated, the pre-exponential factor value was calculated by EquationEquation (9)(9)
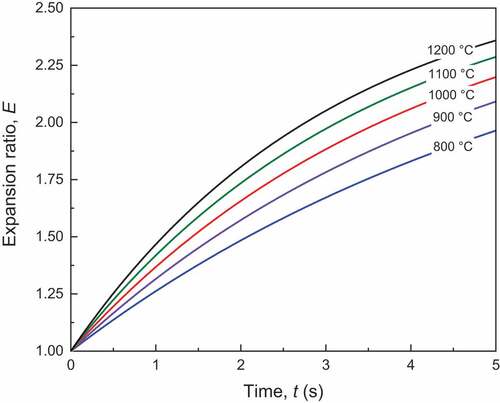
(9) to have logA value of −1.521. depicts temporal evolution of dimensionless expansion ratio for particle heated to different temperature level, estimated by swelling model EquationEquation (2)
(2)
(2) and using calculated Ea and A for perlite microsphere expansion. As expected, the increase of particle temperature causes expansion to higher levels. Indeed, according to the diagram, particle heating for 5 s at 800 and 1200°C led to expansion ratio of 1.820 and 2.35, respectively, which corresponds to theoretical density of 380 and 176 kg/m3. Curves’ tangent increases by increasing particle temperature, thus informing that expansion rate is also enhanced at higher temperature.
Figure 9. Microspheres’ expansion ratios calculated by particle swelling model for different temperatures.
3.3. Spatio-temporal evolution of critical particle state variables
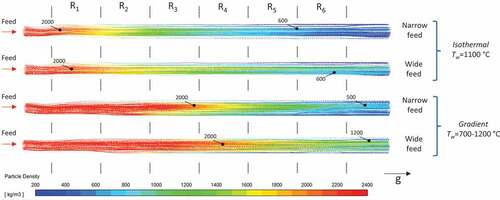
The evolution of expansion in terms of the size of the feed material under isothermal and gradient mode of operation of the furnace is studied by simulating the thermal treatment of various monodispersed feed materials with initial size between 150, 250, and 350 μm. On isothermal case, furnace wall temperature was set uniformly at 1100°C, while in gradient cases, the 1st zone was set at 700°C with increasing step of 100°C toward the bottom of the furnace and the 6th at 1200°C. In all cases, material feeding rate is 4 kg/h. depicts particle tracks, colored adequately to represent the spatial evolution of particles’ density, temperature, and velocity for different initial diameter of the feed material mode of operation of the furnace.
Figure 10. Particle tracks coloured by density (left), temperature (middle) and velocity (right) for different feed size (150, 250, and 350 μm) and under isothermal and gradient mode of operation of the furnace.
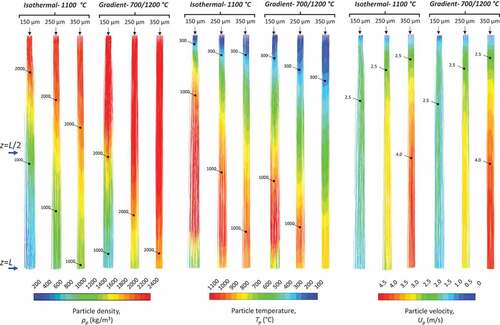
Particles possess cathodic motion along their trajectories in the chamber, which is smoother and more homogenous when the diameter of the feed material is equal or exceeds 250 μm, while for the fine raw material particles’ stream expands quickly reaching furnace wall. Small particles obtain higher temperature along their trajectories, which is known to enhance the expansion evolution leading to lower final density when feed size is 150 μm, compared to the cases where feed size is equal to or exceeds 250 μm, in both isothermal and gradient operating mode of the furnace. Regardless of the size of the feed material, particles accelerate once entering the heating chamber, and upon initiation of expansion their velocity stabilizes followed by deceleration; this characteristic kinematic behavior of perlite particles in the VEF has been confirmed by other modeling studies (Angelopoulos, Gerogiorgis, and Paspaliaris Citation2013, Citation2014). A comparison between the isothermal and the gradient mode of operation of the furnace informs that in gradient cases the heat obtained by the particles is less, leading to lower temperature and pure expansion. It is worth noting that such conditions and smooth motion of particles during thermal processing and expansion are not the case for the gas-fired furnace; it has been shown that, in conventional furnaces particles follow chaotic motion, experiencing successive collisions on the inner wall of the furnace, due to the intensive updrift and strong turbulence that are created by the combustion (Berdi, Founti, and Kakaras et al. Citation1993; Klipfel et al. Citation1998). It is characteristic of such systems that perlite particles travel by 11 m in less than 1.5 s.
Further to the spatial evolution of critical particle state variables, the temporal evolution of particles’ temperature, water content, density and velocity is depicted in . The depicted values are the mass weighed average values for different moments along the particles’ trajectories, from the moment they enter to the time they exit the furnace.
Figure 11. Temporal evolution of mass-weighted averaged values of critical particle state variables for different feed size (150, 250 and 350 μm) treated under isothermal (Tw=1100°C, Qair,in=50 L/min) and gradient (Tw,1=700°C, Tw,6= 1200°C, step 100°C, Qair,in=50 L/min); temperature (a), water content (b), density (c) and velocity (d).
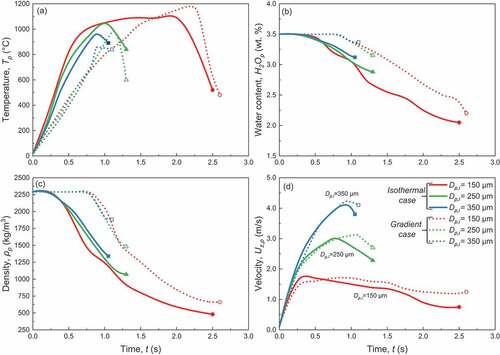
The residence time of the particles is mainly dictated by the feed size; it is ≈2.5 s for 150 μm feed size, ≈ 1.25 s for 250 μm feed size, and ≈1 s for 350 μm feed size, regardless of the mode of operation of the furnace. As seen in , fine particles (150 μm) correspond quick to heating, possessing higher heating rates and reaching furnace wall temperature before exiting the furnace. Mean maximum temperature reached for 250 μm and 350 μm feed size was 1045°C and 957°C for isothermal mode of operation of the furnace and 985°C and 858°C for gradient operation mode, respectively. The heating rate is higher for the particles treated under isothermal furnace conditions, because all zones are set at 1100°C, while for the gradient mode of operation the setting point of 1st, 2nd, 3rd, and 4th zone is 700, 800, 900, and 1000°C leading to almost linear variation of particles’ temperature versus time. It is worth noting here, that our previous simplified model overestimated the maximum temperature, which in case of particles with initial diameter of 150, 250 and 350 μm was calculated as 1100, 1090, and 980°C, respectively, which in turn gave higher expansion degrees and particles’ residence time; on previous model the residence time of respective particles was found to be 6, 2.5, and 1.5 s (Angelopoulos, Gerogiorgis, and Paspaliaris Citation2014). The single grain assumption in the heating chamber and the lack of cloud of particles caused overestimation of particle temperature, since in real case descending dusty cloud reduces the incidence radiation and the overall temperature of the particles (Hu et al. Citation2022).
The milder heating of particles treated under gradient mode of operation of the furnace delays water release, as seen in ; indeed, for particles treated under isothermal mode of operation, water release initiates about 0.25 s after particles entering the furnace, while for gradient particles the phenomenon activation occurs at t ≈ 0.75 s. Particles with initial diameter of 150 μm treated under isothermal mode of the furnace possess highest water release; 2 wt. % of water still remains in the material after the thermal treatment, while mean density obtained by the particles is 475 kg/m3, as shown in . The behavior of the model, in terms of the water that remains in the grain, is in line with other studies which have shown that the water contained in volcanic glass can be discretized as residual water and effective water, in terms of its role in the expansion for commercial purposes; the effective water release during the expansion process, while the residual still remains in the non-crystalline matrix of the material after the thermal treatment. More specifically, Shackley suggests that the amount of residual water content range between 20 and 60 wt. % of the initially contained water (Shackley Citation1988), Roulia et al. found that it is between 51 and 59 wt. % (Roulia et al. Citation2006), and Angelopoulos et al determined it as 44 wt. % (Angelopoulos, Gerogiorgis, and Paspaliaris Citation2013). Thus, the common situation of the residual water content is successfully predicted by the developed model, enabling realistic simulation of the expansion process. For both isothermal and gradient mode of operation of the furnace the finest the raw material used, the highest expansion ratio is achieved and the lower the density obtained by the material. More specifically, for feed size of 150, 250, and 350 μm the density obtained is 478 kg/m3, 1071 kg/m3, and 1345 kg/m3 for treatment under isothermal mode, and 662 kg/m3, 1473 kg/m3 and 1881 kg/m3 under gradient mode of operation of the furnace, respectively. It is important to note that, regarding the fine feed, despite the fact that the maximum temperature reached by the particles is greater when treated under gradient mode of operation (1178°C vs 1103°C), particles treated under isothermal mode obtained considerably lower density. This is because in isothermal case the overall heat received by the particles is higher than in gradient mode enhancing the expansion; indeed, in isothermal case the temperature of the particles exceeds 1000°C for approximately 1.4 s (from t = 0.75 s to t = 2.15s), while for gradient mode of operation this time period lasts about 0.9 s (from t = 1.4 s to t = 2.3 s).
As seen in , particles accelerate rapidly once entering the furnace, reaching velocity maxima together with the initiation of the expansion. Coarser grains experience higher acceleration as shown by higher inclination in t-Up,z curve compared to the fine ones. Higher velocity maxima are identified for coarser grains than for the fine ones; the maximum velocity reached by the feed with size of 150, 250, and 350 μm is approximately 1.75 m/s, 3.0 m/s, and 4.15 m/s with slight differences arise by applying different mode of operation of the furnace. The aforementioned behavior is related to the terminal velocity of the particles, which increases for particles having the same density and higher diameter, and decreases for particles of the same diameter and lower density (Kalman and Matana Citation2022). Moreover, the generalized delay in deceleration of particles treated under gradient mode of operation reveals the lag of the expansion. For comparison purposes, it is given that the maximum velocity of particles was found by a previous model to be 0.8, 1.5, and 2.4 m/s for particles with initial diameter of 150, 250, and 350 μm; the lower upper speed of the bibliographic model is attributed to the higher particle temperature, which triggered expansion on an early stage when particle speed was comparatively low (Angelopoulos, Gerogiorgis, and Paspaliaris Citation2013, Citation2014).
3.4. Sensitivity analysis of main process parameters
A systematic investigation of the effect of feed size and the primary process parameters, including furnace temperature, air feeding rate and feed air temperature is presented in the current section The aim is to identify the sensitivity of the major qualitative metric, which is density, on the changes of the main process and feed parameters. depicts the final mean, minimum and maximum density of grains composing a sample produced by the treatment of feed with size of 150 μm, 250 μm, and 350 μm under different furnace wall, air feeding rate and feed air temperature and for isothermal and gradient operating mode of the furnace.
Figure 12. Mean, minimum and maximum density of perlite microspheres obtained by treatment of monodispersed raw material of 150 μm, 250 μm, and 350 μm size for different furnace wall temperature (a,b), air feeding rate (c,d) and feed air temperature (e,f), and under isothermal (a,c,e), and gradient mode (b,d,f) of operation of the furnace.
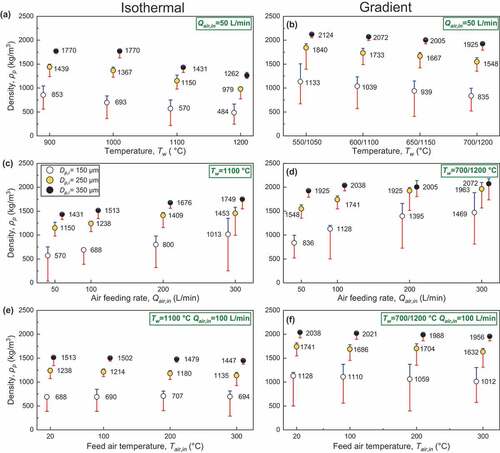
It is obvious that at the studied range of feed granulometry, the obtained density is always smaller when feed size is 150 μm and increase for 250 and 350 μm. Furnace wall temperature constitutes determining factor in the obtaining density; an increase of furnace wall temperature by 300°C for isothermal mode of operation (from 900 to 1200°C) and by 150°C for gradient one (from 550/1050 to 700/1200°C) causes reduction of the obtained density by 43.2%, 32%, and 28.7% for feed size of 150 μm, 250 μm, and 350 μm treated under isothermal (), and by 26.3%, 15.8% and 9.4% under gradient operating mode of the furnace (), respectively. A comparison between isothermal case of 1000°C and gradient cases of 650/1150°C in terms of the density of the obtained samples inform that, even when the setting point of certain furnace zones is set at or over 1000°C, it is crucial to make the most of the entire length of the furnace by applying setting temperature over 900°C, when the aim is to obtain lightweight product.
An increase of the air feeding rate from 50 L/min to 300 L/min causes increase of the obtained density by 77.2%, 26.3%, and 22.2% for feed size of 150 μm, 250 μm, and 350 μm treated under isothermal (), and by 75.3%, 26.8%, and 7.6% under gradient operating mode of the furnace (), respectively. It appears here that fine feed is more vulnerable to density burdening due to the increase of the air feeding rate, while the risk is mitigated by increase the feed size.
The effect of the injection of air that is preheated at various temperatures on the final density of samples with different feed size, comparing it with the case of ambient air injection at the same flowrate is presented in , for isothermal and gradient mode of operation of the furnace. The increase of the feed air temperature from ambient to 300°C causes reduction of the product density by 8.3% and 4.4% for feed size of 250 μm and 350 μm when treatment take place under isothermal conditions, and of 6.3% and 4.0% when treatment is carried out by applying temperature gradation along the furnace. Under gradient mode of operation, and when feed size is 150 μm the injection of preheated air at 300°C results in reduction of density by 11.2% compared to the injection of ambient air, while for isothermal mode of operation the difference is imperceptible.
The presented results confirm the experimental observations and previous studies that has pointed out the primary importance of furnace wall temperature and secondarily air feeding rate as determining operating parameters toward control of final microspheres density control; expansion is enhanced by increased furnace wall temperature and minimum air feeding rate that is known to accelerate particles motion reducing the heating time, while the use of air preheated up to 300°C changes the product density insignificantly (Angelopoulos, Gerogiorgis, and Paspaliaris Citation2014).
3.5. The effect of size dispersion of the feed
It has been shown that, particle size of the feed emerges as a crucial process parameter, since, during processing, grains of different size experience considerably different temporal evolution of the crucial state variables leading to different final expansion degree. Thus, size dispersion of feed particles is of particular interest because it may burden the quality of the expanded microspheres expressed by wide difference in fractional density.
Two feeds of narrow (90–150 μm) and wide (90–300 μm) size distribution are tested aiming to identify the granulometry of the obtained microspheres and inhomogeneity in grains’ density. present size distributions of narrow and wide feed and of the obtained microspheres, respectively, together with Rossin-Rammler parameters (size constant, n: distribution parameter) (Alderliesten Citation2013). Distribution parameter (n) is a determining factor of the size dispersion in a granular sample, while in Fluent the
is defined as the diameter up to which the cumulative mass fraction of the sample is 36.8%. depict the densities obtained in terms of the initial diameter of the composing the narrow and wide feeds, respectively. The thermal treatment of both grades take place under isothermal (Tw = 1100°C, Qair,in = 50 L/min) and gradient furnace mode of operation (Tw = 700/1200°C, Qair,in = 50 L/min) denoted as ISO and GRAD here. The visualization of the thermal treatment is given in which depicts particles tracks colored by particles’ density along their trajectories is the chamber.
Figure 13. Size distribution of feed and products obtained by the treatment of narrow (a) and wide (b) granulometry of the feed and Rossin-Rammler parameters of feed and products (size constant, n: distribution parameter), and density obtained by grains of different size in the case of narrow (c) and wide (d) size distribution of the feed.
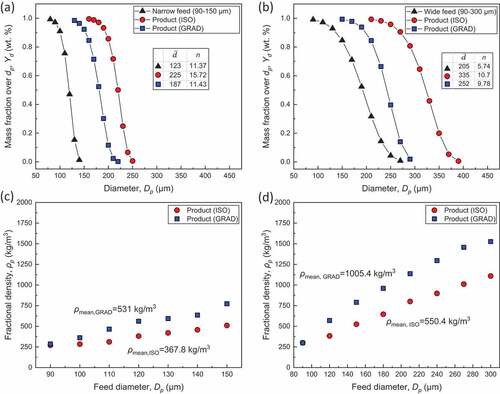
Figure 14. Particle tracks coloured by density for narrow and wide size distribution of the feed, treated under isothermal and gradient operating mode of the furnace.
Either for wide or narrow size distribution of the feed, the implementation of isothermal conditions along the heating chamber led to the production of microspheres grades of narrower size distribution and thus higher size homogeneity, as denoted by the higher distribution parameter values. Also, the establishment of 1100°C along the furnace wall resulted in lower density of the microspheres’ grades either for the wide and the narrow granulometry of the feed; the obtained densities for narrow feed under isothermal and gradient profile were 367 kg/m3 and 531 kg/m3, while for the wide one was 550.4 kg/m3 and 1005 kg/m3, respectively. Regarding the inhomogeneity in particles’ density, obviously it is higher when the feed is characterized by wide granulometry. However, again, the choice of isothermal operating mode of the furnace is beneficial, since the range of grains densities in terms of the size is smaller, thus informing about higher density homogeneity. As observed in , the spatial evolution of particles’ density reveals that the initiation of the expansion occurs much earlier for the isothermal temperature profile, rather when temperature gradation is applied along the heating chamber. As a consequence, no considerable evolution in particles’ density occurs until particles pass by the 2nd zone of the furnace which setting point was 800°C and reach 3rd zone which temperature was set at 900°C. The inhomogeneity in the expansion of feed with wide granulometry over narrow ones is visualized through the variation in particles’ densities at the exit of the furnace.
3.6. Treatment of ultrafine materials
The production of expanded microspheres using ultrafine raw material with size below 100 μm is challenging mainly due to the very low terminal velocity of such grades that prolongs their residence time in the chamber, promoting overheating and molten mass sticking at the interior of the chamber. Such situation possesses practical interest due to the wide applicability of such ultrafine grades, thus it is worth studying by considering feed size of 75 μm on feeding rate of 4 kg/h. present contours of air temperature (left) and particles’ concentration (center) at the midplane of the chamber, and particle tracks colored by density (right), for the case where furnace wall temperature is set isothermally at 1100°C under different air feeding conditions.
Figure 15. Contours of air temperature (left) and particles’ concentration (centre) at the midplane of the furnace under different air feeding conditions, and particle tracks coloured by density (right) [Other parameters: Tw= 1100°C, Dp,i 75 μm and Qp,in=4 kg/h].
![Figure 15. Contours of air temperature (left) and particles’ concentration (centre) at the midplane of the furnace under different air feeding conditions, and particle tracks coloured by density (right) [Other parameters: Tw= 1100°C, Dp,i 75 μm and Qp,in=4 kg/h].](/cms/asset/1bce84b9-a127-4ec9-a68a-a1eba2dc86b4/gmpr_a_2161536_f0015_oc.jpg)
Under minimal air injection (50 L/min), a wide isothermal air zone is established along the furnace, radically different to the usual parabolic temperature profile identified in all cases presented previously. The temperature exceeds 1000°C at the region occupied by thermal zones 1 to 6, insignificant radial gradation is identified, while high particles concentration is identified at the same position. Observation of the particle tracks shows that particles follow a chaotic motion in the chamber with significant attenuation of trajectories population at the bottom part of the furnace. The concentration contour informs that particles accumulation occurs in that case at the main body of the furnace, and at the furnace head.
A radically different situation is established when the air feeding rate reaches or exceeds 100 L/min; in such cases the establishment of a radically different air temperature pattern occurs along the furnace heating chamber characterized by parabolic shape with higher temperatures identified at the vicinity of the chamber’ walls. Under the injection of ambient air at 100 L and 300 L/min rate, the maximum temperature along the furnace centreline is 1002°C and 754°C, respectively, while when air is preheated at 300°C it is 954°C. In such cases, particles possess clear cathodic motion with gradual decrease of their density and minimum values identified at the exit of the furnace.
The reason of ultrafine particles’ stagnation when treated under low air feeding rate lies in the air stream behavior. Abolpour et al. investigated velocity and temperature profile in a vertical heated tube through a validated CFD model. They identified plug flow with limited velocity distribution across the tube for air feeding rate at and below 20 L/min, while the increasing of the gas flow to 100 L/min decreased turbulence stem from the buoyancy force, causing more uniform velocity and parabolic temperature profile (Abolpour et al. Citation2017). Stagnation conditions are further enhanced by the lower terminal velocity of fine particles in comparison to coarser ones; assuming spherical perlite particle of 75 and 200 μm moving in air media of 800°C, for raw particles the terminal velocity is 0.36 and 1.74 m/s and for expanded ones 0.163 and 0.71 m/s, respectively (Kalman and Matana Citation2022).
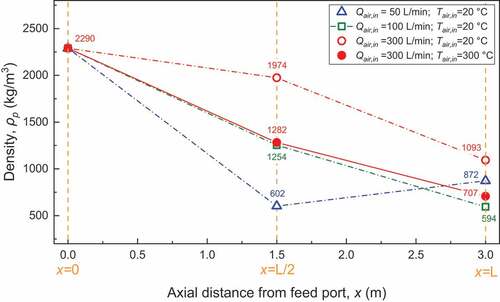
presents calculated averaged densities of particles at three different axial positions; at the furnace inlet (x = 0), at the middle (x=L/2) and at the exit of the chamber (x=L), for different air injection conditions. Normally, the particles experience cathodic motion and increasing temperature that leads in expansion, and it is expected that the particles exit the furnace at the higher expansion ratio, due to the irreversibility of the expansion. However, it appears that for minimum air feeding rate (50 L/min), the particles’ density is lower at the middle of the furnace, obtaining 602 kg/m3 compared to the exit where average value is as high as 872 kg/m3. Obviously, and in line with particles’ tracks presented in , the fine particles’ stagnation in heating zones of the furnace increases heating time favoring the expansion to higher level. This is not the case under further increase of the air feeding rate where no stagnation is observed in particles’ tracks; at air feeding rate of 100 and 300 L/min, particles’ density at the middle of the furnace is 1254 and 1974 kg/m3 and at the furnace exit is 549 kg/m3 and 1093 kg/m3, respectively. Evidently, the conditions favoring fine particles stagnation are fulfilled when air feeding rate is below 100 L/min. Another noteworthy finding is that for the specific feed grade, the addition of energy source in the system by means of preheated air at 300°C is beneficial to the expansion performance since the final mean particles density reach 707 kg/m3.
Figure 16. Mass weighted average of particles’ density at two cross sections of the chamber located at the middle distance between the furnace head and the exit (z=l/2) and at the furnace exit (z=l), under different air feeding conditions. Processing condition are identical to those applied in samples of .
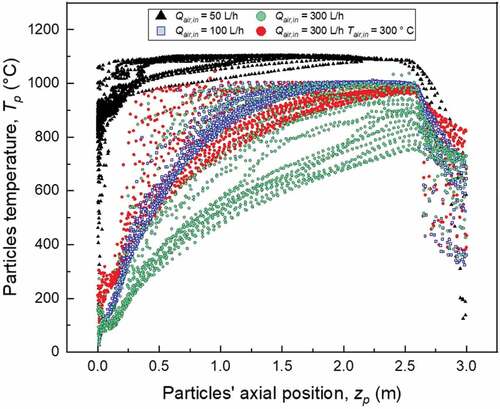
The spatial evolution of particles’ temperature for different air injection conditions is depicted in . Compared to other cases, for air feeding rate of 50 L/min a significant increase of particles temperature occurs at the furnace head, where over the 1st thermal zone of the furnace the majority of the grains obtain temperature over 1000°C, justifying the existence of particles at advanced expansion stage at this location. Along the furnace most of the grains obtained temperature over 1050°C. Gradual increase of particles temperature along the chamber with limited radial variations occurs for air feeding rate of 100 L/min. Radically lower temperature along the chamber and higher radial variation is identified when ambient air is injected at 300 L/h rate; in such case the temperature of the grains at the bottom end of the 6th thermal zone varies between 742 and 970°C, justifying the relatively high final density that particles obtained after treatment with such conditions. As expected, the injection of preheated air raises the particles’ temperature, while the wide variation of the particles’ temperature at the furnace head, that attenuates toward the exit, is attributed to the higher preheated air injection velocity.
Figure 17. Spatial evolution of particles’ temperature along their trajectories for different air feeding conditions.
3.7. Model validation
The accuracy of the model to simulate the microspheres production process was tested by comparing principal model results with certain crucial experimental measurements. More specifically, the air temperature and velocity at the exit of the furnace was measured using exposed junction thermocouple and hot-wire anemometer, respectively, under isothermal mode of operation of the furnace, furnace wall temperature equal to 1000°C, and ambient air feeding rate of 50, 100, 200 and 300 L/min, with experimental measurements and model results depicted in and tabulated in . Except to the case where the air feeding rate is 100 L/min, the air velocity is underestimated by the model with maximum error of over 20% identified for the case where air feeding rate is 50 L/min, while in all other cases it does not exceed 15%.
Figure 18. Diagrams with comparison of experimental measurements and simulation results; (a) calculated and measured values of air velocity and temperature at the exit of the chamber under different air feeding rate and constant furnace wall temperature (Tw=1000°C), and (b) comparison of calculated and experimentally measured expansion ratio of perlite particles expanded under various furnace wall temperature.
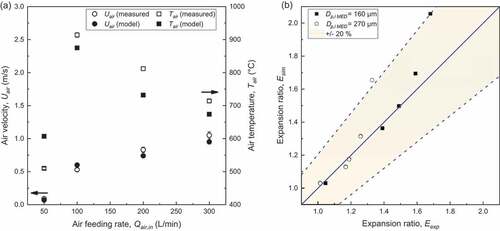
Table 4. Comparison of measured values of air temperature and air velocity at the exit of the chamber, and respective values calculated by the model, and absolute error.
Furthermore, the accuracy of the model to predict the obtained expansion degree of microspheres processed under different conditions is tested by comparing relevant experimental measurements and model results. More specifically, two feed grades of narrow granulometry were prepared and subjected to expansion under isothermal model of operation of the furnace and different furnace wall temperature. The grades size was 149–177 μm and 250–297 μm with median size of 160 and 270 μm, respectively, and both were treated with furnace wall temperature of 800, 900, 1000, 1100 and 1200°C and air feeding rate of 50 L/min. Samples were subjected to Loose Bulk Density (LBD) measurement using a graduated volumetric cylinder, and a simple procedure was followed to estimate their experimental expansion ratio. In case of a monodisperse sample of spherical particles, the sample density is related to the loose bulk density (LBD) by the following equation (Angelopoulos, Gerogiorgis, and Paspaliaris Citation2013):
Under the same circumstances, and having the sample density, the expansion ratio (Eexp) can be calculated by the following equation:
With ρp,i representing density of raw perlite that was measured as 2293 kg/m3. Thus, EquationEquation (10)(10)
(10) allows estimation of density through LBD, and EquationEquation (11)
(11)
(11) calculation of experimental expansion ratio of sample. depicts density and expansion ratio values for all samples determined by experimental expansion campaigns, and those obtained by simulations, considering monodisperse feed with size of 160 and 270 μm, and wide furnace wall temperatures, and relevant values are tabulated in .
Table 5. Measured and calculated density and expansion ratio values for microsphere samples obtained by the treatment of feed with size of 150 and 250 μm treated under isothermal mode of operation of the furnace and for different furnace wall temperature.
Model predictions are in good agreement with the experimental measurements, possessing difference that is less than 20% in almost all studied cases. In both cases where the median diameter of the feed was 160 and 270 μm, the calculated expansion ratio is quite similar to the experimental one when furnace temperature is 800, 900, 1000 and 1100°C, while values present higher variance which marginally exceeds 20% for furnace temperature of 1200°C. Possible sources of error constitute the assumption of monodisperse feed, and that water release occurs as a single-stage, first order solid state reaction.
4. Conclusions
The study presents CFD modeling of the thermal treatment and expansion of hydrous mineral microspheres in a vertical electric furnace. Realizable k-ε turbulence model was employed for the simulation of flow field characteristics, particles were considered as a discrete phase and two-way coupling strategy was followed to account for their effect in flow regime and the thermal performance of the system, taking into account the heat transfer through radiation by DO model. Coal swelling model was used to simulate hydrous volcanic particles expansion after thermal treatment. The adapted model is adjustable to feed quality because it accounts for water release kinetics, which is the driving force of the expansion. Friedman and Kissinger method were employed for the mathematical treatment of thermogravimetric data and determination of activation energy and pre-exponential factor respectively, throughout the temperature range of interest. Model results were validated following a two-stage comparison of experimental and calculated results of the air temperature and velocity at the furnace exit, and of the expansion degree obtained by particles that were processed at different conditions.
The following conclusions were drawn from the analysis of the model results:
Particles experience rapid heating and acceleration once entering the furnace, followed by deceleration at the expansion onset prolonging particles heating and processing time. Primary furnace wall temperature and secondarily air feeding rate control furnace performance in terms of the expanded microspheres’ density; an increase of furnace wall temperature by 300°C for isothermal mode of operation (from 900 to 1200°C) causes reduction of the final density by 43.2%, 32% and 28.7% for feed size of 150 μm, 250 μm and 350 μm, obtaining density 484, 979 and 1262 kg/m3.
Feeding of air in rate over 100 L/min causes significant reduction of the furnace temperature deteriorating the expansion process, while the injection of preheated air to temperature up to 300°C does not compensate heat losses.
With the current design, and for the specific volcanic glass type, the furnace is capable to treat feed with initial size up to 350 μm, while the expansion of coarser grades is expected to be inadequate because of the limited residence time in the furnace.
For the special case, where ultrafine feed is processed (Dp,i = 75 μm) the risk of particles’ stagnation can be eliminated by the injection of air to volumetric rate of 50 L/min or higher.
Density distribution of size fraction composing the product is higher when feed is characterized by wide size distribution, thus narrow feed grades should be preferred.
The use of coal swelling model can model the expansion of hydrous volcanic glass under thermal treatment, provided that the kinetics of water release for the specific material have been studied; on this study, the activation energy and pre-exponential factor were calculated as 21.4 kJ/mole and Log A=-1.521 s−1, respectively.
Supplemental Material
Download MS Word (49.5 KB)Disclosure statement
No potential conflict of interest was reported by the authors.
Supplemental data
Supplemental data for this article can be accessed online at https://doi.org/10.1080/08827508.2022.2161536.
References
- Abolpour, B., M. M. Afsahi, M. Yaghobi, A. S. Goharrizi, and M. Azizkarimi. 2017. Interaction of heat transfer and gas flow in a vertical hot tube. Heat and Mass Transfer 53 (7):2409–17. doi:10.1007/s00231-017-1991-x.
- Alderliesten, M. 2013. Mean particle diameters. Part VII. the Rosin-Rammler size distribution: Physical and mathematical properties and relationships to Moment-Ratio defined mean particle diameters. Particle & Particle Systems Characterization 30 (3):244–57. doi:10.1002/ppsc.201200021.
- Angelopoulos, P. M., D. I. Gerogiorgis, and I. Paspaliaris. 2013. Model-based sensitivity analysis and experimental investigation of perlite grain expansion in a vertical electrical furnace. Industrial & Engineering Chemistry Research 52 (50):17953–75. doi:10.1021/ie401144r.
- Angelopoulos, P. M., D. I. Gerogiorgis, and I. Paspaliaris. 2014. Mathematical modeling and process simulation of perlite grain expansion in a vertical electrical furnace. Applied Mathematical Modelling 38 (5–6):1799–822. doi:10.1016/j.apm.2013.09.019.
- Angelopoulos, P., C. Kapralou, and M. Taxiarchou. 2011. CFD modeling of vertical electrical furnace for perlite expansion-study of the air temperature and velocity profiles. 7th International Congress on Computational Mechanics, Athens, Greece. CD edition.
- Angelopoulos, P. M., C. Maliachova, K. Papakonstantinou, M. Taxiarchou, and S. Diplas. 2016. Structural and physical characteristics of fine perlite expanded with a novel method in a vertical electric furnace. Mineral Processing and Extractive Metallurgy 125 (2):71–80. doi:10.1080/03719553.2016.1156244.
- Angelopoulos, P. M., N. Manic, B. Jankovic, and M. Taxiarchou. 2021. Thermochimica acta thermal decomposition of volcanic glass (rhyolite): Kinetic deconvolution of dehydration and dehydroxylation process. Thermochimica Acta 707:179082. doi:10.1016/j.tca.2021.179082.
- Angelopoulos, P. M., N. Manić, P. Tsakiridis, M. Taxiarchou, and B. Janković. 2020. Dehydration of rhyolite: Activation energy, water speciation and morphological investigation. Journal of Thermal Analysis and Calorimetry 142 (1):395–407. doi:10.1007/s10973-020-10105-2.
- Angelopoulos, P. M., N. R. Vrithias, Z. Viskadourakis, P. Tsakiridis, K. C. Vasilopoulos, A. Peppas, G. Asimakopoulos, A. V. Spyrou, M. A. Karakassides, M. Taxiarchou, et al. 2022. Methods of Preparation and Performance Evaluation of ABS/Mineral Microsphere Composites Produced through FDM and Compression Molding. Materials (Basel) 15 (14):5021. doi:10.3390/ma15145021.
- Anirudh, S., C. G. Jayalakshmi, A. Anand, B. Kandasubramanian, and S. O. Ismail. 2022. Epoxy/Glass syntactic foams for structural and functional application-A Review. European Polymer Journal 171:111163. doi:10.1016/j.eurpolymj.2022.111163.
- Azarnivand, A., Y. Behjat, and A. A. Safekordi. 2018. CFD simulation of gas–solid flow patterns in a downscaled combustor-style FCC regenerator. Particuology 39:96–108. doi:10.1016/j.partic.2017.10.009.
- Badzioch, S., and P. G. W. Hawksley. 1970. Kinetics of thermal decomposition of pulverized coal particles. Industrial & Engineering Chemistry Process Design and Development 9 (4):521–30. doi:10.1021/i260036a005.
- Bagdassarov, N., F. Ritter, and Y. Yanev. 1999. Kinetics of perlite degassing: TG and DSC analysis. Glass Science and Technology 72:277–90. doi:10.1016/s0140-6701%2801%2980621-4.
- Bai, C., J. Shao, X. Li, Z. Zhang, Y. Qiao, J. Hao, H. Li, T. Zheng, and P. Colombo. 2022. Fabrication and properties of slag-based geopolymer syntactic foams containing hollow glass microspheres. Materials letters 308:131158. doi:10.1016/j.matlet.2021.131158.
- Berdi, T., M. Founti, E. Kakaras, A. Klipfel, and Z. Ntouros. 1993. On the optimisation of expansion processes of industrial minerals. Energy Efficiency in Process Technology 827–36. doi:10.1007/978-94-011-1454-7_73.
- Blevins, L. G., and W. M. Pitts. 1999. Modeling of bare and aspirated thermocouples in compartment fires. Fire Safety Journal 33 (4):239–59. doi:10.1016/S0379-7112(99)00034-X.
- Brohez, S., C. Delvosalle, and G. Marlair. 2004. A two-thermocouples probe for radiation corrections of measured temperatures in compartment fires. Fire safety journal 39 (5):399–411. doi:10.1016/j.firesaf.2004.03.002.
- Brzeski, D., I. L. Hia, J. F. Chauvette, R. D. Farahani, N. Piccirelli, A. Ross, and D. Therriault. 2021. Design of thermoset composites for high-speed additive manufacturing of lightweight sound absorbing micro-scaffolds. Additive Manufacturing 47:102245. doi:10.1016/j.addma.2021.102245.
- Bu, F., J. Zhang, S. Yu, Q. Li, G. Li, J. Wang, X. Wu, and T. Goto. 2020. Effective surface pretreatment of hollow glass microspheres via a combined KF roughening and alkali washing strategy for the following metallization. Advanced Powder Technology 31 (6):2305–14. doi:10.1016/j.apt.2020.03.024.
- Chang, K., G. A. Irons, and Q. Jiao. 2005. A mathematical Model of a Dc Electric Furnace for Recovery of Zinc from Lead Blast Furnace Slag. Canadian Metallurgical Quarterly 44 (2):281–88. doi:10.1179/cmq.2005.44.2.281.
- Chattopadhyay, K., M. Isac, and R. I. L. Guthrie. 2001. Kinetics of perlite glasses degassing. TG and DSC analysis. Fuel and Energy Abstracts 42:58. doi:10.1016/S0140-6701(01)80621-4.
- Chen, F., Y. Zhang, J. Liu, X. Wang, P. K. Chu, B. Chu, and N. Zhang. 2020. Fly ash based lightweight wall materials incorporating expanded perlite/SiO2 aerogel composite: Towards low thermal conductivity. Construction and Building Materials 249:118728. doi:10.1016/j.conbuildmat.2020.118728.
- Cuevas, K., M. Chougan, F. Martin, S. H. Ghaffar, D. Stephan, and P. Sikora. 2021. 3D printable lightweight cementitious composites with incorporated waste glass aggregates and expanded microspheres – Rheological, thermal and mechanical properties. Journal of Building Engineering 44:102718. doi:10.1016/j.jobe.2021.102718.
- Dong, X., M. Wang, X. Tao, J. Liu, and A. Guo. 2020. Properties of heat resistant hollow glass microsphere/phosphate buoyancy materials with different coatings. Ceramics International 46 (1):415–20. doi:10.1016/j.ceramint.2019.08.277.
- Elghobashi, S. 1994. On predicting particle-laden turbulent flows. Applied Scientific Research 52 (4):309–29. doi:10.1007/BF00936835.
- Friedman, H. L. 1963. Kinetics of thermal degradation of char-forming plastics from thermogravimetry. Application to a phenolic plastic. Journal of Polymer Science Part C: Polymer Symposia 6 (1):183–95. doi:10.1002/polc.5070060121.
- Greifzu, F., C. Kratzsch, T. Forgber, F. Lindner, and R. Schwarze. 2016. Assessment of particle-tracking models for dispersed particle-laden flows implemented in OpenFOAM and ANSYS FLUENT. Engineering Applications of Computational Fluid Mechanics 10 (1):30–43. doi:10.1080/19942060.2015.1104266.
- Hu, F. F., Y. F. Cheng, B. B. Zhang, B. -Y. Jiang, C. Ji, and R. Liu. 2022. Flame propagation and temperature distribution characteristics of magnesium dust clouds in an open space. Powder Technology 404:117513. doi:10.1016/j.powtec.2022.117513.
- Hu, M., Z. Chen, S. Wang, D. Guo, C. Ma, Y. Zhou, J. Chen, M. Laghari, S. Fazal, B. Xiao, et al. 2016. Thermogravimetric kinetics of lignocellulosic biomass slow pyrolysis using distributed activation energy model, Fraser–Suzuki deconvolution, and iso-conversional method. Energy Conversion and Management 118:1–11. doi:10.1016/j.enconman.2016.03.058.
- Jamali, S., S. Javanshir, H. Arabyarmohammadi, and P. Tahmasebizadeh. 2022. Process Optimization and Flowsheet Development for Zinc and Copper Recycling from Reverberatory Furnace Flue Dust. Mineral Processing and Extractive Metallurgy Review 43 (3):360–72. doi:10.1080/08827508.2020.1861614.
- Jokilaakso, A., T. Ahokainen, O. Teppo, Y. YANG, and K. LILIUS. 1995. Experimental and Computational-Fluid-Dynamics Simulation of the Outokumpu Flash Smelting Process. Mineral Processing and Extractive Metallurgy Review 15 (1–4):217–34. doi:10.1080/08827509508914200.
- Kalman, H., and E. Matana. 2022. Terminal velocity and drag coefficient for spherical particles. Powder Technology 396:181–90. doi:10.1016/j.powtec.2021.10.053.
- Kannan, B., S. Karthikeyan, and S. Sundararaj. 2017. Comparison of turbulence models in simulating axisymmetric jet flow. In Innovative design and development practices in aerospace and automotive engineering. Lecture notes in mechanical engineering, ed. R. Bajpai and U. Chandrasekhar, 401–408. Singapore: Springer.
- Kanthal Company official webpage Kanthal® APM and Kanthal APMT Fe-Cr-Al Alloys. Accessed October 7, 2021. https://www.kanthal.com/en/products/furnace-products-and-heating-systems/furnace-tubes/kanthal-apm-and-apmt/
- Klipfel, A., M. Founti, K. Zähringer, J. P. Martin, and J. P. Petit. 1998. Numerical simulation and experimental validation of the turbulent combustion and perlite expansion processes in an industrial perlite expansion furnace. Flow, Turbulence and Combustion 60 (3):283–300. doi:10.1023/A:1009900726809.
- Konbul, A., E. M. Ozbayoglu, and C. Mata. 2020. Survival of hollow glass microspheres in drilling fluids applications – Effect of drill bit/formation contact. Journal of Petroleum Science and Engineering 189:106966. doi:10.1016/j.petrol.2020.106966.
- Le Maitre, R., A. Streckeisen, B. Zanettin, M. Le Bas, B. Bonin, and P. Bateman. 2002. Igneous Rocks: A Classification and Glossary of Terms: Recommendations of the International Union of Geological Sciences Subcommission on the Systematics of Igneous Rocks. 2nd ed. Cambridge: Cambridge University Press.
- Leong, G. W., K. H. Mo, Z. P. Loh, and Z. Ibrahim. 2020. Mechanical properties and drying shrinkage of lightweight cementitious composite incorporating perlite microspheres and polypropylene fibers. Construction and Building Materials 246:118410. doi:10.1016/j.conbuildmat.2020.118410.
- Li, D., Y. Tang, X. Zuo, X. Zhao, K. Shang, and H. Yang. 2022. Functionally constructed mineral microspheres for efficient photothermal conversion and thermal energy storage. Carbon 196:365–77. doi:10.1016/j.carbon.2022.05.010.
- Meshram, P., and Abhilash. 2020. Recovery and recycling of cerium from primary and secondary resources- a critical review. Mineral Processing and Extractive Metallurgy Review 41 (4):279–310. doi:10.1080/08827508.2019.1677647.
- Mookherjee, S., A. A. Gadkari, D. M. Deo, and A. Goswami. 1992. Pyrometallurgical Preconcentration Technique for the Recovery of Copper, Nickel and Cobalt from Copper Converter Slag. Mineral Processing and Extractive Metallurgy Review 9 (1):213–22. doi:10.1080/08827509208952706.
- Papanastassiou, D. 1980. Perlite expansion in a vertical furnace- a simplified theoretical analysis. Transactions of the Institution of Mining and Metallurgy Section C Mineral Processing and Extractive Metallurgy 89:C120–24.
- Rallini, M., I. Puri, L. Torre, and M. Natali. 2018. Thermal and ablation properties of EPDM based heat shielding materials modified with density reducer fillers. Composites Part A, Applied Science and Manufacturing 112:71–80. doi:10.1016/j.compositesa.2018.05.031.
- Roulia, M., K. Chassapis, J. A. Kapoutsis, E. I. Kamitsos, and T. Savvidis. 2006. Influence of thermal treatment on the water release and the glassy structure of perlite. Journal of Materials Science 41 (18):5870–81. doi:10.1007/s10853-006-0325-z.
- Scott, N. R., D. L. Stoddard, M. D. Nelms, Z. Wallace, I. Turner, L. Turner, M. Croom, K. Franklin, S. Sandifer, M. S. Ali Al-Fahdi, et al. 2022. Cement and Concrete Research Experimental and computational characterization of glass microsphere-cementitious composites. Cement and Concrete Research 152:106671. doi:10.1016/j.cemconres.2021.106671.
- Shackley, D. 1988. Characterisation and expansion of perlite. United Kingdom: University of Nottingham.
- Shih, T. -H., W. W. Liou, A. Shabbir, Z. Yang, and J. Zhu. 1995. A new k-ε eddy viscosity model for high Reynolds number turbulent flows. Computers & Fluids 24 (3):227–38. doi:10.1016/0045-7930(94)00032-T.
- Song, K., and A. Jokilaakso. 2022. Transport Phenomena in Copper Bath Smelting and Converting Processes–A Review of Experimental and Modeling Studies. Mineral Processing and Extractive Metallurgy Review 43 (1):107–21. doi:10.1080/08827508.2020.1806835.
- Sonti, K. S. M., S. Vincent, and S. K. R. Narala. 2022. Effect of single and hybrid hollow sphere reinforcement on the deformation mechanism of aluminum matrix syntactic foam at a low strain rate. Journal of Alloys and Compounds 901:163573. doi:10.1016/j.jallcom.2021.163573.
- Spoerk, M., J. Sapkota, G. Weingrill, T. Fischinger, F. Arbeiter, and C. Holzer. 2017. Shrinkage and warpage optimization of expanded-perlite-filled polypropylene composites in extrusion-based additive manufacturing. Macromolecular Materials and Engineering 302 (10):1–13. doi:10.1002/mame.201700143.
- Sronsri, C., P. Noisong, and C. Danvirutai. 2017. Thermal decomposition kinetics of Mn0.9Co0.1HPO4·3H2O using experimental-model comparative and thermodynamic studies. Journal of Thermal Analysis and Calorimetry 127 (3):1983–94. doi:10.1007/s10973-016-5720-3.
- Sugash, G., I. S. V. Venkat, M. V. Reddy, S. R. Ali, Sava, and J. H. S. Krishna. 2021. Numerical investigation of combustion characteristics of a four-stroke single cylinder CI engine under various turbulence models. International Journal of Ambient Energy 42 (15):1758–64. doi:10.1080/01430750.2019.1614989.
- Tahmooresi, S., and D. Ahmadyar. 2021. Effects of turbulent schmidt number on CFD simulation of 45 inclined negatively buoyant jets. Environmental Fluid Mechanics 21 (1):39–62. doi:10.1007/s10652-020-09762-6.
- Tatlisu, G. C., C. Aciksari, S. Celebi, and S. Turan. 2022. Developing a hollow glass microsphere/geopolymer thermal insulation composite for hot metal surface coating. Ceramics International 48 (9):11924–39. doi:10.1016/j.ceramint.2022.01.042.
- Vyazovkin, S., A. K. Burnham, J. M. Criado, L. A. Pérez-Maqueda, C. Popescu, and N. Sbirrazzuoli. 2011. ICTAC Kinetics Committee recommendations for performing kinetic computations on thermal analysis data. Thermochimica Acta 520 (1–2):1–19. doi:10.1016/j.tca.2011.03.034.
- Yang, S., X. Zhao, W. Sun, J. Yuan, and Z. Wang. 2019. Effect of ring baffle configuration in a self-priming venturi scrubber using CFD simulations. Particuology 47:63–69. doi:10.1016/j.partic.2019.02.003.
- Zähringer, K., J. P. Martin, and J. P. Petit. 2001. Numerical simulation of bubble growth in expanding perlite. Journal of Materials Science 36 (11):2691–705. doi:10.1023/A:1017960729550.
- Zhou, J., Y. Liu, C. Du, S. Liu, and J. Li. 2018. Numerical study of course coal particle breakage in pneumatic conveying. Particuology 38:204–14. doi:10.1016/j.partic.2017.07.003.