Abstract
Representing concepts and their boundaries is a core task in concept management. We introduce a flexible framework for representing concept boundaries and tessellations through the complete higher order Voronoi diagrams within conceptual spaces. The framework provides different levels of concept granularity modelling vagueness and indeterminacy of concept boundaries, effectively supports complex concepts of multi-pieced regions with holes, and robustly supports concept learning and formation. We also outline a generic data structure that systematically supports our concept management framework. Experimental results demonstrate the robustness and flexibility of the proposed framework.
INTRODUCTION
Concept management is one of the core tasks in artificial intelligence. It involves concept representation, concept formation, concept learning, concept tessellation and categorization, and concept reasoning. In this series of tasks, representing concepts is an initial and central task since it greatly affects subsequent concept management processes. There exist three popular approaches for representing concepts: symbolic representation, conceptual representation, and associationistic representation (particularly connectionistic) (Gärdenfors Citation2000). Symbolic representation provides a high-level abstract representation while associationistic representation offers a low-level detailed representation. Conceptual representation is a midway representation bridging a gap between the too-coarse symbolic representation and the too fine-grained associationistic representation. It builds elementary properties and concepts from the associationistic representation, and feeds geometrically and topologically well-formed concepts to the symbolic representation.
Recently, the importance of conceptual representation has been emphasized and a geometry-equipped conceptual spaces approach has been widely explored (Chella, Frixione, and Gaglio Citation2001a; Gärdenfors and Williams Citation2001; Lagus, Airola, and Creutz Citation2002; Lee Citation2003, Citation2004; Lee and Williams Citation2003). It provides a robust framework for modelling properties and concepts that are core elements for concept management. In conceptual spaces, concept management is simplified by a tessellation of the space. The ordinary Voronoi diagram has been a widely adopted space tessellation method supporting both the nearest neighbor learning (well supported by the machine-learning community, Mitchell Citation1997) and the prototype learning (well supported by the cognitive science community, Gärdenfors Citation2000). Even though it provides a computationally sound data structure, its applicability is limited due to its rigidity and inflexibility. For instance, the ordinary Voronoi diagram does not systematically support complex concepts, indeterminacy of concepts, concept discovery, and concept kerneling.
In this article, we introduce a flexible space tessellation approach through the complete order-k Voronoi diagrams (OkVD) for systematic concept management within conceptual spaces. They extend the ordinary Voronoi diagram to a higher order in order to overcome its drawbacks. We propose a generic data structure to efficiently and effectively support the complete order-k Voronoi diagrams (from order-1 to order-(n − 1), where n is the number of objects). The proposed approach systematically support the following concept management capabilities:
Modelling indeterminacy and fuzzy membership of concepts; | |||||
Modelling complex concepts and properties with multi-pieced regions and holes; | |||||
Modelling concepts and properties with a null region; | |||||
Kerneling concepts and properties; | |||||
Categorization and concept learning; | |||||
Concept discovery and formulation; | |||||
CONCEPTUAL SPACES AND CONCEPT TESSELLATIONS
A conceptual space is seen as a collection of one or more domains and each domain consists of a number of quality dimensions. Objects are identified with multi-dimensional points (also called knoxel, Chella, Frixione, and Gaglio Citation2001a) within conceptual spaces, and quality dimensions represent “qualities” of an object. Each quality dimension is endowed with certain geometrical, topological, or ordering structures. A set of quality dimensions are integral and form a domain if an object cannot be assigned a value in one dimension without assigning values to others; otherwise they are separable. For instance, dimension hue, chromaticity, and brightness are integral and considered as a color domain. A set of integral dimensions are used to represent properties and a set of separable domains are used to represent concepts. A property is a region in a domain and a concept is a set of properties and their relationships within conceptual spaces. It is well known that similarity plays a key role in many cognitive tasks such as concept acquisition, formation, learning, and categorization. Conceptual spaces are geometric representations of concepts and similarity is measured by a distance metric. Similarity is measured by the Euclidean metric in intradomains while it is measured by the Manhattan metric in interdomains (Gärdenfors Citation2000). Recently, the conceptual spaces-based framework has been used in various applications including computer vision (Chella, Frixione, and Gaglio Citation2001a), cluster reasoning (Lee and Williams Citation2003), representing dynamic actions (Chella, Frixione, and Gaglio Citation2001b), and conceptual similarities of verbs (Lagus, Airola, and Creutz Citation2002). In addition, managing concepts and categories in data-rich environments has been studied (Gärdenfors and Williams Citation2001). Details of conceptual spaces can be found in Gärdenfors (Citation2000).
In conceptual spaces, objects are represented by multi-dimensional points and a concept is formulated by a set of exemplars (previously categorized examples of objects in the concept). Therefore, representing a concept is equivalent to representing a set of exemplars. Representing a set of multi-dimensional points is typically achieved by the following two methods in conceptual spaces: a Voronoi diagram of individual (VoI) vs. a Voronoi diagram of prototype (VoP). Figure depicts VoI and VoP tessellations of six examples, where three examples P 1 = {p 1, p 2, p 3} form a concept and the other three P 2 = {p 4, p 5, p 6} form another concept. Concept boundaries that distinguish these two concepts are shown as thick black polylines in this figure. In these two approaches, concepts are mutually exclusive and collectively exhaustive. These concept boundaries define regions of properties and concepts, and regionalize exemplars. They can be used for concept categorization, concept formation, and learning. Even though these two have been dominant approaches for concept tessellation and management within conceptual spaces, they suffer from several drawbacks. First, these two approaches are rigid-defining, crisp concept boundaries and regions; they are not able to represent indeterminacy of concept. Second, these two Voronoi approaches generate space tessellations that do not define any regions for a new concept; thus it is difficult for them to discover and formulate a new concept. They are able to support concept growth, but not well-suited for concept discovery and formation. Third, due to the simplicity employed in these two approaches, they do not support well for complex concepts with multi-pieced regions and null regions. Fourth, they themselves do not provide a systematic approach for concept kerneling. Table summarizes concept management processes supported by VoI, VoP, and OkVD.
FIGURE 1 VoI and VoP tessellations of P = {p 1, p 2, p 3, p 4, p 5, p 6}: (a) VOI(P); (b) VOP(P) with prototypes in red squares.
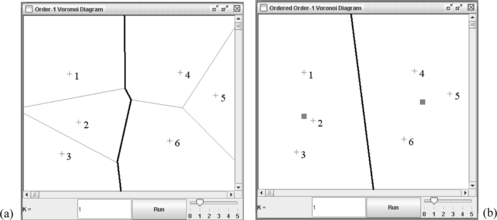
TABLE 1 Comparison of VoI and VoP for Concept Management
CONCEPT MANAGEMENT WITH THE COMPLETE ORDER-k VORONOI DIAGRAMS
Concept Boundaries and Tessellations
The ordinary Voronoi diagram tessellates the space in such a way that every location in the space is assigned to the closest generator. A set of locations closest to more than one generator formulates the ordinary Voronoi diagram consisting of Voronoi edges and vertices. Order-k Voronoi diagrams are natural and useful extensions of the ordinary Voronoi diagram to more than one generator (Okabe, Boots, Sugihara, and Chiu Citation2000). They provide tessellations where each region has the same k unordered closest sites for a given k. The order-k Voronoi diagram (k) is a set of all order-k Voronoi regions where the order-k Voronoi region
for a random subset
consisting of k points out of P, is defined as follows:
When k generators are ordered, the diagram becomes the ordered order-k Voronoi diagram 〈k〉. It is defined as , where the ordered order-k Voronoi region
is defined as:
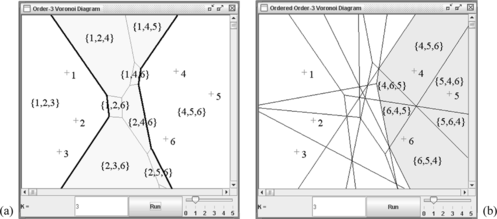
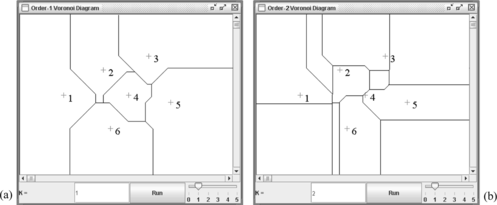
Figure depicts the order-3 Voronoi diagram and ordered order-3 Voronoi diagram of P. A region in Figure (a) depicts an order-3 Voronoi region of P
1 where all generators belong to the same concept. Thus, this region is indicative of the concept P
1. Its neighboring regions (that share a Voronoi edge with
) are Voronoi regions of {p
1, p
2, p
4}, {p
1, p
2, p
6}, and {p
2, p
3, p
6}. These neighboring regions have members that belong to different concepts. For instance, the Voronoi region of {p
1, p
2, p
4} has members p
1, p
2 belonging to the concept P
1 and a member p
4 belonging to the concept P
2. Thus, this region shows a degree of membership (fuzzy membership) and it is indicative of a neutral zone that can be used for discovering and learning a new concept. The order-3 Voronoi region is further decomposed and modelled in a much finer form by the ordered order-3 Voronoi diagram as shown in Figure (b). That is, it is further decomposed into 3! number of regions in the ordered order-3 Voronoi diagram. This ordered diagram provides richer information at the expense of complexity.
FIGURE 2 The order-3 Voronoi diagram and ordered order-3 Voronoi diagram of P (P is the same as in Figure 1): (a) (3)(P); (b) 〈3〉(P).
Definitions
Definition 1
Given a set P = {p 1, p 2,…, p n } of exemplars forming a set = {C 1, C 2,…, C k } of concepts, the kth concept region of C i ∊ (denoted by ℑ(k) C i ) is defined by a union of all order-k Voronoi regions whose generators (member points) all belong to the same concept C i . It is formally defined as follows:
Definition 2
Given a set P = {p 1, p 2,…, p n } of exemplars forming a set = {C 1, C 2,…, C k } of concepts, the kth neutral zone of (denoted by ℘(k)) is defined by a union of all order-k Voronoi regions whose generators do not belong to the same concept. It is formally defined as follows:
in ℑ(k)
C
i
exhibits a total membership of
to C
i
constituting a concept kernel of C
i
while
in ℘(k) shows a partial and degree of membership.
Definition 3
Given an order-k Voronoi region V(P (k)) in ℘(k), the degree of membership of V(P (k)) to a concept C j is defined as follows:
For any C i and C j ∊ , ℑ(k) C i and ℑ(k) C j are mutually exclusive, and a union of ∪∀C i ℑ(k) C i and ℘(k) is collectively exhaustive. Solid thick black polylines in Figure (a) define concept boundaries, and a yellow shaded region representing a neutral zone separates the two concept regions.
Concept Management
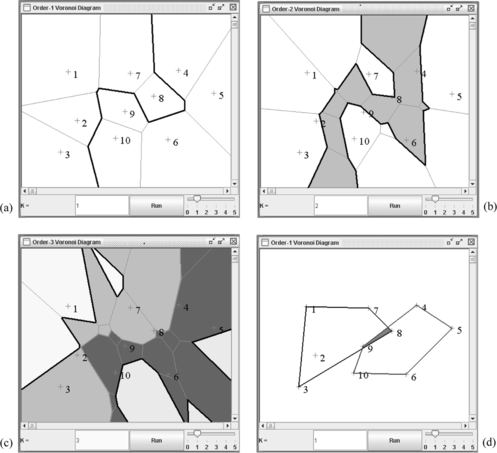
Once concept regions and neutral zones are defined, concept management becomes a series of processes of manipulating concept regions and neutral zones. Concept categorization in conceptual spaces is equivalent to tessellating concepts (Gärdenfors and Williams Citation2001). Both ℑ(k) C i and ℘(k) are able to model concept growth, and are used for concept learning, concept discovery, and concept formation. When a new instance p is given, it will fall into one of the regions in ℑ(k) C i and ℘(k) since OkVD produces a tessellation. When it falls within a certain concept region, the concept region will grow. When it falls within the neutral zone, it is suggestive of a new possible concept depending on the context. Figure displays order-k concept regions and neutral zones, and explains the working principle of concept management. Figure (a) shows order-1 concept boundaries of P = {p 1, p 2,…, p 10} forming two concepts P 1 = {p 1, p 2, p 3, p 7, p 8} and P 2 = {p 4, p 5, p 6, p 9, p 10}. Concepts are of arbitrary shape and they are not necessarily connected. Figure (b) defines ℑ(2) P 1 and ℑ(2) P 2, and the second-order neutral zone ℘(2) (grey-shaded). Similarly, Figure (c) defines the third-order concept regions and neutral zone. In this example, ℘(3) is shaded in two different colors: one light grey neutral zone indicating a region more influenced by the concept P 1 (2/3 from P 1 and 1/3 from P 2) and one dark grey neutral zone indicating a region more influenced by the concept P 2 (1/3 from P 1 and 2/3 from P 2). Also, it is seen from the figure that ℑ(3) C i is disconnected. As k increases, the neutral zone grows while concept regions shrink. This implies that higher k values tend to define tighter concept regions defining strongly coupled concept kernels and wider neutral zones. Concept kerneling is a process of defining a subset of concept region that exhibits strong intraconcept interactions. Concept kernels represent pure concept regions. A new instance falling into a certain concept kernel strongly suggests that the new instance belongs to the concept. Concept kernels are used for concept reasoning (Gärdenfors and Williams Citation2001) typically with well-defined, region-based reasoning approaches such as region connection calculus (RCC) (Cohn, Bennett, Gooday, and Gotts Citation1997). Figure (d) shows a typical approach for concept kerneling within conceptual spaces using convex hulls (O'Rourke Citation1993). One major problem with this approach is that kernels may overlap, which becomes problematic in concept learning and categorization. This unwanted kernel overlapping is avoided in our approach. Concept regions are hardened as k grows and they are mutually exclusive in all cases. A series of figures in Figure illustrates the working principle of our approach, and demonstrates our proposed framework's capabilities for indeterminate concept representation, concept kerneling, concept learning and categorization, complex concept representation, and concept discovery and formation. In addition, a series of different values of k provides a complete set of indeterminate (vague) concept boundaries and regions, which can model geospatial uncertainty. Our framework provides an interactive environment that enables an agent (a user) to choose the most suitable value k for a given task. The following subsection describes how this is achieved through a generic Delaunay triangle data structure.
FIGURE 3 Concept management with OkVD of P = {p 1, p 2,…, p 10} forming two concepts P 1 = {p 1, p 2, p 3, p 7, p 8} and P 2 = {p 4, p 5, p 6, p 9, p 10}: (a) a concept tessellation defined by O1VD; (b) a concept tessellation defined by O2VD; (c) a concept tessellation defined by O3VD; and (d) concept kerneling with convex hulls.
Data Structure
Several algorithmic approaches (Aurenhammer and Schwarzkopf Citation1991; Chazelle and Edelsbrunner Citation1987; Dehne Citation1983; Lee Citation1982) have been proposed to efficiently compute higher order diagrams in the computational geometry community. Dehne (Citation1983) proposed an O(n 4) time algorithm that constructs the complete (k). Several other attempts (Aurenhammer and Schwarzkopf Citation1991, Chazelle and Edelsbrunner Citation1987; Lee Citation1982; Lee and Lee Citation2009) have been made to improve the computational time requirement of Dehne's algorithm. These approaches simply compute higher order diagrams, but they do not provide underlying data structures that can support interactivity and many geospatial topological queries. The best-known algorithm for the order-k Voronoi diagram is O(k(n − k)log n + n log3 n) (Berg, Kreveld, Overmars, and Schwarzkopf Citation2000). Thus, the complete (k) requires O(n 3 log n + n log3 n) time.
Our data structure develops Dehne's structure (Citation1983) and builds the entire order of Delaunay triangles. It is based on the combination of two tables: generator list and triangle lists, which is similar to the triangle-based data structure (Dehne Citation1983). The generator list is a table of points containing the x, y coordinate with a unique identification number. The triangle lists are tables of triangles, each with three vertices, a circumcircle center point, and a list of generator identifications lying within the circumcircle.
In the unified data structure, the triangles are assigned to the triangle table based on the number of generators that are lying within the circumcircle for this triangle. These triangles are referred to as order-k triangles, where k is the number of generators within the circumcircle of this triangle. Table depicts the assignment of triangles shown in Figure . The triangle ▵p 1 p 2 p 5 does not contain any other points in its circumcircle; thus it is an order-0 triangle. On the other hand, ▵p 1 p 2 p 4 contains one point (p 5) within its circumcircle; thus it is an order-1 triangle. In a similar way, ▵p 1 p 2 p 3 contains two points (p 4, p 5) within its circumcircle, thus it is an order-2 triangle.
FIGURE 4 Circumcircles and data structure for the complete order-k Voronoi diagrams: (a) Order-0 triangles; (b) Order-1 triangles; (c) Order-2 triangles.
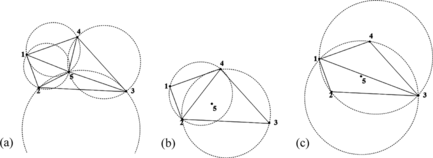
TABLE 2 Complete Order- k Delaunay Triangle Data Structure
Derivation of the complete order-k Voronoi diagrams from the unified data structure basically follows the Dehne' rule (Citation1983)—(k) is derived from the combination of both order-(k − 1) and order-(k − 2) triangles. That is, (1) is derived from the order-0 triangle list while (2) is derived from the order-0 and order-1 triangle lists. Therefore, triangle lists need to be indexed and need not to be exhaustively searched. Once the complete (k) is computed, 〈k〉 is computed by 〈k〉 = ∪(k). This step requires O(n 3 log n) time with an indexing data structure support.
INTERDOMAIN CONCEPT MANAGEMENT
In conceptual spaces, a concept consists of at least one domain. Concepts may have multiple domains and the Manhattan metric is used for interdomain dissimilarity measure (Gärdenfors Citation2000; Okabe, Boots, Sugihara, and Chiu Citation2000). Our framework supports this higher-order domain and interdomain concept management. Figure shows O1VD and O2VD of P (the same as in Figure ) in the Manhattan metric. These diagrams model interdomain interactions and support interdomain concept management.
FIGURE 5 Interdomain tessellations and concept management (P is the same is in Figure ): (a) O1VD of P in the Manhattan metric; (b) O2VD of P in the Manhattan metric.
GEOSPATIAL CONCEPT MANAGEMENT CASE STUDIES
Geospatial concept management is an important issue in geospatial data mining and knowledge discovery (Miller and Han Citation2001). This section provides two case studies of geospatial concept management with real datasets.
Case Study with Well-Separated Concepts
In this case study, real geospatial datasets from Brisbane, the capital city of Queensland, Australia are considered. We utilize raw crime and geospatial feature datasets recorded in the years 1996 and 1998 by the Queensland Police Service around 217 central urban suburbs of Brisbane as our study region. Brisbane is continuously experiencing steady population and crime growth. Building crime-related concepts in this region provides a valuable resource to city planners, policing agencies, and criminologists.
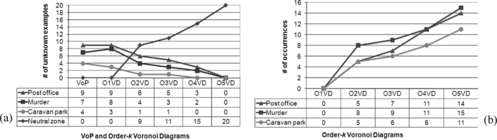
Figure depicts a dataset consisting of 4 different geospatial concepts: post office ({p 3,…, p 7}), murder ({p 8,…, p 12}), caravan park ({p 13,…, p 17}) and unknown crime type ({p 18, p 19,…, p 36, p 37}). Each concept is geospatially correlated and aggregated. That is, each concept is represented by a set of regions in conceptual spaces. Locations of post offices, murder incidents, and caravan parks are recorded in the year 1996, and locations of unknown crime type (later turned out to be offenses against property) are recorded in the year 1998. In this scenario, we build the higher-order Voronoi diagrams inspired concept boundaries and use them for learning the unknown crime incidents. First, we build concept regions (boundaries) of the three known concepts: post office, murder, and caravan park. The concept regions of O1VD and O5VD are superimposed in Figure (b). As k becomes larger, the neutral zone widens. The neutral zone grey shaded and boundarized by thick black polylines defines ℑ(5) C i and ℘(5) while thick white polylines within ℘(5) defines ℘(1). Table summarizes learning of 20 unknown objects with the complete higher-order Voronoi diagrams.
FIGURE 6 A study region with dataset I, P = {p 3, p 4,…, p 36, p 37}: (a) a study region with exemplars and unknown objects; (b) concept boundaries defined by O1VD and O5VD.
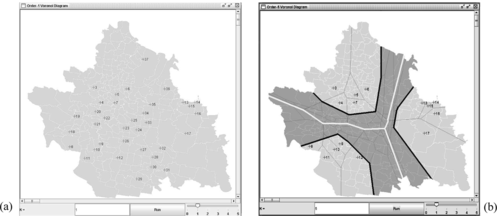
TABLE 3 Conceptualization of Dataset I with the Complete Higher-Order Voronoi Diagrams: m Denotes Murder, p Denotes Post Office, c Denotes Caravan Park, and Superscript Denotes Frequency
Undoubtedly, VoI and VoP (Figure and Table ) assign all unknown objects to one of existing concepts, and fail to form a new concept. Concept discovery and formation is much improved with the use of the order-2 Voronoi diagram. With the order-3, order-4, and order-5 Voronoi diagrams, more than half of unknown objects fall into the neutral zone that may trigger a new concept formation based on the majority voting (Kuncheva Citation2004). This trend is well depicted in Figure (a). The number of unknown objects misconceptualized into one of existing concepts is gradually decreasing as k grows while the number of objects falling into the neutral zone is constantly increasing. Figure (b) depicts the number of occurrences of each object in the neutral zone. Generally, they grow as k increases. In this particular case, more numbers of misconceptualized post office and murder occurrences are observed than the number of misconceptualized caravan park occurrences. This means that unknown crime instances conceptualized into the caravan park concept are relatively closely coupled with the caravan park exemplars.
FIGURE 7 Trends of dataset I: (a) conceptualization distribution; (b) occurrences in the neutral zone.
Case Study with Multi-Pieced Concepts
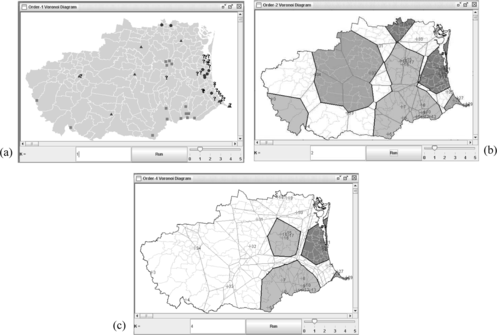
This case study illustrates complex concepts with different sizes and multi-pieced regions. The second dataset consists of three geospatial concepts recorded in the year 1996, and a set of unknown geospatial features recorded in the year 1997 in a study area of 209 suburban Gold Coast region, south of Brisbane. The dataset includes 15 national park exemplars (shown in rectangles in Figure (a)) mainly distributed in the southern part of the study region, 11 post office exemplars (shown in triangles in Figure (b)), widely distributed all over the study region, and eight college exemplars (shown in circles in Figure (c)) mainly distributed along the coast. A set of 25 unknown objects in the study region has been recorded in the following year (shown in question marks in Figure (c)). Different from dataset I, geospatial concepts in this case study are not well separated and are composed of multi-pieced regions. Figure (b) shows an O2VD concept tessellation of Q, while Figure (c) exhibits an O4VD concept tessellation of Q.
FIGURE 8 A study region with dataset II, Q(|Q| = 59): (a) a study region with exemplars and unknown objects; (b) concept boundaries defined by the 2-order Voronoi diagram; and (c) concept boundaries defined by the 4-order Voronoi diagram.
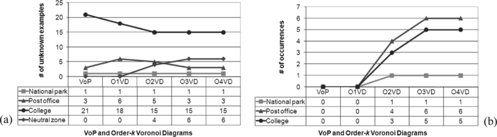
Since data are not well-separated but widely distributed, experiments are conducted up to the O4VD tessellation. Undoubtedly, Figure (a) shows an increasing trend in the number of new objects falling into the neutral zone as k increases. One thing to note here is that numbers of misconceptualized objects into concepts are not always decreasing. The number of unknown examples conceptualized to the national park concept remains constant and the number of unknown examples conceptualized to the college concept remains unchanged after an initial drop at the O2VD concept tessellation. This implies that unknown examples conceptualized to the college concept are tightly coupled (geospatially closely located) with the college exemplars. Figure (b) shows occurrences of unknown objects in the neutral zone. As k increases, there is a sudden jump in numbers of occurrences of misconceptualized post office and college instances in the neutral zone particularly from the O1VD concept tessellation to the O3VD concept tessellation. Notably, the post office concept is gaining more attention from the O1VD concept tessellation to the O2VD concept tessellation (losing 1 but gaining 3), while the college concept is gaining more attention from the O2VD concept tessellation to the O3VD concept tessellation (losing nothing but gaining 2). This example demonstrates that our proposed approach provides a robust framework for managing complex concepts.
FIGURE 9 Trends of dataset II: (a) conceptualization distribution; (b) occurrences in the neutral zone.
CONCLUSIONS
The Voronoi diagram provides a cognitively economical way of representing information about concepts (Gärdenfors Citation2000). VoI and VoP have been two popular approaches for representing concepts in conceptual spaces. In this article, we provide a flexible concept tessellation framework overcoming the rigidity and inflexibility of traditional approaches. It is based on the complete higher order Voronoi diagrams and robustly supports various concept management processes. We also develop a generic unified data structure that interactively supports our concept management framework. The OkVD approach is inclusive of VoI and VoP, and is offering extra functionality for various concept management. Experimental results with real geospatial datasets demonstrate robustness and superiority of our approach over traditional approaches.
As geospatial concepts become complex, scalability to higher domain conceptual spaces is of interest. Computational efficiency is of another interest as geospatial data grow at an unprecedented rate. Automatic detection of interesting patterns within conceptual spaces will help an agent effectively manage concepts. Future work is to adopt and develop data mining techniques to improve our proposed framework more scalable, efficient, and intelligent.
DECLARATION OF INTEREST
The author declares no conflict of interest.
REFERENCES
- Aurenhammer , F. and O. Schwarzkopf . 1991 . A simple on-line randomized incremental algorithm for computing higher order Voronoi diagrams . In: Proceedings of the Symposium on Computational Geometry . North Conway , NH , pp. 142 – 151 . New York : ACM Press .
- Berg , M. D. , M. J. V. Kreveld , M. H. Overmars , and O. Schwarzkopf . 2000 . Computational Geometry: Algorithms and Applications, , 2nd ed. Heidelberg, Berlin : Springer-Verlag .
- Chazelle , B. and H. Edelsbrunner . 1987 . An improved algorithm for constructing kth-order Voronoi diagrams . IEEE Transactions on Computers 36 ( 11 ): 1349 – 1354 .
- Chella , A. , M. Frixione , and S. Gaglio . 2001a . Conceptual spaces for computer vision representations . Artificial Intelligence Review 16 ( 2 ): 137 – 152 .
- Chella , A. , M. Frixione , and S. Gaglio . 2001b . Symbolic and conceptual representation of dynamic scenes: Interpreting situation calculus on conceptual spaces . In: Proceedings of the 7th Congress of the Italian Association for Artificial Intelligence , ed. F. Esposito , Lecture Notes in Computer Science 2175 . Bari , Italy , pp. 333 – 343 . Heidelberg, Berlin : Springer .
- Cohn , A. G. , B. Bennett , J. Gooday , and N. M. Gotts . 1997 . Qualitative spatial representation and reasoning with the region connection calculus . GeoInformatica 1 ( 3 ): 275 – 316 .
- Dehne , F. K. H. 1983 . On O(N 4) algorithm to construct all Voronoi diagrams for K-nearest neighbor searching in the Euclidean plane . In: Proceedings of the International Colloquium on Automata, Languages and Programming , ed. J. Díaz , Lecture Notes in Artificial Intelligence 154 . Barcelona, Spain , pp. 160 – 172 . Heidelberg, Berlin : Springer .
- Gärdenfors , P. 2000. Conceptual Spaces: The Geometry of Thought . Cambridge : The MIT Press.
- Gärdenfors , P. and M.-A. Williams . 2001 . Reasoning about categories in conceptual spaces . In: Proceedings of the 17th International Joint Conference on Artificial Intelligence , ed. B. Nebel , Washington, D.C. , pp. 385 – 392 . San Francisco : Morgan Kaufmann .
- Kuncheva , L. I. 2004 . Combining Pattern Classifier: Methods and Algorithms . Hoboken , New Jersey : Wiley .
- Lagus , K. , A. Airola , and M. Creutz . 2002 . Data analysis of conceptual similarities of Finnish verbs . In: Proceedings of the 24th Annual Meeting of the Cognitive Science Society , Fair Fax , Virginia , pp. 566 – 571 .
- Lee , D.-T. 1982 . On k-nearest neighbor Voronoi diagrams in the plane . IEEE Transactions on Computers 31 ( 6 ): 478 – 487 .
- Lee , I. 2003 . Fast qualitative reasoning about categories in conceptual spaces . In: Proceedings of the Third International Conference on Hybrid Intelligent Systems , eds. A. Abraham , M. Köppen , and K. Franke , Melbourne, Australia , pp. 341 – 350 . Amsterdam : IOS Press .
- Lee , I. 2004 . Efficient management of conceptual spaces using data mining techniques . In: Proceedings of the 2004 International Conference on Computational Intelligence for Modelling Control and Automation , ed. M. Mohammadian , Gold Coast , Australia , pp. 492 – 499 .
- Lee , I. and K. Lee . 2009 . A generic triangle-based data structure of the complete set of higher order Voronoi diagrams for emergency management . Computers, Environments & Urban Systems 33 ( 2 ): 90 – 99 .
- Lee , I. and M.-A. Williams . 2003 . Multi-level clustering and reasoning about its clusters using region connection calculus . In: Proceedings of the 7th Pacific-Asia Conference on Knowledge Discovery and Data Mining , eds. K.-Y. Whang , J. Jeon , K. Shim , and J. Srivastava , Lecture Notes in Artificial Intelligence 2637 . Seoul, Korea , pp. 283 – 294 . Heidelberg, Berlin : Springer .
- Miller , H. J. and J. Han . 2001 . Geographic Data Mining and Knowledge Discovery: An Overview . Cambridge , UK : Cambridge University Press .
- Mitchell , T. M. ( 1997 ). Machine Learning . New York : WCB/McGraw-Hill .
- Okabe , A. , B. N. Boots , K. Sugihara , and S. N. Chiu . 2000 . Spatial Tessellations: Concepts and Applications of Voronoi Diagrams, , 2nd ed. West Sussex : John Wiley & Sons .
- O'Rourke , J. ( 1993 ). Computational Geometry in C . New York : Cambridge University Press .