
Abstract
Case-based reasoning (CBR) solves a problem through retrieving a similar past solution and reusing it in a new situation. In this study, a CBR system was developed for marketing mix planning (MMP) in a steel manufacturing company. In case retrieval, feature weighting is an important component and plays a key role in CBR efficiency. In recent years, several methods have been presented for feature weighting, which have used retrieval accuracy only for performance ranking of weighting methods and ignored other method dimensions. In order to consider other dimensions for weighting method ranking, this study applied a fuzzy AHP method to prioritize weighting methods. In this study, genetic algorithm (GA), rough set theory (RST) and fuzzy inference system (FIS) were used for feature weighting. Moreover, feature weighting based on FIS was introduced in this work for the first time.
INTRODUCTION
In recent years, there has been an increasing interest in customer knowledge management and customer relationship management (Ngai, Xiu, and Chau Citation2009; Bae and Kim Citation2010; Liao et al. Citation2013). Marketing managers have strongly understood the importance of customer knowledge. Therefore, having an effective method for analyzing customer knowledge is a critical issue (Liao and Chen Citation2004; Liao, Chen, and Hsieh Citation2011). In addition, it could be intuitively expected that customer knowledge could improve business performance (Johnson, Clark, and Barczak Citation2012). For example, by marketing mix planning (MMP) according to customer conditions, marketing mangers are able to build promising relationships with customers.
MMP is the main process of marketing and could include a variety of risks (Naik, Raman, and Winer Citation2005; Bu and Zhang Citation2013). For example, companies spend millions of dollars on promotion programs and expect to increase their sales and market share (Naik, Raman, and Winer Citation2005). Each customer has his/her own needs and conditions; so, marketing managers should develop marketing mix programs based on their circumstances. Marketing managers should consume much time on examining and reviewing customer information in order to create a marketing mix plan that satisfies customer conditions. Hence, it is not cost effective for marketing managers to repeat their tasks for similar customers. Nevertheless, insufficient efforts have been dedicated to IT-based MMP, and case-based reasoning (CBR) has been not developed for MMP, especially in business to business (B2B) domain. Therefore, this work designed a CBR system.
Despite many advantages of CBR, in order to design and develop an effective CBR system, there are some limitations that must be determined through the following questions: (1) how to determine the weight of each feature, which is known as feature weighting (Ahn and Kim Citation2008; Vukovic et al. Citation2012); and (2) how to select a feature weighting system.
Recently, researchers have shown an increasing interest in feature weighting (e.g., Hsu et al. Citation2011; Ji, Zhu, and Huang Citation2012; Gunawardena, Weber, and Stoyanovich Citation2013; Wang, Sun, and Shen Citation2013; Han, Li, and Cao Citation2014; Smiti and Elouedi Citation2014). Most studies on feature weighting have been carried out only for measuring retrieval accuracy as a performance measure. Among the numerous works conducted on the weighting system, there is no study on comparing of weighting method. Moreover, the vast majority of research on feature weighting has focused on introducing different methods and techniques. In fact, method selection as a separate process is seldom considered in general studies of feature weighting.
Therefore, the main issues addressed in this study were (1) applying CBR to MMP, (2) implementing a genetic algorithm (GA) and rough set theory (RST) as a feature weighting method, (3) developing fuzzy inference system (FIS) for feature weighting based on customer conditions and (4) applying fuzzy analytic hierarchy process (AHP) for weighting method selection.
The rest of this article is organized as follows. “Literature Survey” reviews prior studies, and “Development of the CBR System” proposes a CBR system for MMP and weighting methods based on GA, RST, and FIS. “Fuzzy AHP for Weighting System Selection” presents a fuzzy AHP model to select a weighting system. In the final section, conclusions of this study are presented.
LITERATURE SURVEY
CBR and Marketing
Although extensive research has been performed to develop different types of CBR systems in order to assist marketing and sales processes, no single study exists that adequately covers MMP (). Recent studies have highlighted the importance of more intelligent marketing process (Martínez-López and Casillas Citation2013). But, significant gaps exist in the literature with respect to the formalized marketing intelligence (Wierenga Citation2010). Therefore, this study focused on development of CBR for MMP in B2B environments in terms of making the marketing process more intelligent and cost effective.
TABLE 1 CBR Studies in Marketing and Sales Domain
Feature Weighting System
CBR applies experience and stored knowledge to a new case and is similar to decision-making of human beings (Li and Sun Citation2008; Ahn and Kim Citation2009a). The most important phase in CBR is case retrieval and its performance is absolutely associated with retrieval phase. Retrieval phase indentifies the nearest solution or case to current problem using a method, called nearest neighbor matching. As a result, it is very important to formulate an effective retrieval system (Ahn and Kim Citation2009a).
In CBR, cases are generally represented by features. Different features have different importance, which are often described by weights. So, how to assign weights of different features is a very key issue in CBR, which directly impacts quality and performance of case retrieval.
In contrast to optimization of feature selection, optimized feature weights could obtained extremely accurate results (Ahn and Kim Citation2009b). In this regard, many feature weighting methods have been proposed to determine weight vector (e.g., Lee and Ha Citation2009; Ahn, Kim, and Han Citation2006a,Citationb; Wettschereck, Aha, and Mohri Citation1997).
Most studies on feature weighting have used GA as the main heuristic method for determining weight vector. Shin and Han (Citation1999) have calculated weight vector using GA for case retrieval in corporate bond rating problem. Classification accuracy and performance of their CBR system (75.5 %) were more than other related works. They focused only on GA to optimize CBR system. Chiu (Citation2002) presented weighting system based on GA to classify clients in insurance sector. He suggested a GA approach to compute weight vector for increasing prediction accuracy. This weighting system showed better performance (65%) than the regression model. Kim (Citation2004) proposed Simultaneous Optimization using the GA for CBR (SOCBR) for improving CBR prediction accuracy in financial forecasting. He compared its result with three GA models. Results were demonstrated that SOCBR achieves better predictive performance (60.76%) than other methods. Hsu, Chiu, and Hsu (Citation2004) used GA to calculate two-level weights of CBR for forecasting success of information system outsourcing. The proposed weighting system achieved better results than the regression model and equal weighting method. Moreover, Fu and Shen (Citation2004) also used a GA method for feature weighting in a Q and A system. Chang, Lai, and Lai (Citation2006) developed a CBR-GA system for a wholesaler’s returning book forecasting. They that indicated the system forecast ability would increase under the CBR-GA method when the number of reference cases increased. Additionally, Ahn, Kim, and Han (Citation2006a,Citationb) have used GA for CBR improvement in customer classification. Their studies optimized feature weights and instance selection concurrently. Im and Park (Citation2007) integrated neural network system and CBR for personalization. Ahn, Kim, and Han (Citation2007) presented another work on feature weighting and achieved suitable (64%) accuracy in customer classification. Yuan and Chiu (Citation2009) utilized a GA mechanism to facilitate weighting all of levels in balanced scorecard. The mean absolute error (MAE) of their method was 0.0322. Ahn and Kim (Citation2009b) applied a GA method for feature weighting as well for a breast cytology diagnosis problem. The GA chromosome of this work comprised feature weight, instance selection, and number of neighbors. They obtained excellent prediction accuracy (99.12%). This result is greater than all aforementioned results. Moreover, Lin et al. (Citation2009) introduced a hybrid weighting system for business failure prediction. They used grey relational analysis (GRA) and RST for improving case retrieval. This weighting system showed considerable performance (83.3%). Hsu et al. (Citation2011) developed a classification approach based on the hybrid use of CBR and GA for hypertension detection using anthropometric body surface scanning data. Its performance accuracy was 92.8. Furthermore, Liu and Chen (Citation2012) utilized simple correlation based attribute weighting (CFW) for weighting in a due date assignment (DDA) problem. They showed improvement with root mean square error (RMSE).
Nevertheless, a considerable amount of literature has been published on the rough set approach for feature weighting in a CBR system. Tao and Huizhang (Citation2006) proposed a feature weighting method using RST. They applied a similarity-based indiscernibility matrix, which was used to calculate attribute weights. Jiang, Chen, and Ruan (Citation2006) presented a new weighting system that used RST for feature weighting. They applied CBR for a tool selection problem. Dong et al. (Citation2009) utilized a fuzzy RST in feature reduction and weight allocation. In addition, Xu et al. (Citation2009) developed an algorithm for weight determination based on RST. Deng et al. (Citation2010) implemented RST to carry out automatic calculation of feature weights. Moreover, Ji, Zhu, and Huang (Citation2012) combined AHP with RST for feature weighting in mechanical products design. Wang, Wang, and Wang (Citation2012) examined rough set for feature importance computation. Han et al. (Citation2013) presented an algorithm to compute attributes weight based on improved Bayesian rough set model. Other feature weighting studies in CBR are Gunawardena et al. (Citation2013) and Wang et al. (Citation2013). Therefore, due to the extensive research on GA and RST, they were selected for feature weighting. GA and RST find weight vector regardless of case condition. Hence, an FIS was originated for feature weighting based on case condition.
Although extensive research has been carried out on weighting problems, no comparison has been made among weighting methods. Particularly, one question that needs to be asked is how to select the best of those weighting methods. However, none of the previously mentioned methods have attempted to differentiate between various dimensions of weighting methods, and no single study has found the one that adequately covers selection and evaluation of weighting method.
Also, in weighting studies, only an accuracy metric is used for performance measurement and comparison. One of the limitations of accuracy is that it does not consider implementation perspectives of a weighting system.
Accordingly, the contribution of this study is threefold: (1) development of a CBR system for MMP; (2) introduction of an FIS to compute feature weights, and (3) addressing fuzzy AHP to allow the comparison and selection of the best weighting system.
DEVELOPMENT OF THE CBR SYSTEM
Data Collection and Preprocessing
Approximately 300 historical customer profiles were obtained from a well-known steel manufacturing company in Iran. However, due to the noisy, incomplete, and inconsistent customer information, thorough examination of the data yielded just 220 full customer cases. Some of the customer profiles might incorporate no benefits or lesson-learned knowledge relating to subsequent reuse. However, many customer interactions with valuable nuggets might be left out just because of not being well kept or documented in the sustainable marketing and sale management system for subsequent knowledge discovery process, leading to organizational losses. A relational database was created to accommodate the aforementioned information extracted from sales forces or marketing reports in a data table format based on the principles of entity relationship data modeling and normalization.
Case Representation
The first step of CBR design is case representation. In this work, cases were comprised of customer and marketing knowledge and were divided to problem part and marketing-mix part. Problem part or case description included customer sector, product usage, customer image and liability, customer credit, order amount, customer strengths, and other customer features (e.g., geographical situation; see ; Li and Sun Citation2009). The marketing mix part included product, promotion strategy, relationship policy, pricing strategy, meeting and proposal points, packaging, delivery (). Sample cases or datasets are described in .
TABLE 2 Input Features of the CBR System
CBR Design, Analysis, and Implementation
The system architecture is depicted in . After a new customer profile is entered, the CBR system will retrieve the three most similar cases from the case base. Then the marketing expert selects one of the retrieved cases, revises the proposed marketing mix, and uses it for a new customer. A key feature of the proposed system is its ability to provide users with solutions using different weighting techniques as well as the ability to easily change the weight vector. However, a major advantage of this CBR system is that it permits the user to select the weighting method for the optimal MMP problem.
TABLE 3 Output Features of the CBR System
TABLE 4 Sample Dataset
FIGURE 1 CBR system architecture.
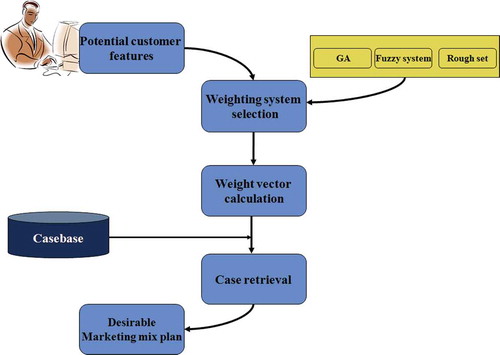
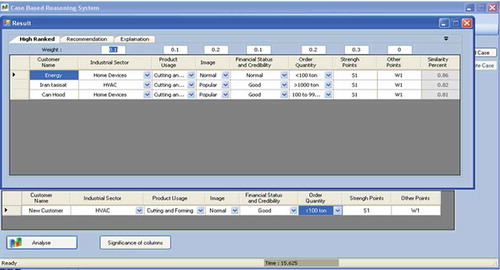
The proposed system was implemented in a Windows-based framework. The procedures involved in developing a Windows-based prototype system included system architecture setup, adoption of application programs, provision of Windows and database server, regular maintenance, and updating. The Windows-based CBR system comprised a distributed environment with client server database architecture. The case retrieval was coded using C#, an open-source programming language. The physical implementation was done by the relational database management system (RDBMS) in Microsoft SQL Server 2008. The following screen shots demonstrate partial visual presentation of the implemented CBR system. illustrates an input interface screen. When users click on the analyze button, the system brings up the reasoning results as illustrated in . The user could return to the main menu and add this new case to the database or query other similar cases.
FIGURE 2 CBR dynamic weight vector assignment, rectangular dashed line.
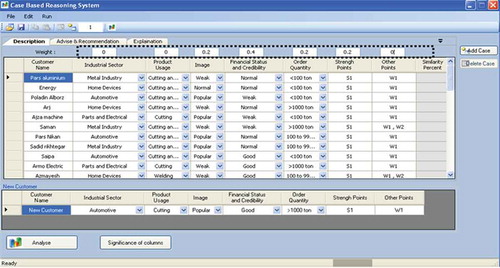
FIGURE 3 Retrieval user interface screen.
Retrieval System and Weighting Systems
In this study, three different weighting methods for case retrieval were utilized. The first method, called Feature Weighting using GA for CBR (GACBR). It used a mechanism to find feature weights based on the GA. In the second method, rough set found weight for each feature. This method was called Feature Weighting using rough set for CBR (RSCBR). The third method, called Feature Weighting using fuzzy inference system for CBR (FCBR). It used a new mechanism to find feature weights based on marketing experts’ opinions and customer features.
Calculation of Feature Weights Using GA
GA Method
GA emulates natural evolution. Conventionally, it creates an initial population through random number generation. Population and chromosomes are important components in the GA and play key role in GA performance. A chromosome indicates a solution that has a binary structure, and population denotes a solution pool. The GA calculates the fitness function of each chromosome after creation of first population (Ahn and Kim Citation2009b). Results of each chromosome will be evaluated by a fitness function.
Genetic operators are crossover and mutation. Genetic operators produce offspring based on fitness value. The crossover operator replaces substrings of two chromosomes and generates a new chromosome. According to the mutation operator, two numbers of a string are selected and exchanged. Applying these operators and generating new chromosome is repeated until the stopping criterion is satisfied.
Search space is extremely large to calculate best weight vector because there are many combinations of values for each case feature (Chiu Citation2002). Therefore, GA could create a weight vector for a CBR problem. Each weight vector is a chromosome. Due to each chromosome, a fitness value is used (Chiu Citation2002).
Population Initialization
The aim of the population initialization is to provide a number of past cases as chromosomes for selection. The population size, n, is defined to control the number of chromosomes selected for GA operations, that is, crossover and mutation. Generally, chromosomes are extracted randomly from a case library (Lam et al. Citation2012).
Termination Criteria and Chromosome Selection
The GA operation was terminated when the number of generations reached the predefined setting. The number of generations is usually set to a large number to provide more chances in searching, ensuring that different combinations are examined for a solution. If the GA process continues, chromosomes are selected to form a mating pool so that a new solution can be generated. In general, the chromosomes with higher fitness values should have higher probabilities for retention. The Roulette-Wheel selection is one of the methods used in choosing chromosomes. A random number between 0 and 1 is then generated. A chromosome is selected according to the segment that the random number falls into (Lam et al. Citation2012).
Chromosome Crossover
To produce the new offspring and search for a better fitness function, crossover and mutation are the commonly used genetic operators. Crossover is a process of creating new chromosomes by exchanging selected genes between pairs of chromosomes.
Mutation
Mutation is another operator that attempts to avoid the solution in order to fall into local optima by changing values of genes. The gene value is changed by either 0 or 1 under the binary-encoding scheme. As a result, diverse solutions could be produced for generations (Lam et al. Citation2012).
Fitness Function
The objective of the proposed GA approach was to determine a set of weight values that could best formalize the match between input and previously stored cases. The GA is used to search for the best set of weights that are able to promote association consistency among the cases. The fitness value in this study is defined as the number of old cases whose solutions match the solution of the input case(s). In order to obtain the fitness value, many procedures have to be executed beforehand.
The Evaluation Process
The Similarity Process computes the similarity between an input training case and an old case. The similarity value, named Overall Similarity Degree (OSD), is derived by summing each degree of similarity resulting from comparing each pair of corresponding case features out of the selected training case and the old case (Chiu Citation2002).
As mentioned earlier, OSD is the key determinant for assessing the similarity between the input case and the old case. Purpose for introducing the GA was to determine the most appropriate set of weighting values that could direct a more effective search for higher OSDs to match the input case.
There might usually exist several old cases that are inferred to be similar (either exact or nearly identical) to the input case. In other words, the solution (i.e., the outcome feature) of each old case could be proposed as a solution for a certain training case. To determine which cases have the outcome feature that can be adopted as the outcome feature for the input case, this research proposes that the majority of the outcome features among the top 20% OSDs in those old cases are used to represent the final solution for each batch of the similarity process execution for a given training Case j. The Weighting Process is applied to minimize the overall difference between the original real outcome features and the expected outcome features. In other words, the more chance O′j is deemed as equal to Oj, the higher the probability that the appropriate weighting values can be produced ().
TABLE 5 Illustration of the Prediction Evaluation Function (Y)
GA Control Parameters
For parameter controlling of GA search in GACBR, 30 chromosomes in the population were utilized. The crossover rate was set at 0.8 and the mutation rate at 0.3. The stopping condition was set to 40 generations (). In this study, the GA was implemented using MATLAB 6.
TABLE 6 The GA Parameters
TABLE 7 Output of GA System under Different Parameter Sets
GA Results
The approximate weighting values for the similarity values, after the 1000th generation in the GA training process, are shown in . The best weighting vectors are illustrated in . Once these derived values were applied to the case features, the GACBR system produced an accuracy of 78.3% from the target.
TABLE 8 Output of the GACBR System
Calculation of Feature Weights Using RST
Introduction
This study applied RSCBR to analyze marketing and sales history. The objective of using RST was to identify weight vector. The RST was introduced by Pawlak (Citation1982) as a useful tool to deal with data with uncertainty, reduce size of datasets, find hidden patterns, and generate decision rules. To the best of our knowledge, the RST has not been applied to the MMP problem.
Rough Set
According to Pawlak, a database can be regarded as an information or decision table. Suppose ,
is a decision table, where U, called universe, is a finite nonempty set of objects. A is a set of attributes, and d is a set of decision variables. For
,
, where
is a value set of attribute a, and
is the information function (Jiang Citation2006). In the decision table, if there were some sets of attributes with equal decision variables, they were called indiscernible cases. These equal features were represented with
. Indiscernible cases were caused by similar feature values or repeatability of cases.
(2)
The upper and lower approximations can be defined as:
A set is called a rough set when is nonempty. Positive region of object set is defined as
, and dependency of attributes can be defined in the following way:
If k = 1 then D depends totally on C and the decision table is consistent. If 0 < k < 1 then D depends partially on C and the decision table is partially inconsistent, and if k = 0, then D is totally independent on C and the decision table is completely inconsistent.
Rough Set Algorithm
A modified algorithm to obtain feature weights was developed as the following (Jiang Citation2006):
Step 1. Calculate
Step 2. Calculate
Step 2.1. If all cases are consistent then
Step 2.2. If there is any inconsistent case then
Step 3. For I = 1 to 7, repeat step 4 to 7.
Step 4. Calculate
Step 5. Compute
Step 6. Compute
Step 7. Calculate
Step 8. Compute weight vector as
Implementation and Results
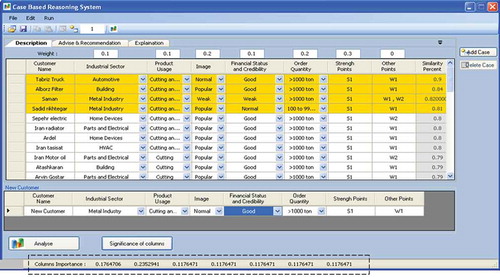
After applying Algorithm 1 mentioned in the previous subsection, each attribute weight was obtained. When users click on the significance of columns button, RSCBR brings up RST results, as illustrated in . Weight vector was shown in and . The algorithm was implemented using Microsoft C#.Net and MS SQL Server 2008.
TABLE 9 Output of the RSCBR System
FIGURE 4 Weight vector based on RSCBR, rectangular dashed line.
Calculation of Feature Weights Using Fuzzy System
In order to formulate human knowledge, experience, and subjective viewpoints of marketing experts in a natural language format, a fuzzy expert system was proposed. In feature weight computation, because one does not exist in any mathematical deterministic function, this work provides a fuzzy expert system to make a more realistic weight vector.
Fuzzy Set
Fuzzy set theory, which was introduced by Zadeh (Citation1965) is a typical method used when encountering ambiguity and imprecision. In a crisp set, the value of the characteristic function is either 0 or 1, but the dichotomy is usually inadequate in the human mind. In a real world, it is full of blurred uncertainty. Therefore, an appropriate value is taken between 0 and 1 to represent the degree of one element belonging to a set. The membership function is denoted by , and it can be expressed as
, where A is the fuzzy set, x is an element, X is a universal set. When the value of
, is closer to 1, the degree of x belonging to A is larger (Lin Citation2012).
Fuzzy Logic Control
In fuzzy logic control, some fuzzy rules (e.g., IF …, THEN …) are employed to establish an inference mechanism. The input value of the fuzzy logic controller is often a crisp value, and then is fuzzified as the input value into the inference mechanism. Finally, the output value of the fuzzy logic controller is defuzzified to infer the actual situation.
Defining the Input and Output Variables
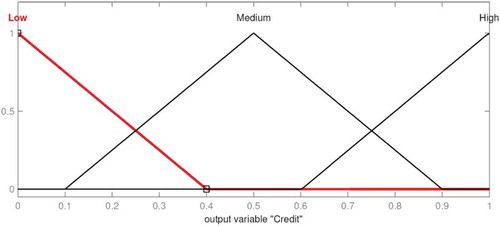
In this subsection, an FIS has been investigated to make more realistic feature weighting. In order to design the mentioned system, “two inputs seven output (TISO)” were considered. The linguistic terms that were used here were low (L), medium (M), and high (H; Castro et al. Citation2011). In the current study, the membership functions are triangular fuzzy numbers. These membership functions are shown in , , and , respectively. Monetary value denotes the short-term value of each customer, based on purchase amount. Future value signifies customer long-term value, based on purchase frequency.
FIGURE 5 Partition of monetary universe set.
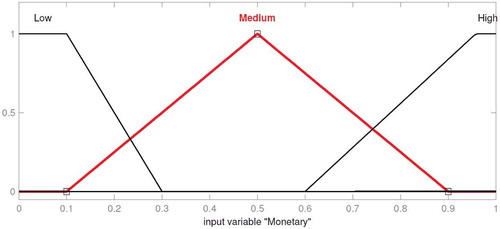
FIGURE 6 Partition of frequency universe set.
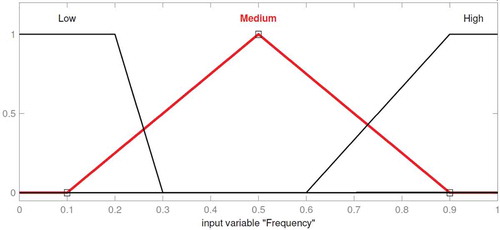
FIGURE 7 Partition of output universe set.
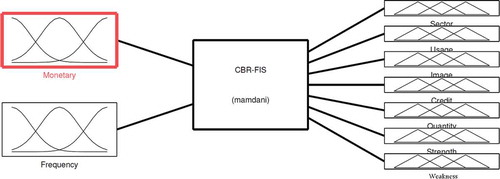
The designed fuzzy system contains two inputs and seven outputs. As mentioned, these inputs and outputs consisted of monetary, frequency, and feature weights, respectively ().
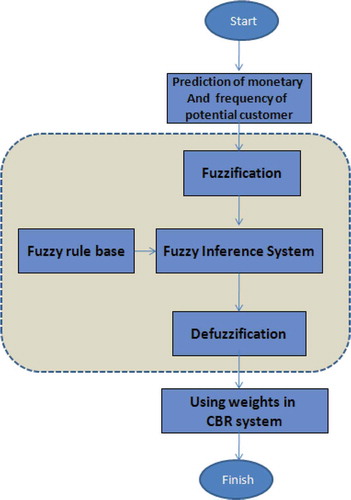
FIGURE 8 Mamdani FIS application scheme, followed in this study.
The Fuzzy Rule Base
A fuzzy rule is the implication stated as the If–Then rule, which is divided into two main parts (Hajipour, Kazemi, and Mousavi Citation2013):
“If” part, which describes the premise section of the fuzzy rule.
“Then” part, which describes the conclusion section of the fuzzy rule.
Monetary value and frequency value were defined as input variables, and feature weights (output variables) were considered as the “then” part. A general form of fuzzy rule is expressed as follows:
“If inputs are 〈linguistic terms〉, Then output is 〈linguistic term〉”
This system contains the following five rules:
| Rule 1: | = | If Monetary is 〈L〉 AND Frequency is 〈L〉, Then Sector is 〈L〉 AND Usage is 〈L〉 AND Image is 〈L〉 AND Credit is 〈L〉 AND Quantity is 〈L〉 AND Strength is 〈L〉 AND weakness is 〈L〉. |
| Rule 2: | = | If Monetary is 〈H〉 AND Frequency is 〈L〉, Then Sector is 〈L〉 AND Usage is 〈L〉 AND Image is 〈H〉 AND Credit is 〈H〉 AND Quantity is 〈H〉 AND Strength is 〈L〉 AND weakness is 〈H〉. |
| Rule 3: | = | If Monetary is 〈L〉 AND Frequency is 〈H〉, Then Sector is 〈M〉 AND Usage is 〈L〉 AND Image is 〈M〉 AND Credit is 〈M〉 AND Quantity is 〈H〉 AND Strength is 〈H〉 AND weakness is 〈H〉. |
| Rule 4: | = | If Monetary is 〈H〉 AND Frequency is 〈H〉, Then Sector is 〈L〉 AND Usage is 〈L〉 AND Image is 〈H〉 AND Credit is 〈H〉 AND Quantity is 〈H〉 AND Strength is 〈H〉 AND weakness is 〈H〉. |
| Rule 5: | = | If Monetary is〈M〉 AND Frequency is 〈M〉, Then Sector is 〈L〉 AND Usage is 〈L〉 AND Image is 〈M〉 AND Credit is 〈H〉 AND Quantity is 〈L〉 AND Strength is 〈M〉 AND weakness is 〈M〉. |
The Fuzzy Inference System
To implement the proposed fuzzy expert system, in this research, the following approaches have been considered (Zadeh Citation1999; Kadkhodaie et al. Citation2009)
Fuzzifier in the terms of fuzzification interface.
Mamdani implication engine to inference the fuzzy system.
A centroid defuzzifier in the terms of defuzzification interface.
The fuzzy inference procedure is illustrated in the following steps:
| Step 1: | = | Involve inputs fuzzy inputs into their universe sets. |
| Step 2: | = | Combine inputs fuzzy sets and obtain active rules. |
| Step 3: | = | Calculate μX(x0), which are named h1. |
| Step 4: | = | Determine matching degree (δj; j = 1, ⋯, J) for each active rule as δj = min (h1,h2,h3) in the general state. To do so, because our system has one input, the aforementioned equation will be changed as δj = min (h1,h2,h3) = h1. |
| Step 5: | = | Implement Max–Min operator to determine the outputs. It is necessary to mention that Steps 3–5 should be iterated for all active rules. |
| Step 6: | = | Convert fuzzy outputs into the crisp values by centroid defuzzification. |
At the end, the obtained value of the latest step was considered as real system capability. In order to clarify the trend of provided methodology, represents a flowchart of the execution of the methodology.
FIGURE 9 The flowchart of FIS methodology.
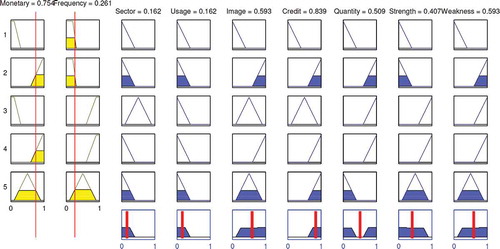
Experimental Results
As shown in , in the universe set of input variables, the terms ‘‘H’’ and ‘‘L’’ were involved as new customer features. Therefore, all rules were active. Consequently, the defuzzified value was calculated as W = (0.162, 0.162, 0.593, 0.839, 0.509, 0.407, 0.593). After the normalization process, weight vector of features, which were industrial sector, product application, image and liability, credit, purchase quantity, strength and weakness points were given to be WG = (0.05, 0.05, 0.18, 0.26, 0.16, 0.12, 0.18). Summary of calculated normalized weight values is shown in .
FIGURE 10 Fuzzy reasoning for multiple rules with antecedents.
GA, RST, and FIS Accuracy Comparison
Predicting accuracy of feature weighting methods has been compared in this subsection. Among the weighting methods, FCBR achieved the highest level of accuracy (80%) in the given dataset, followed by GACBR (78.3%) and RSCBR (75.2%). The results showed that FCBR improved prediction accuracy of RSCBR systems by about 5% in this dataset.
In order to examine whether differences of predictive accuracy between FCBR and other comparative methods were statistically significant, a McNemar test was applied to experimental results. The McNemar test is a nonparametric technique to check differences between paired results. This test verified that results and differences in prediction accuracy of feature weighting methods was very small. As a result, FCBR has produced optimal weight vector with regard to accuracy.
TABLE 10 Sample Output of FIS
CBR System Evaluation
Th CBR system was implemented in a real industrial environment, and a deep and methodological evaluation of the system was performed over15 months starting in June 2010.
Validation
A face validation was then employed to capture the perceptions and satisfaction of marketing experts on the system performance (O’Keefe, Balci, and Smith Citation1987). During the face validation, a series of short demonstrations were presented to four marketing experts involved in the above case study, and the experts were asked to apply their knowledge and intuition to compare the system’s performance against that of human experts (Luu, Thomas, and Chen Citation2003).
The marketing experts were from the company, with 10–20 years of relevant experience. At the end, they were asked to complete a questionnaire to indicate their degree of satisfaction on a five-point scale (with 5 denoting very satisfied) on various aspects of the developed CBR system. The results of the face validation indicate that the experts interviewed will use the developed CBR system favorably for B2B marketing (mean = 4 out of 5), they believe the CBR system has a practical usage (mean = 4.25), and they are satisfied with the overall performance of the system (mean = 3.5). The participating experts were satisfied with the results generated by CBR system, and they believed that the system could provide practical and reliable marketing advices for MMP (Ng and Luu Citation2008).
Verification
Verification is the process of checking whether development of the system complies with specifications (Bürkle et al. Citation2001) in terms of provided support for the recommendations. Verification was done by manual verification.
Evaluation of the Sales Amount
Finally, the evaluation of the sales rise carried out comparing business indicators (i.e., number of new contracts, number of new customers, customer satisfaction indicator) for (1) the last 12 months before the CBR system was integrated in the company and (2) the first 12 months of use (Sanchez et al. Citation2013).
FUZZY AHP FOR WEIGHTING SYSTEM SELECTION
Fuzzy AHP
With regard to uncertainties and vagueness of the decision problem and to exclude disadvantages of AHP, fuzzy AHP was used in this study. In the fuzzy AHP process, the pairwise comparisons in the judgment matrix are fuzzy numbers. The procedure calculated a corresponding set of scores and determined one composite score that is the average of these fuzzy scores (Kahraman, Cebeci, and Ruan Citation2004).
Zadeh proposed fuzzy logic to resolve ambiguous and vague information. The proposed fuzzy AHP utilized triangular fuzzy numbers in pairwise judgments and evaluation matrices. A triangular fuzzy number was represented as (l, m, u). The parameters l, m, and u identify the smallest possible value, the most promising value, and the largest possible value that illustrate a fuzzy event (Kahraman Cebeci, and Ruan Citation2004).
A triangular fuzzy number membership function can be described as (Kahraman, Cebeci, and Ruan Citation2004)
According to the Chang’s (Citation1992) method, each object is taken and extent analysis for each goal, gi, is done respectively. Therefore, m extent analysis values for each object can be achieved, with the following signs:
The steps of Chang’s extent method can be presented as in the following (Kahraman, Cebeci, and Ruan Citation2004):
The value of fuzzy synthetic extent with respect to ith object is determined as
To calculate consider the fuzzy addition operation of m extent analysis values for a particular matrix such that
The degree of possibility or probability of M2 = (l2,m2,u2) ≥ M1 = (l1,m1,u1) is defined as
The term hgt is the height of fuzzy numbers on the intersection of M1 and M2 and d is crossover points’ abscissa of M1 and M2. To compare M1 and M2, both values of V(M1M2) and V(M2
M1) are required.
3. The degree of possibility for a convex fuzzy number to be greater than k convex fuzzy numbers Mi (i = 1, 2, …, k) can be given by the use of the operations max and min and can be defined by
Assume that
For k = 1, 2, …, n; k ≠ i, and k is the number of criteria. Then the weight vector is specified by
4. Via normalization, the normalized weight vectors are
Definition of Criteria
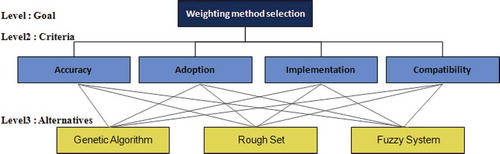
First, the goal of the decision-making problem was defined, which was “selecting the most effective weighting method.” Hierarchy of the problem was also built (). Problem hierarchy has three levels. The first level of the hierarchy specifies the goal of the problem. The second level of the hierarchy is organized under four categories: accuracy perspective, adoption perspective, implementation perspective, and compatibility perspective. Accuracy of weighting methods was measured in the previous sections. Adoption means considering new customer circumstances. For example, if one customer feature is important for the marketing manager, he or she can increase relevant feature weight in the CBR system. Implementation of a weighting method was another criterion for method selection and considered ease of programming, ease of configuration, implementation time and user friendliness. Compatibility was related to applicability of the weighting algorithm in the CBR program. Finally, the bottom level of the hierarchy specifies the three alternative weighting methods.
FIGURE 11 Problem hierarchy.
Computation of the Weights of the Criteria and Alternatives
After building the fuzzy AHP model, different priority weights of each element were computed. The attribute preference over another was selected by the experience of the marketing manager and experts. First, the expert compared the main attributes with respect to the main goal. At the end, the expert compared the weighting methods with respect to each attribute. The expert used the linguistic variables to make the pairwise comparisons. Then the linguistic variables were changed to triangular fuzzy numbers. illustrates the linguistic variables and their corresponding triangular fuzzy numbers.
TABLE 11 The Linguistic Variables and Their Corresponding Fuzzy Numbers
Each triangular fuzzy number, M = (l, m, u) in the pairwise comparison matrix was changed to a crisp number using M_crisp=(4 m + l + u)/6. After the fuzzy comparison matrices were converted into crisp matrices, the consistency of each matrix was checked by the method in crisp AHP (Kwong and Bai Citation2003). After calculation, the consistency ratio of each comparison matrix was found to be under 0.10. Therefore, it can be concluded that the consistency of the pairwise judgments in all matrices was acceptable. Then the priority weights of each element were computed. As an example, the calculation of the priority weights of the main attributes will be explained in detail below. By using the values in , the linguistic variables in the comparison matrix were changed to triangular fuzzy numbers. The fuzzy evaluation matrix can be seen in and .
TABLE 12 The Fuzzy Evaluation Matrix with Respect to the Goal with Linguistic Variables
TABLE 13 The Fuzzy Evaluation Matrix
In order to determine priority weights of the method dimension, first, fuzzy values of the attributes were computed by using Equation (10). The different values of fuzzy numbers of the four different dimensions were denoted by .
The degree of possibility of Si over Si (i ≠ j) was calculated by using Eqs. (15) and (16).
With the help of Eq.(18), the minimum degree of possibility was demonstrated as below:
Consequently, the weight vector was calculated as W′ = (0.73, 1, 0.04, 0.43). After he normalization process, the weight vector of the method dimensions was given to be WG = (0.33, 0.45, 0.02, 0.19)T. The same computations were used in the other pairwise comparison matrices and the priority weights of each element were calculated. The priority weights of each element can be found in . The results illustrated that adoption perspective (0.45) and accuracy perspective (0.33) have higher weightings.
TABLE 14 Priority Vectors for the Decision Hierarchy
Computation of the Overall Score of Each Method and Finding the Best Method
In this step, the method dimensions were combined to compute priority weights of the alternative weighting method. In , each column of the matrix was multiplied by the priority weight at the top of the column, and then those values were added up for each row. At the end, alternatives priority weights were computed.
In order to simplify the fuzzy AHP calculations, Ms Excel was utilized. The priority weights for the alternatives were found to be (0.24, 0.41, 0.33). According to the final result, RST is the most preferred weighting method because it has the highest priority weight and the fuzzy system is the next recommended method.
TABLE 15 Weighting System Priorities
CONCLUSION
MMP is one of the most important marketing activities in today’s competitive world. This study designed and implemented a CBR system that allows marketing managers to develop desirable marketing mix plans. However, this study is dedicated to help marketing managers through utilizing marketing and sales experiences and prevent them from repeating the same negative experiences. The proposed CBR system was used to manage target customers through delivering the right products and right promotions at the right prices. How to comprehensively determine marketing mix is a complex task and, when dealing with the range of various B2B customers, marketing managers struggle to identify the one most appropriate marketing plan for the target customer. Moreover, this study was built to evaluate weighting systems and to find the best weighting method.
Determining feature weights in a CBR system directly affects quality of the final solution. As mentioned in the literature review, in most recent studies, weight vector has been measured in two different ways, namely by GA and RST. Additionally, FIS has been developed for weighting because of its ability to address customer circumstances. Accuracy of weighting methods was examined, and FCBR outperformed all other models and achieved the highest predictive accuracy of 80%.
Accuracy is not adequate for judging efficiency of weighting system. Additionally, CBR users should know how to select a weighting method when they consider various weighting methods. No research has been found in the literature that surveyed weighting method comparison and selection. To adequately address this problem, a multicriteria decision making (MCDM) method is proposed. This method can help marketing and sales managers to select a weighting method systematically and correctly. To perform method selection, a fuzzy AHP model was developed. Results of this study indicated RST as the best weighting method. However, returning to the question posed at the beginning of this study, it can be stated that RST is the best method for feature weighting. It is also shown that RST is a comprehensive weighting method for CBR implementation.
The findings of this study made several contributions to the current literature. First, it is possible to use a CBR implementation for MMP; second, FIS was originated for feature weighting; and third, after comparing three alternative feature weighting techniques (GA, RST, and FIS), the most effective one was selected using fuzzy AHP. These findings could enhance the understanding of CBR system application.
A number of important limitations need to be considered. First, the RST algorithm efficiency was limited by the number of customers in the database. Second, the current research was not specifically designed to evaluate retrieved cases with equal similarity values. Finally, the study did not consider use of other weighting methods (e.g., neural networks and grey relational analysis) in the fuzzy AHP framework.
There are a number of challenges involved in the proposed system that could provide a great number of possibilities for future research. For example, further investigation of marketing strategy cost estimation is strongly recommended. In addition, another important practical implication is automation of CBR revise and reuse phases. Furthermore, the proposed CBR in this study could be designed in a web-based platform, and web-based user-interfaces could be designed. In addition, the CBR system used for the steel sector might be applied to other industrial sectors.
FUNDING
This work was supported by the University of Tehran and Amirkabir University of Technology. This work was also supported by the Quality Management Institute of Iran.
Notes
Color versions of one or more of the figures in the article can be found online at www.tandfonline.com/uaai
REFERENCES
- Ahn, H., J. J. Ahn, K. J. Oh, and D. H. Kim. 2011. Facilitating cross-selling in a mobile telecom market to develop customer classification model based on hybrid data mining techniques. Expert Systems with Applications 38(5):5005–5012.
- Ahn, H., and K. Kim. 2008. Using genetic algorithms to optimize nearest neighbors for data mining. Annals of Operations Research 163(1):5–18.
- Ahn, H., and K. Kim. 2009a. Bankruptcy prediction modeling with hybrid case-based reasoning and genetic algorithms approach. Applied Soft Computing 9(2): 599–607.
- Ahn, H., and K. Kim. 2009b. Global optimization of case-based reasoning for breast cytology diagnosis. Expert Systems with Applications 36(1):724–734.
- Ahn, H., K. Kim, and I. Han. 2006a. Global optimization of feature weights and the number of neighbors that combine in a case based reasoning system. Expert Systems 23(5):290–301.
- Ahn, H., K. Kim, and I. Han. 2006b. Hybrid genetic algorithms and case based reasoning systems for customer classification. Expert Systems 23(3):127–144.
- Ahn, H., K. Kim, and I. Han. 2007. A case-based reasoning system with the two-dimensional reduction technique for customer classification. Expert Systems with Applications 32(4):1011–1019.
- Althuizen, N. A. P., and B. Wierenga. 2008. The value of analogical reasoning for the design of creative sales promotion campaigns: A case-based reasoning approach. Working paper.
- Bae, J. K., and J. Kim. 2010. Integration of heterogeneous models to predict consumer behavior. Expert Systems with Applications 37(3):1821–1826.
- Bu, Q., and F. Zhang. 2013. The risk assessment of marketing management system on the basis of multi-level fuzzy comprehensive evaluation. In Proceedings of the Sixth International Conference on Management Science and Engineering Management, Lecture Notes in Electrical Engineering 185:845–84. Berlin: Springer.
- Bürkle, T., E. Ammenwerth, H. Prokosch, and J. Dudeck. 2001. Evaluation of clinical information systems. What can be evaluated and what cannot? Journal of Evaluation in Clinical Practice 7(4):373–385.
- Büyüközkan, G., and B. Ergün. 2011. Intelligent system applications in electronic tourism. Expert Systems with Applications 38(6):6586–6598.
- Castro, J. L., M. Navarro, J. M. Sánchez, and J. M. Zurita. 2011. Introducing attribute risk for retrieval in case-based reasoning. Knowledge-Based Systems 24(2):257–268.
- Chang, D.-Y. 1992. Extent analysis and synthetic decision. Optimization Techniques and Applications 1:352–355.
- Chang, P.-C., C.-H. Liu, and R.K. Lai. 2008. A fuzzy case-based reasoning model for sales forecasting in print circuit board industries. Expert Systems with Applications 3(3):2049–2058.
- Chang, P.-C., and C.-Y. Lai. 2005. A hybrid system combining self-organizing maps with case-based reasoning in wholesaler’s new-release book forecasting. Expert Systems with Applications 29(1):183–192.
- Chang, P. C., C. Y. Lai, and K. R. Lai. 2006. A hybrid system by evolving case-based reasoning with genetic algorithm in wholesaler’s returning book forecasting. Decision Support Systems 42(3):1715–1729.
- Changchien, S., and M. C. Lin. 2005. Design and implementation of a case-based reasoning system for marketing plans. Expert Systems with Applications 28(1):43–53.
- Chen, Y. K., C.Y. Wang, and Y. Y. Feng. 2010. Application of a 3NN+ 1 based CBR system to segmentation of the notebook computers market. Expert Systems with Applications 37(1):276–281.
- Chiu, C. 2002. A case-based customer classification approach for direct marketing. Expert Systems with Applications 22(2):163–168.
- Deng, Z., X. Zhang, D. Cao, and H. Cao. 2010. Process expert system in NC camshaft grinding on the basis of rough set and case-based reasoning. Journal of Mechanical Engineering 46(21):178–186.
- Dong, X.-F., Y.-J. Gu, K. Yang, and X. He. 2009. Application of case-based reasoning for power plant equipment RCM analysis based on fuzzy rough set. Proceedings of the Chinese Society of Electrical Engineering 29(32):30–36.
- Dong, Y. 2006. A case based reasoning system for evaluating customer credit. Journal of Japan Industrial Management Association 57(2):144–152.
- Fu, Y., and R. Shen. 2004. GA based CBR approach in Q and A system. Expert Systems with Applications 26(2):167–170.
- Gunawardena, S., R. O. Weber, and J. Stoyanovich. 2013. Learning feature weights from positive cases. In Case-based reasoning research and development, 134–148. Berlin: Springer.
- Hajipour, V., A. Kazemi, and S. M. Mousavi. 2013. A fuzzy expert system to increase accuracy and precision in measurement system analysis. Measurement 46:2770–2780.
- Han, M., Y. Li, and Z. Cao. 2014. Hybrid intelligent control of BOF oxygen volume and coolant addition. Neurocomputing 123:415–423.
- Han, M., X.- Z. Wang, Y. Li, and N.Tong. 2013. Bayesian rough set and mixture experts model based CBR system. Control and Decision 28(1):157–160.
- Heras, S., J. Á. García-Pardo, R. Ramos-Garijo, A. Palomares, V. Botti, M. Rebollo, and V. Julián. 2009. Multi-domain case-based module for customer support. Expert Systems with Applications 36(3):6866–6873.
- Hsu, C. I., C. Chiu, and P. L. Hsu. 2004. Predicting information systems outsourcing success using a hierarchical design of case-based reasoning. Expert Systems with Applications 26(3):435–441.
- Hsu, K. H., C. Chiu, N. H. Chiu, P. C. Lee, W. K. Chiu, T. H. Liu, and C. J. Hwang. 2011. A case-based classifier for hypertension detection. Knowledge-Based Systems 24(1):33–39.
- Im, K. H., and S. C. Park. 2007. Case-based reasoning and neural network based expert system for personalization. Expert Systems with Applications 32(1):77–85.
- Ji, A. M., K. Zhu, and Q. S. Huang. 2012. Methods determining the weights of characteristics in mechanical products design on case-base reasoning. Applied Mechanics and Materials 138:315–320.
- Jiang, Y., J. Chen, and X. Ruan. 2006. Fuzzy similarity-based rough set method for case-based reasoning and its application in tool selection. International Journal of Machine Tools and Manufacture 46(2):107–113.
- Johnson, D.S., B. H. Clark, and G. Barczak. 2012. Customer relationship management processes: How faithful are business-to-business firms to customer profitability? Industrial Marketing Management 41(7):1094–1105.
- Juan, Y.-K., S.-F. Chien, and Y.-J. Li. 2010. Customer focused system for pre-sale housing customisation using case-based reasoning and Feng Shui theory. Indoor and Built Environment 19(4):453–464.
- Kadkhodaie, I. A., M. R. Rezaee, H. Rahimpour-Bonab, and A. Chehrazi. 2009. Petrophysical data prediction from seismic attributes using committee fuzzy inference system. Computers and Geosciences 35(12):2314–2330.
- Kahraman, C., U. Cebeci, and D. Ruan. 2004. Multi-attribute comparison ofcatering service companies using fuzzy AHP: The case of Turkey. International Journal of Production Economics 87(2):171–184.
- Kim, K. J. 2004. Toward global optimization of case-based reasoning systems for financial forecasting. Applied Intelligence 21(3):239–249.
- Kim, K.-J., and H. Ahn. 2008. A recommender system using GA K-means clustering in an online shopping market. Expert systems with applications 34(2):1200–1209.
- Kwong, C. K., and H. Bai. 2003. Determining the importance weights for the customer requirements in QFD using a fuzzy AHP with an extent analysis approach. IEE Transactions 35(7):619–626.
- Lam, C. H. Y, K. L. Choy, G.T. Ho, and S.H. Chung. 2012. A hybrid case-GA-based decision support model for warehouse operation in fulfilling cross-border orders. Expert Systems with Applications 39(8):7015–7028.
- Lee, H.-Y., H. Ahn, and I. Han. 2007. VCR: Virtual community recommender using the technology acceptance model and the user’s needs type. Expert Systems with Applications 33(4):984–995.
- Lee, J. H., and S. H. Ha. 2009. Recognizing yield patterns through hybrid applications of machine learning techniques. Information Sciences 179(6):844–850.
- Lee, N., J.K. Bae, and C. Koo. 2012. A case-based reasoning based multi-agent cognitive map inference mechanism: An application to sales opportunity assessment. Information Systems Frontiers 14(3):653–668.
- Li, H., and J. Sun. 2008. Ranking-order case-based reasoning for financial distress prediction. Knowledge-Based Systems 21(8):868–878.
- Li, H., and J. Sun. 2009. Hybridizing principles of the Electre method with case-based reasoning for data mining: Electre-CBR-I and Electre-CBR-II. European Journal of Operational Research 197(1):214–224.
- Liao, S., Y. Chen, and H. Hsieh. 2011. Mining customer knowledge for direct selling and marketing. Expert Systems with Applications 38(5):6059–6069.
- Liao, S. H., Y. Chen, Y., and H. Yang. 2013. Mining customer knowledge for channel and product segmentation. Applied Artificial Intelligence 27(7):635–655.
- Liao, S. H., and Y. J. Chen. 2004. Mining customer knowledge for electronic catalog marketing. Expert Systems with Applications 27(4):521–532.
- Lin, J. S. 2012. Constructing a yield model for integrated circuits based on a novel fuzzy variable of clustered defect pattern. Expert Systems with Applications 39(3):2856–2864.
- Lin, R. H., Y. T. Wang, C. H. Wu, and C. L. Chuang. 2009. Developing a business failure prediction model via RST, GRA and CBR. Expert Systems with Applications 36(2):1593–1600.
- Liu, C., and H. Chen. 2012. A novel CBR system for numeric prediction. Information Sciences 185(1):178–190.
- Liu, C.-H., and Y.-W. Wang, Y.-W. 2012. Establish a cluster based evolutionary adaptive Weighted Fuzzy CBR for PCB sales forecasting. In Proceedings of the 7th international conference on computing and convergence technology (ICCIT, ICEI and ICACT), 1417–1422.
- Luu, D. T., N. S. Thomas, and S. E. Chen. 2003. A case-based procurement advisory system for construction. Advances in Engineering Software 34(7):429–438.
- Martínez-López, F. J., and J. Casillas. 2013. Artificial intelligence-based systems applied in industrial marketing: An historical overview, current and future insights. Industrial Marketing Management 42(4):489–495.
- McSherry, D. 2005. Explanation in recommender systems. Artificial Intelligence Review 24(2):179–197.
- Naik, P. A., K. Raman, and R. S. Winer. 2005. Planning marketing-mix strategies in the presence of interaction effects. Marketing Science 24(1):25–34.
- Ng, S. T., and C. D. T. Luu. 2008. Modeling subcontractor registration decisions through case-based reasoning approach. Automation in Construction 17(7):873–881.
- Ngai, E. W. T., L. Xiu, and D. Chau. 2009. Application of data mining techniques in customer relationship management: A literature review and classification. Expert Systems with Applications 36(2):2592–2602.
- Noori, B. 2012. Marketing DSS architecture for sports sponsorship management. Journal of Database Marketing and Customer Strategy Management 19(4):29–299.
- O’Keefe, R. M., O. Balci, and E. P. Smith. 1987. Validation of expert system performance. IEEE Expert 2:81–90.
- Pawlak, Z. 1982. Rough set. International Journal of Information and Computer Sciences 11:341–356.
- Sanchez, E., C. Toro, A. Artetxe, M. Graña, C. Sanin, E. Szczerbicki, … and F. Guijarro. 2013. Bridging challenges of clinical decision support systems with a semantic approach. A case study on breast cancer. Pattern Recognition Letters 34:1758–1768.
- Shin, K., and I. Han. 1999. Case-based reasoning supported by genetic algorithms for corporate bond rating. Expert Systems with Applications 16(2):85–95.
- Smiti, A., and Z. Elouedi. 2014. WCOID-DG: An approach for case base maintenance based on weighting, clustering, outliers, internal detection and dbsan-gmeans. Journal of Computer and System Sciences 80(1):27–38.
- Sun, Z., and G. Finnie. 2005. A unified logical model for CBR based e-commerce systems. International Journal of Intelligent Systems 20(1):29–46.
- Tang, Y-C., and M. J. Beynon. 2005. Application and development of a fuzzy analytic hierarchy process within a capital investment study. Journal of Economics and Management 1(2):207–230.
- Tao, J., and S. Huizhang. 2006. Feature selection and weighting method based on similarity rough set for CBR. In IEEE International Conference on Service Operations, Logistics and Informatics, 948–952. IEEE.
- Vukovic, S., B. Delibasic, A. Uzelac, and M. Suknovic. 2012. A case-based reasoning model that uses preference theory functions for credit scoring. Expert Systems with Applications 39(9):8389–8395.
- Wang, G.-D., J. Wang, and W. Wang. 2012. Application of rough set on composite process planning case retrieve. Journal of Wuhan University of Technology 34(6):27–31.
- Wang, H. Q., B. B. Sun, and X. F. Shen. 2013. Case-based reasoning rapid design approach for CNC turret. Advanced Materials Research 819:304–310.
- Wettschereck, D., D. W. Aha, and T. Mohri. 1997. A review and empirical evaluation of feature weighting methods for a class of lazy learning algorithms. Artificial Intelligence Review 11(1):273–314.
- Wierenga, B. 2010. Marketing and artificial intelligence: Great opportunities, reluctant partners. Marketing Intelligent Systems using Soft Computing 258:1–8.
- Xu, S., X. Liu, X. Hao, and M. Zhenghua. 2009. Research of case-based reasoning method based on rough sets. IEEE International Conference on Intelligent Computing and Intelligent Systems 1:416–419.
- Yuan, F. C., and C. Chiu. 2009. A hierarchical design of case-based reasoning in the balanced scorecard application. Expert Systems with Applications 36(1):333–342.
- Zadeh, L. A. 1965. Fuzzy sets. Information and Control 8(3):338–353.
- Zadeh, L. A. 1999. From computing with numbers to computing with words. From manipulation of measurements to manipulation of perceptions. IEEE Transactions on Circuits and Systems I: Fundamental Theory and Applications 46(1):105–119.