
Abstract
An artificial intelligence (AI)-based methodology is proposed for the damage diagnosis of beam members of engineering structures under complex loading conditions. The current proposed method has been developed using particle swarm optimization (PSO) technique. A single transverse open-edge crack has been developed on a beam structure, modeled by a local flexibility matrix that is calculated analytically to determine natural frequencies and mode shapes. The modified PSO employs the strategy of nonlinearly decreasing inertia weight, which varies from a large value to a small value. Furthermore, a fuzzy adaptive PSO (APSO) has been used that incorporates the dynamically varying inertia weight based on the variance of the population fitness. Numerical and experimental studies on the cracked beam structure were also conducted to ensure the integrity of the above algorithms. The results show that both the size and location of the crack can be predicted efficiently through the proposed APSO.
INTRODUCTION
Structural damage detection to evaluate system integrity and thus ensure lifetime safety and reliability of a system has drawn the attention of scientists and researchers for a long period. The probability of damage happening in structures is due to long services, mechanical vibrations, etc. Damage in the form of a small crack can lead to failure of a structure. So damage detection and severity currently form the subject of active research in the fields of aerospace and mechanical and civil engineering structural health monitoring. The presence of damage in a structure produces changes in its dynamic characteristics such as natural frequencies, mode shapes, and other modal parameters. These changes can lead to the detection of damage location and the extent of the damage.
Several nondestructive techniques (NDT; Cawley and Adams Citation1979; Haas and Schaefer Citation1996) using experimental methods such as ultrasonic testing, x-ray method, magnetic field method, radiography, and so on are available for crack detection. In order to obtain accurate predictions of crack in critical and complex structures through such experimental methods, a prior knowledge of the damage vicinity is required. These limitations have made the vibration-based inspection methods (Richardson Citation1980; Doebling et al. Citation1998) very popular and important in crack detection. Moreover, NDT methods are costly and time consuming for long components such as railway tracks and long pipe lines, in comparison to vibration-based inspection methods.
Different forward approaches used to model cracks in beams are addressed in the literature, a few of which are discussed as follows. Cracks in a structure cause a stiffness reduction, which in turn changes dynamic properties such as natural frequencies and mode shapes (Dimarogonas and Papadopoulos Citation1983). Yuen (Citation1985) studied the crack detection problem analytically and established a relation between crack location and its size and change in dynamic response characterized by eigenvalues and eigenvectors. Based on the above (Yuen Citation1985) work, Qian et al. (Citation1990) formulated the stiffness matrix of the beam with an open-edge crack by integrating over the stress intensity factor. Chondros and Dimaragonas (Citation1998) developed a continuous-cracked-beam theory to analyze the local flexibility of a cracked Euler–Bernoullie beam. Incorporating Hamilton’s principles, Viola et al. (Citation2001) used a finite element model to study the static and dynamic behavior of the structure. Yang et al. (Citation2001) proposed an energy-based numerical model using Galerkins method as an approach to determine frequencies and mode shapes of a rectangular beam containing one or two open surface cracks. Nahvi and Jabbari (Citation2005) used a finite element-based numerical method as well as an experimental approach to determine the modal parameters. Based on the results obtained from both methods, they presented a minimization approach to identify the cracked element within a cantilever beam. Hu et al. (Citation2007) proposed a numerical technique based on the global–local hybrid spectral element (HSE) method to study wave propagation in beams containing cracks. Lin (Citation2004) presented an analytical transfer matrix method to determine the natural frequencies of a cracked, simply supported, Timoshenko beam. Khaji et al. (Citation2009) extended the Lin (Citation2004) method to identify a crack in Timoshenko beams with various boundary conditions. Wu and Wang (Citation2011) carried out experimental studies on the aluminium cantilever beam using the spatial Gabor wavelet transform to identify the crack locations. Dixit and Hanagud (Citation2011) presented an analytical expression of a beam containing nonpropagating cracks with arbitrary boundary conditions, based on the strain energy method, which in turn is a function of damage location and depth. Caddemi and Morassi (Citation2013) proposed a new mathematical modeling and an efficient exact closed-form solution of a multicracked Euler–Bernoulli beam subjected to both static and dynamic conditions.
Different inverse approaches for crack detection could be considered an optimization problem for obtaining damage parameters, such as crack location and magnitude, based on changes in the structural dynamic properties; these are discussed in the literature. The usual procedure adopted in the inverse approach is the minimization of an objective function, which is defined in terms of the differences between the vibration data obtained by modal testing and those computed from the analytical model. Sahin and Shenoi (Citation2003) used ANN as a damage detection method for predicting damage location and severity in beam-like structures, by considering natural frequencies and mode-shapes data as input. Sahoo and Maity (Citation2007) proposed a hybrid neurogenetic algorithm for damage assessment of structures by considering the frequency and strain as input parameter and damage location and magnitude as output parameter. Vakil-Baghmisheh et al. (Citation2008) presented a genetic (GA) as a fault diagnosis approach to locate and quantify structural damage. Considering a new beam element with a single crack modeled as rotational spring, Mehrjoo et al. (Citation2013) presented a GA as a crack identification approach to predict crack location and depth in beam-like structures. All these approaches have their strengths and weaknesses; however, there is a growing preference for particle swarm optimization (PSO) because it is faster and predictions are accurate.
Particle swarm optimization (Kennedy and Eberhart Citation1995) is a novel, population-based global optimization computation technique. In the PSO algorithm, each single solution is a “bird” in the search space and is called a “particle.” All of particles have fitness values, which are evaluated by the fitness function to be optimized, and have velocities, which direct the flying of the particles. The particles fly through the problem space by following the current optimum particle, which is updated by the particle’s own experience and the experience of the particle’s topological neighbors or the experience of the whole swarm. Due to its simplicity and convergence speed, PSO has found its application in many complex engineering optimization problems, including structural health monitoring problems (Kang et al. Citation2012; Samanta and Nataraj Citation2009; Clerc Citation1999; Marinaki et al. Citation2010; Begambre and Laier Citation2009; Vakil-Baghmisheh et al. Citation2012). However, the main drawback associated with standard PSO is that the algorithm may converge into some local optima. Therefore, in order to improve convergence into global optima, algorithm refinement and parameter modification need to be considered.
In the basic thought of diminishing inertia value guidance, this study proposes a modified version of the PSO technique with nonlinearly decreasing inertia weight called NDW-PSO. The modified algorithm for updating velocity incorporates a dynamically reducing inertia weight. The randomness in acceleration coefficients is also changed linearly, linked with the generation number. The present study incorporates the dynamically varying inertia weight based on variance of the population fitness termed APSO. The accuracy of the above algorithm is verified through both numerical and experimental studies on the cracked cantilever beams.
The organization of this paper is as follows: A brief introduction of the theoretical analysis of cracked beam structure is presented. Then, optimization of the proposed objective function is presented for PSO, NDW-PSO, and APSO. In the following section, a nonlinear modulation index (n = 0.8) is proposed to deal with nonlinearly decreasing inertia in NDW-PSO, and a dynamic inertia term is taken for the fuzzy adaptive PSO. Some comparative studies are made for the assessment of all these above PSO implementations. Then, experimental setup and results are presented, followed by results and discussions that compare the proposed algorithms for both theoretical and experimental results.
CRACKED BEAM SYSTEM MODELING
shows a cantilever beam of length L, height T, and width W having a transverse open-edge full-width crack of depth b1, at a variable position Lc. The presence of the transverse surface crack introduces local flexibility, which subsequently influences the dynamic performance of the structure. These flexibility coefficients (compliance matrix) are expressed by the stress intensity factors. The relationship between strain energy release rate J and stress intensity factors (GIi) at the crack section is calculated by Equation (1) (Tada et al. Citation1973).
FIGURE 1 A cantilever beam with a crack at Lc, L is the length of the beam. The crack depth is b1, and T is the beam height.
The local stiffness matrix can be obtained by taking the inversion of the compliance matrix as given by
System Equations of Bending Vibration
The free vibration of an Euler–Bernoulli beam with a constant rectangular cross section is given by the following differential equations as transverse vibration:
The normal functions for the cracked beam model () in nondimensional form, for both the longitudinal and bending vibration in steady state, are expressed as
Geometric natural boundary conditions at both ends are
Compatibility conditions can be introduced to impose continuity of displacement, bending moment, and shear forces of the two segments at the crack location (x = Lc) and are given by
The existence of the difference in the slopes at the crack location imposes additional equilibrium conditions of fore balance and moment balance, given by the following relations in terms of local stiffness (K) of the cracked beam:
The normal functions, Equation (1) and the boundary conditions as mentioned, yield the characteristic equation of the system as , where, Ω is a 12 × 12 matrix, whose determinant is a function of natural circular frequency (ω), the nondimensional location of the crack (α) and the local stiffness matrix (K), which in turn is a function of the nondimensional crack depths β = (b1/T).
CRACK IDENTIFICATION AS AN INVERSE PROBLEM
Determination of the changes in the beam’s natural frequencies from a given value of depth and location of the crack is a straightforward task. Conversely, an optimization algorithm can be applied to estimate the crack properties by searching for the optimum value of the objective function.
The formulation of such inverse problem with the objective function and constraints is described as follows.
Objective Function and Constraints
The damage in a structure causes changes in vibration parameters such as natural frequencies and mode shapes. In this present study, natural frequencies are taken as the damage indicator because they are easier to measure than mode shapes. The objective function based on natural frequencies can be expressed as in Equation (6):
Particle Swarm Optimization (PSO)
PSO is a population based, bioinspired evolutionary optimization algorithm, originally introduced by Kennedy and Eberhart (Citation1995), which utilizes swarm intelligence to achieve the goal of optimization. The standard PSO algorithm models each member of the population as a “particle” that flies in a D-dimensional search space with a velocity that is dynamically updated by the particle’s own experience and the flying experience of its accompaniment. The members of the entire population share information among individuals to direct the search toward the best position in the search space.
Let N be the population size. In each generation k, the updated velocity Equation (7) and position Equation (8) of the particles are manipulated according to the following relations.
The local best value in PSO can be computed as:
Several techniques have been proposed for improving the rate of convergence of the PSO. These proposals usually involve changes to the PSO update equations, without changing the structure of the algorithm. The inertia weight (w) is a scaling factor associated with the velocity during the previous time step, resulting in a new velocity update every time as the particle moves in the search space. Empirical experiments have been performed in the past with an inertia weight decrease linearly from 0.9 (wmax) to 0.4 (wmin), as follows:
FIGURE 2 Variation of c1 and c2 with generation.
Nonlinearly Decreasing Inertia Weight PSO (NDW-PSO)
In the classical PSO, the inertia weight has been decreased linearly, as given in Equation (10). The performance of traditional PSO can be improved by varying the inertia weight nonlinearly, which enhances the convergence rate and accuracy effectively by retaining the advantages of the traditional PSO. The NDW-PSO (Begambre and Laier Citation2009) is modified as in Equation (11).
FIGURE 3 Variation of inertia weight (w) with generation (k) for different values of modulation; index (n).
FIGURE 4 Membership function for |Δσ|.
Fuzzy Adaptive PSO (APSO)
Another approach to modify the inertia weight is to use a dynamically adapted fuzzy system. The fuzzy system comprises three rules, with one input and one output. The input considered is the change in standard deviation of global best fitness and the output is the change in inertia weight.
Here, the fitness function is represented as Equation (12).
In the fuzzy algorithm, the fuzzy membership values of the change in standard deviation Δσ are calculated as follows:
The fuzzy rule base for determining weight change () is expressed as
Rule1: If |Δσ| is S, then |
| = rand ( ) × Δσ
Rule2: If |Δσ| is M, then |
Rule3: If |Δσ| is L, then |
The membership functions for fuzzy sets S (small), M (medium), and L (large) are given by
where rand ( ) are random numbers between [0 1], and 0 ≤ |Δσ| ≤ 1. Using the centroid defuzzification principle, the value of Δw is obtained as
Thus, the value of new weight w is given by Equation (14):
In this formulation, the influence of the past velocity of a particle on the current velocity is chosen to be random, and the inertia weight is adapted randomly depending on the variance of the fitness value of a population. This results in an optional coordination of local and global searching abilities of the particles.
Stopping Rule
The iterative procedure is terminated when a predefined number of generations or a computational error of 10−3 is reached.
Pseudocode for APSO
Step 1. Set the number of particles and number of generations. Randomly initialize the velocity and position of all the particles that correspond to a random crack location and depth and specify the upper and lower boundary of each variable.
Step 2. Obtain the fitness function of an individual particle from Equation (12).
Step 3. Obtain the standard deviation σ from Equation (13).
Step 4. Compute
Step 5. Update the iteration as k = k+1, velocity by Equation (7) and position by Equation (8).
Step 6. Each particle is evaluated according to its updated position only when satisfied by all constraints. If the evaluation value of each particle is better than the previous pbest, the current value is set to be
Step 7. Obtain the standard deviation σ from Equation (13).
Step 8. Obtain
Step 9. Update the inertia weight using Equation (14).
Step 10. If the stopping criterion is reached, then print the output results and stop; otherwise repeat Steps 5–9.
EXPERIMENTAL STUDIES
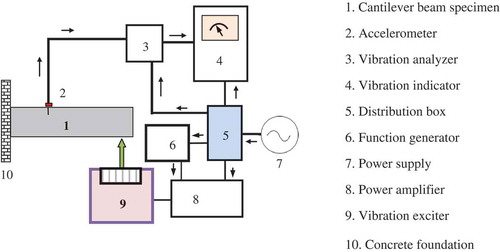
To verify the integrity of the proposed crack-detection method and to discover the errors associated with the modeling and measurements, several experiments also have been conducted in the laboratory. shows a schematic diagram of the experimental setup and its description. A cracked cantilever beam has been rigidly clamped to the concrete foundation base. The geometry and material properties of the beam are presented in . The free end of the beam is excited with a vibration exciter. The vibration exciter is excited by the signal from the function generator. The signal is amplified by a power amplifier before being fed to the vibration exciter. The amplitude of vibration of the uncracked and cracked cantilever beams is taken by the accelerometer and is fed to the vibration indicator for vibration analysis. The vibration signatures are analyzed graphically by vibration indicators.
FIGURE 5 Schematic block diagram of experimental setup for cantilever beam.
Several tests are conducted using the experimental setup on aluminum beam specimens (800 mm × 50 mm × 6 mm) with a transverse crack for determining the natural frequencies and mode shapes for different crack locations (i.e., 200 mm, 400 mm, and 600 mm from the clamped end) and crack depths varying from 1.2 mm to 3 mm by a step of 0.6 mm. The cracks were prepared by fine saw cuts perpendicular to the longitudinal axis. This ensures that the crack remains open during the vibrations. At each step, the first three bending natural frequencies of the cracked beams were measured. gives the corresponding bending natural frequencies of the intact and cracked beams. These specimens are set to vibrate under 1st, 2nd, and 3rd modes of vibrations and the corresponding amplitudes are recorded in the vibration indicator. Experimental results of frequencies of transverse vibration at various locations along the length of the beam are recorded by positioning the vibration pickup and tuning the vibration generator at the corresponding resonant frequencies.
TABLE 1 Measured Natural Frequencies for Single-Crack Cantilever Beam
PSO was employed to detect the crack utilizing the results from the experimental study. A comparison was made between the experimentally measured natural frequencies of the damaged beam and those obtained through the cracked beam model using the objective function, as discussed in “Nonlinearly Decreasing Inertia Weight PSO.”
RESULTS AND DISCUSSION
The Effect of Crack on Vibration Characteristics
In the present study, an aluminum beam has been considered for obtaining the changes in natural frequencies for different crack scenarios, using the analytical method. The geometry and material properties of the beam are presented in . The first three relative natural frequencies of a cracked beam versus relative crack location α (= Lc/L) for a crack of constant depth (β = b1/T = 0.2, 0.3, 0.4, and 0.5) have been presented in . It is seen that the relative frequency for mode-I is on an increasing trend, whereas the other two modes attain minimum and maximum at different crack locations. It is also apparent from that the deeper the crack is, the larger the drop in the natural frequencies.
TABLE 2 Material Properties and Geometry of Aluminium-Alloy- 2014-T4 Beam
FIGURE 6 Variation of relative frequencies with location and depth.
FIGURE 7 First mode frequency variations with crack depth.
shows the local changes in mode shapes due to the presence of the crack in the magnified form. These changes of mode shapes are prominent with the increase in severity of crack depths (β = 0.3, 0.4, and 0.5) for a given crack location (α = 0.125) in the beam.
FIGURE 8 Magnified view of jump in mode shape at the crack location for First mode of vibration.
The natural frequencies for different crack variables generated from the theoretical model, as summarized in , are used as input to demonstrate the robustness of the proposed algorithm and its performance. The simulated cracked natural frequencies calculated for each particle of PSO are used for the formulation of the objective function and constraints presented in the previous section as Equation 6.
TABLE 3 Crack Variables and Corresponding Natural Frequencies of the Beam
Performance Study of NDW-PSO
The performance of NDW-PSO depends upon the modulation index (n; Chatterjee and Siarry Citation2006). In the present study, the performance of NDW-PSO for different values of modulation index (n) were compared by determining the relative percentage of error between predicted and actual value using the following Equation (15).
The comparative results of the predicted crack location and depth under three different values of n varying from 0.4 to 1.4 was studied. However, the values obtained for 0.8, 1.0, and 1.2 are presented in . It can be seen that the best performing results are available when the nonlinear modulation index is set at 0.8. Besides an associated lower average error value, the convergence under this condition also occurs at lower generation numbers.
TABLE 4 Predicted Results of NDW-PSO vs. Test Values
Different crack conditions have been taken to evaluate the performance of various methods of PSO. Simulation results of six test points have been presented in this article.
and show the convergence trend of fitness values against number of generations for different crack locations and relative crack depths. The results for the successful cases of ten numbers of runs have been presented. In the present work, the first three natural frequencies are considered to determine the objective function. To allocate greater degree of importance to the lower modes, the weighting factors are assumed to be 1/i (Casciati Citation2008). It can be seen that convergence of the algorithm depends on the location and depth of the crack. From and , it can be seen that APSO converges with a fewer number of generations.
FIGURE 9 (a) loc = 200mm, dep = 1.8mm. (b) loc = 400mm, dep = 1.8mm. (c) loc = 600mm, dep = 1.8mm.
FIGURE 10 (a) loc = 200mm, dep = 2.4mm. (b) loc = 400mm, dep = 2.4mm. (c) loc = 600mm, dep = 2.4mm.
In order to investigate the effectiveness among the different PSO algorithms in the crack identification problem, the results obtained from different PSO algorithms are compared, as shown in . It can be seen that APSO is found to perform better than NDW-PSO, which in turn is better than PSO in terms of percentage error.
The maximum, mean, and standard deviation of the estimation errors are presented in . The error is calculated based on the Equation (15), and mean estimation errors for crack location and depth are equal to (0.163%, 0.979%) for the PSO, however, (0.110%, 0.383%), (0.046%, 0.040%) for NDW-PSO and APSO, respectively. From it can be inferred that APSO is more accurate compared to other forms of PSO.
The study was based on the results obtained using theoretical values for the cracked beam. In the following section, the algorithms were also tested for the laboratory experimental results obtained, as explained in the previous section. The results of natural frequencies measurements along with crack location and crack depth for seven experimental cases as shown in are considered for the comparison of the above PSO algorithm. The prediction of crack location, crack depth, and percentage error associated with different PSO algorithm are shown in . It can be seen that, per experimental results also, APSO was found to be better than NDW-PSO and PSO in terms of percentage error. However, it can be seen that there are more errors per experimental results () compared to theoretical results ().
TABLE 5 Error Estimation for Crack Location and Depth Using Different Methods of PSO
TABLE 6 Max, Mean, and Standard Deviation of Estimation Error
TABLE 7 Error Estimation for Crack Location and Depth Using Different Methods of PSO Through the Experimental Data
This might be due to error associated with measurements, material properties, and analytical method. It can also be seen that the errors associated with experimental results are less than 10% for APSO. The proposed methods have been applied to six damage cases obtained by combining three different crack positions and two different crack depths. It was also found that estimation error is reduced by increasing the crack depth for the same locations (). Also, by increasing the distance of the crack from the cantilevered end of the beam, the estimation error decreased for similar crack depth.
CONCLUSIONS
In this study, a novel, robust, nature-inspired particle swarm optimization technique is applied to assist detection of crack location and depth in a cantilever beam. The vibration signatures of the cracked beams are calculated using the theoretical model. Reasonable changes in natural frequencies due to the presence of the crack are effectively used to forecast structural damage detection using the proposed modified PSO. The proposed modified PSO with dynamic nonlinearly reducing inertia weight assists in increasing the convergence speed and accuracy of the NDW-PSO. A comparison is made for assessing the performance of NDW-PSO and APSO. Based on data derived from the theoretical model, the APSO was found to be associated with the least error for crack location and depth (0.0130%, 0.025%) compared to NDW-PSO with error (0.0411%, 0.050%) and PSO (0.083%, 0.125%). Similarly, based on laboratory experimental data, the error associated with APSO was found to be (6.84%, 6.83%) in comparison to (9.45%, 9.66%) for NDW-PSO and (10.18%, 10.33%) for PSO. Based on the present study, it can be concluded that the proposed APSO has the potential to be applied for fault diagnosis of various structures subjected to complex loading.
ACKNOWLEDGMENTS
The authors thank all reviewers who have helped to improve the quality of this article with their valuable comments.
Related Research Data
REFERENCES
- Begambre, O., and J. E. Laier. 2009. A hybrid particle swarm optimization – simplex algorithm (PSOS) for structural damage identification. Advances in Engineering Software 40:883–891.
- Caddemi, S., and A. Morassi. 2013. Multi-cracked Euler–Bernoulli beams: Mathematical modeling and exact solutions. International Journal of Solids and Structures 50(2013):944–956.
- Casciati, S. 2008. Stiffness identification and damage localization via differential evolution algorithms. Structure Control and Health Monitoring 15:436–449.
- Cawley, P., and R. D. Adams. 1979. Location of defects in structures from measurements of natural frequencies. Journal of Strain Analysis for Engineering Design 14:49–57.
- Chatterjee, A., and P. Siarry. 2006. Nonlinear inertia weight variation for dynamic adaptation in particle swarm optimization, Computers and Operation Researches 33:859–871.
- Chondros, T. G., A. D. Dimarogonas, and J. Yao. 1998. A continuous cracked beam vibration theory. Journal of Sound and Vibration 215:17–34.
- Clerc, M. 1999. The swarm and the queen: Towards a deterministic and adaptive particle swarm optimization. In Proceedings of the ICEC, 1951–1957. Washington, DC: ICEC.
- Dimarogonas, A. D., and C. Papadopoulos. 1983. Vibrations of cracked shafts in bending. Journal of Sound and Vibration 91:583–593.
- Dixit, A., and S. Hanagud. 2011. Single beam analysis of damaged beams verified using a strain energy based damage measure. International Journal of Solids and Structures 48:592–602.
- Doebling, S. W., C. R. Farrar, and M. B. Prime. 1998. A summary review of vibration based damage identification methods, The Shock and Vibration Digest 30(2):91–105.
- Haas, D. J., and C. G. Schaefer Jr. 1996. Emerging technologies for rotor system health monitoring, in: American Helicopter Society 52nd Annual Forum 2:1717–1731.
- Hu, N., H. Fukunaga, M. Kameyama, D. Roy Mahapatra, and S. Gopalakrishnan. 2007. Analysis of wave propagation in beams with transverse and lateral cracks using a weakly formulated spectral method. Journal of Applied Mechanics 74:119–127.
- Kang, F., Li Jun-jie, and Q. Xu. 2012. Damage detection based on improved particle swarm optimization using vibration data. Applied Soft Computing 12:2329–2335.
- Kennedy, J., and R. Eberhart. 1995. Particle swarm optimization. In Proceedings of the IEEE International Conference on Neural Networks 4:1942–1948.
- Khaji, N., M. Shafiei, and M. Jalalpour. 2009. Closed-form solutions for crack detection problem of Timoshenko beams with various boundary conditions. International Journal of Mechanical Sciences 51:667–681.
- Lin, H.-P. 2004. Direct and inverse methods on free vibration analysis of simply supported beams with a crack. Engineering Structures 26:427–436.
- Marinaki, M., Y. Marinakis, and G. E. Stavroulakis. 2010. Fuzzy control optimized by PSO for vibration suppression of beams. Control Engineering Practice 18:618–629.
- Mehrjoo, M., N. Khaji, and M. Ghafory-Ashtiany. 2013. Application of genetic algorithm in crack detection of beam-like structures using a new cracked Euler–Bernoulli beam element. Applied Soft Computing 13:867–880.
- Nahvi, H., and M. Jabbari. 2005. Crack detection in beams using experimental modal data and finite element method. International Journal of Mechanical Sciences 47:1477–1497.
- Qian, G. L., S. N. Gu, and J. S. Jiang. 1990. The dynamic behavior and crack detection of a beam with a crack. Journal of Sound and Vibrations 138(2):233–243.
- Richardson, M. H. 1980. Detection of damage in structures from changes in their dynamic (modal) properties: A survey ( NUREG/CR-1431, Washington, D.C.: US Nuclear Regulatory Commission).
- Sahin, M; and R. A. Shenoi. 2003. Quantification and localisation of damage in beam-like structures by using artificial neural networks with experimental validation. Engineering Structures 25:1785–1802.
- Sahoo, B., and D. Maity. 2007. Damage assessment of structures using hybrid neuro-genetic algorithm. Applied Soft Computing 7:89–104.
- Samanta, B., and C. Nataraj. 2009. Use of particle swarm optimization for machinery fault detection. Engineering Applications of Artificial Intelligence 22:308–316.
- Tada, H., P. C. Paris, and G. R. Irwin. 1973. The stress analysis of cracks hand book. Hellertown, PA: Del Research Corp.
- Vakil Baghmisheh, M. T., M. Peimani, M. H. Sadeghi, M. M. Ettefagh, and A. F.Tabrizi. 2012. A hybrid particle swarm-Nelder–Mead optimization method for crack detection in cantilever beams. Applied Soft Computing 12:2217–2226.
- Vakil-Baghmisheh, M. T., M. Peimani, M. H. Sadeghi, and M. M. Ettefagh. 2008. Crack detection in beam-like structures using genetic algorithms. Journal of Applied Soft Computing 8:1150–1160.
- Viola, E., L. Federici, and L. Nobile. 2001. Detection of crack location using cracked beam element method for structural analysis. Journal of Theoretical and Applied Fracture Mechanics 36:23–35.
- Wu, N., and Q. Wang. 2011. Experimental studies on damage detection of beam structures with wavelet transform. International Journal of Engineering Sciences 49:253–261.
- Yang, X. F., A. S. J. Swamidas, and R. Seshadri. 2001. Crack identification in vibrating beams using energy method. Journal of Sound and Vibration 224:339–357.
- Yuen, M. M. F. 1985. A numerical study of the eigenparameters of a damaged cantilever. Journal of Sound and Vibration 103:301–310.