
Abstract
Automatically measuring the similarity between a pair of objects is a common and important task in the machine learning and pattern recognition fields. Being an object of study for decades, it has lately received an increasing interest from the scientific community. Usually, the proposed solutions have used either a feature-based or a distance-based representation to perform learning and classification tasks. This article presents the results of a comparative experimental study between these two approaches for computing similarity scores using a classification-based method. In particular, we use the Support Vector Machine as a flexible combiner both for a high dimensional feature space and for a family of distance measures, to finally learn similarity scores. The approaches have been tested in a content-based image retrieval context, using three different repositories. We analyze both the influence of the different input data formats and the training size on the performance of the classifier. Then, we found that a low-dimensional, multidistance-based representation can be convenient for small to medium-size training sets, whereas it is detrimental as the training size grows.
INTRODUCTION
Learning a function that measures the similarity between a pair of objects is a common and important task in applications such as classification, information retrieval, machine learning, and pattern recognition. The Euclidean distance has been widely used because it provides a simple and mathematically convenient metric on raw features, even when dealing with a small training set, but it is not always the optimal solution for the problem being tackled (McFee and Lanckriet Citation2010). This has led to the development of numerous similarity learning techniques (Bar-Hillel et al. Citation2003; Davis et al. Citation2007) aimed to build a model or function that, from pairs of objects, produces a numeric value that indicates some kind of conceptual or semantic similarity and also allows ranking of objects in descending or ascending order according to this score.
Some studies have put their attention into automatically learning a similarity measure that satisfies the properties of a metric distance (Xing et al. Citation2002; Globerson and Roweis Citation2005) from the avalaible data (e.g., in the form of pairwise constraints obtained from the original labeled information) and have turned supervised metric learning into a topic of great interest (Bellet, Habrard, and Sebban Citation2012). Under this scope, when the properties of a metric are not required, a similar setting can also be used to train a classifier to decide whether a new pair of unlabeled objects is similar or not, an approach that is named classification similarity learning.
Classification similarity learning has traditionally represented the annotated objects in the training set as numeric vectors in a multidimensional feature space. It is also known that the performance of many classification algorithms is largely dependent on the size and the dimensionality of the training data. Hence, a question that arises is what the ideal size and dimension should be in order to obtain a good classification performance, considering that greater values generally yield to a better classification but at the cost of increasing the computational load and the risk of overfitting (Liu and Zheng Citation2006).
To deal with this issue, the dimensionality of the training data has been commonly reduced by using distance-based representations such as pairwise distances or (dis)similarities (Lee et al. Citation2010). It is also a frequent practice to use different (dis)similarity measures, each acting on distinct subsets of the muldimensional available features, which are later combined to produce a similarity score value. A number of combination techniques then exist, called fusion schemes, which have been categorized either as early or late fusion (Zhang and Ye Citation2009). Although the first uses a unified measure that merges all the features, the second computes multiple feature measures on a separate basis and then combines them to obtain the similarity between two objects.
Inspired by the late fusion scheme, in this study we use a multidistance representation that transforms the original feature space in a distance space resulting from the concatenation of several distance functions computed between pairs of objects. This kind of input data involves an additional knowledge injection to the classifier, because the use of a distance measure is an implicit match between the characteristics of two objects and also because of the usual correlation between semantic similarity and small values of distance. It is worth mentioning that this multidistance space is related to the dissimilarity space defined in Duin and Pekalska (Citation2012). Nevertheless, it differs from it in that the space transformation is carried out at a feature level between freely selected pairs of objects instead of using a fixed representation set.
The aim of this article is to compare the performance obtained from the feature-based and the multidistance-based representations when applied to a classification similarity learning setting as well as to analyze the influence of different training-data sizes. Thus, our goal is twofold: on the one hand, we want to study the ability of a classifier to deal with a high feature dimensionality when the training size grows; on the other hand, we want to test under which circumstances the reduction in dimensionality leads to better results than treating objects in their wholeness.
The proposed experimentation concerns the problem of content-based image retrieval (CBIR), in which image contents are characterized by multidimensional vectors of visual features (e.g., shape, color, or texture). By considering pairs of images labeled as similar or dissimilar as training instances, we face a binary classification problem that can be solved through a soft classifier that provides the probability of belonging to each class. This probability value can be considered as the score determining the degree of similarity between the images and it can be used for ranking purposes. In particular, the Support Vector Machine (SVM) classification algorithm has been selected, and we use different values for the Minkowski distance to construct two multidistance-based representations. Additionally, we use as baseline for our comparison the performances obtained from the global Euclidean distance and two other traditional score-based normalization methods: the standard Gaussian normalization and the min-max normalization.
The rest of the article is organized as follows: the next section formulates the problem and describes the multidistance-based representations in detail; “Evaluation” presents the experimental setting and analyzes the obtained results; the final section states the conclusions and discusses future work.
PROBLEM FORMULATION
Let us assume that we have a collection of images which are conveniently represented in an m-dimensional feature space
. Let us also assume that, when needed, this feature space can be defined as the Cartesian product of the vector spaces related to T different visual descriptors such as color, texture, or shape; see Equation (1).
Hence, we can represent as the set of features that correspond to descriptor t in xi. Let us finally consider a classical similarity learning setup (Xing et al. Citation2002; Globerson and Roweis Citation2005), in which k training pairs (xi, xj) are available that are accordingly labeled as similar (S) or dissimilar (D). In classification-based learning, these pairs are used to train a classifier that can later be able to classify new sample pairs. Thus, when it comes to using a soft classifier, its output will provide a score that may be used to judge the similarity between objects.
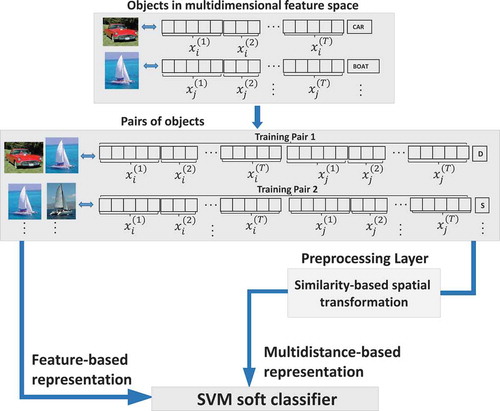
A straigthforward approach that fits this scheme is to concatenate the feature vectors of the objects and use the resulting double-size vector as the input to the classifier (see the arrow labeled “Feature-based representation” in ). However, by following this approach, the learning-problem size highly depends on the dimensionality of the feature space , which is usually rather large. This situation might be especially critical for small sample datasets, which, unfortunately, are often the case. The dimensionality of the input data can then be reduced by using feature reduction techniques such as principal or independent component analysis. Another way of tackling this problem is to apply a similarity-based spatial transformation (Duin and Pekalska Citation2012). In this work we evaluate the performance of two distance-based representations: Multidistance Lp and Multidistance L1. Both representations result from a preprocessing layer that acts before passing the training data to an SVM (see the arrow labeled “Multidistance-based representation” in ).
FIGURE 1 Feature-based and multidistance-based classification similarity learning approaches.
On the one hand, the Multidistance Lp representation derives from computing a family of N distance functions (e.g., Euclidean, cosine, or Mahalanobis) for every training pair. Each distance function is defined in each descriptor vector space as in Equation (2).
Thus, we define a transformation function w, as indicated in Equation (3), that constructs a tuple of values from the feature-based representation of two images xi and xj, where
denotes the distance between
and
.
The choice of the most suitable distance function depends on the task at hand and affects the performance of a retrieval system (Papa, Falcão, and Suzuki Citation2009). This has led different authors to analyze the performance of several distance measures for specific tasks (Aggarwal, Hinneburg, and Keim Citation2001; Howarth and Rüger Citation2005). Therefore, rather than choosing the most appropriate distance for a task, the proposed multidistance representation aims to boost performance by combining several distance functions simultaneously. This operation transforms the original data into a labeled set of N · T-tuples, where each element refers to a distance value, calculated on a particular subset of the features (i.e., the corresponding descriptor).
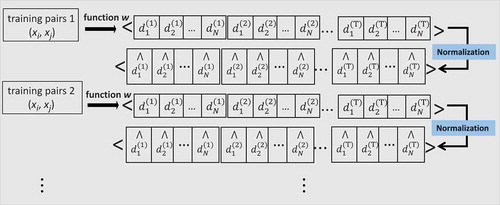
In order to increase the accuracy of the classification (Vert, Tsuda, and Schölkopf Citation2004) by placing equal emphasis on each descriptor space (Ali and Smith-Miles Citation2006), we normalize the labeled tuples through a simple linear scaling operation into range [0, 1]. A complete schema of the input data transformation done by the preprocessing layer can be seen in .
FIGURE 2 Scheme of the preprocessing layer in the Multidistance Lp representation.
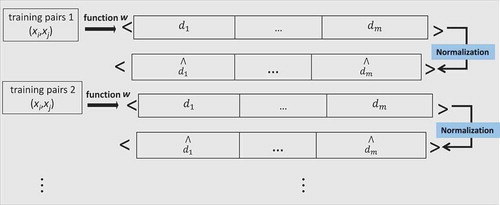
However, the Multidistance L1 representation is constructed by separately calculating the L1 distance function (i.e., the Manhattan distance) for every feature of each pair of images in the training set. Hence, the distance function can be defined as in Equation (4). Note that this representation is more simple and generic than the previous one, because it does not require the images to be described by a set of visual descriptors.
In turn, we define a transformation function w′ as indicated in Equation (5) that, given the feature-based representation of two images xi and xj, constructs a tuple of values . Again, we normalize the labeled tuples
by means of a simple linear scaling operation into range [0, 1] as shown in .
FIGURE 3 Scheme of the preprocessing layer in the Multidistance L1 representation.
Once the SVM soft classifier has been trained, it can be used to provide a score value that can be treated as a similarity estimation between images. For any new pair (xi, xj), function w or w′ is applied to convert the original features into a tuple of distances (using the same distance functions as for training). After normalization, the resulting vector is used as input to the classifier, which provides a confidence estimation that the pair belongs to any of the classes. This estimate can be used directly for ranking purposes, or converted into a probability value by using the method in Platt (Citation1999).
EVALUATION
Databases
To analyze the performance of the SVM classifier for the feature-based and the multidistance-based training-data formats, a number of experiments have been carried out using three different datasets, which are representative of a range of different situations and have also been used in other previous studies, e.g., (Arevalillo-Herráez and Ferri Citation2013; Arevalillo-Herráez et al. Citation2008). All datasets follow a similar structure in which each entry contains a feature vector and a label. Accordingly, each feature vector corresponds to the feature representation of an image through a set of visual descriptors. The label refers to the semantic concept that the image represents, according to a manual classification. The details about the databases are as follows:
A database called “Small” containing 1508 pictures, some of which were extracted from the Web and others were taken by the members of the research group. These have been manually classified as belonging to 29 different semantic concepts such as flowers, horses, paintings, skies, textures, ceramic tiles, buildings, clouds, trees, etc. This database and corresponding labels have also been used in de Ves et al. (Citation2006) and Len et al. (Citation2007), where further details can be found. In this case, the descriptors include a 10 × 3 histogram specification (HS) color histogram and texture information in the form of two granulometric cumulative distribution functions (Soille Citation2003).
A subset of 5476 images named “Art,” from the large commercial collection called “Art Explosion,” composed of a total of 102,894 royalty free photographs.Footnote1 The images from the original repository, organized into 201 thematic folders, have been classified into 62 categories; images have been carefully selected so that those in the same category represent a similar semantic concept. The features that have been computed for these pictures are the same as those extracted for the Small database.
A subset of the Corel database used in Giacinto and Roli (Citation2004). This is composed of 30,000 images that were manually classified into 71 categories. The four image descriptors used are (1) a 9-dimensional vector with the mean, standard deviation, and skewness for each hue, saturation, and value in the HSV color space; (2) a 16-dimensional vector with the co-occurrence in horizontal, vertical, and the two diagonal directions; (3) a 32-dimensional vector with the
color HS histograms for each of the resulting subimages after one horizontal and one vertical split; and (4) a 32-dimensional vector with the HS histogram for the entire image.
A summary of the main characteristics of the three databases is given in .Footnote2
TABLE 1 A Summary of the Three Datasets Used in the Experiments
Experimental Setting
The classification similarity learning approaches have also been compared with three other traditional score methods, which have been used as baseline. The first is the global Euclidean distance applied on the entire feature vectors. The second is the standard Gaussian normalization as described in Iqbal and Aggarwal (Citation2002), which consists of a mapping function , where μ and σ represent the mean and the standard deviation of the Euclidean distance on each descriptor vector space
. The third is the min-max normalization, which performs a linear transformation on data computing the minimum and the maximum of the distance
. The last two approaches are both applied to the individual visual image descriptors and will be referred to as Gaussian normalization and min-max normalization, respectively. The experiments were run 50 times each and the results were averaged.
To evaluate the influence of the training size, the experiments were run over six training sets with increasing sizes. The smallest training set had 250 pairs, the next one had 500 pairs, and the remaining training sets increased their size sequentially from 1000 up to 4000 with steps of 1000 pairs. In each training set, the pairs were labeled as similar (S) when the labels associated with the vectors were the same, and as dissimilar (D) otherwise.
After the training phase, if any, the ranking performance of each algorithm was assessed on a second different and independent test set composed of 5000 pairs randomly selected from each repository. To this end, the mean average precision (MAP), one commonly used evaluation measure in the context of information retrieval (Thomee and Lew Citation2012), was used. The MAP value corresponds to a discrete computation of the area under the precision-recall curve. Thus, by calculating the mean average precision we had a single overall measure that provided a convenient trade-off between precision and recall along the whole ranking.
For the Multidistance Lp representation, we have considered a pool composed of four Minkowski distances, Lp norms, with values . These are widely used dissimilarity measures that have shown relatively large differences in performance on the same data (Aggarwal, Hinneburg, and Keim Citation2001; Howarth and Rüger Citation2005), and hence, suggest that they may be combined to obtain improved results. Fractional values of p have been included because they have been reported to provide more meaningful results for high-dimensional data, both from the theoretical and empirical perspective (Aggarwal, Hinneburg, and Keim Citation2001), a result that has also been confirmed in a CBIR context (Howarth and Rüger Citation2005). Note also that the Multidistance L1 representation uses just the Minkowski distance with parameter value
.
In addition, the kernel chosen for the SVM has been a Gaussian radial basis function. The parameters and C have been tuned by using an exhaustive grid search on a held-out validation set composed of a 30% partition of the training data (
and
). To compensate for the SVM sensitivity to unbalanced datasets, (Köknar-Tezel and Latecki Citation2011), we also conducted an initial study to determine the most adequate proportion of similar/dissimilar pairs in the training set. This was done for each database, and the best performance in the Small and Art databases is achieved when the percentage of similar pairs in the training set is around 30%. In the Corel database this percentage raises to 50% because of the larger size of this database.
RESULTS
In this section, we compare the performance of the feature-based and multidistance-based representations presented in this article to carry out classification similarity learning. , , and plot the average MAP as a function of the training size for each database, also including the MAP values obtained for the baseline methods, where no learning is involved.
FIGURE 4 Average MAP vs. training set size for the Small database.
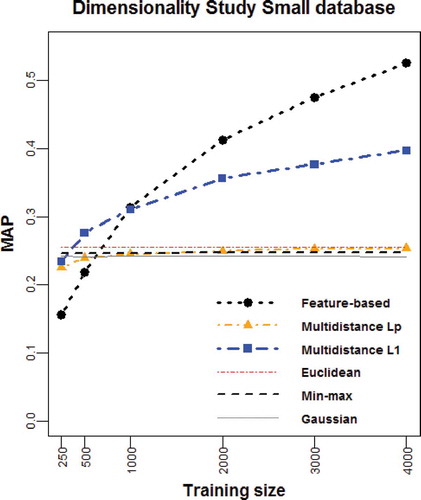
FIGURE 5 Average MAP vs. training set size for the Art database.
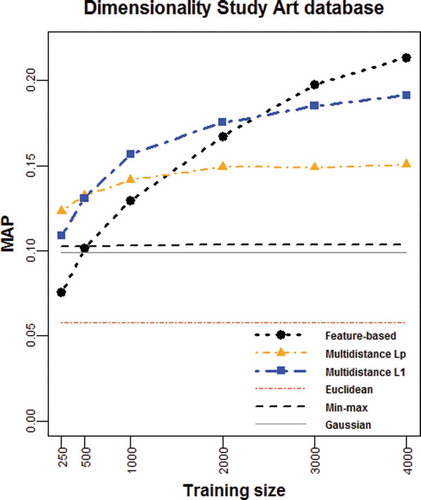
FIGURE 6 Average MAP vs. training set size for the Corel database.
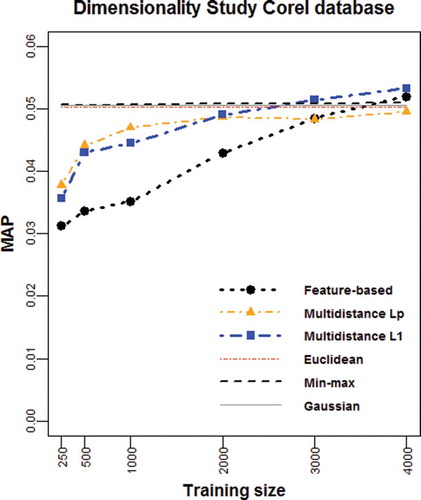
The plots reveal that, in general terms, the multidistance-based representations outperform the feature-based representation in the presence of small to medium-size training sets. However, when the number of training pairs is large enough, using the original image features leads to higher MAP values. The location of the cutoff point as well as other particularities depend on the characteristics of each database (i.e., size, categories and visual descriptors) as described following.
For the Small database, the Multidistance L1 representation performs better than the feature-based representation when using fewer than 1000 training pairs (see ). Though, it is worth noting that this representation is outperformed by all the baseline methods in the extreme case of not having enough information for training the classifier (i.e., fewer than about 300 pairs). The Multidistance Lp representation shows a limited learning capacity in this database, because the MAP values obtained before reaching the cutoff point with the feature-based representation (i.e., around 600 pairs) are lower than those of the baseline methods. When we allow the training size to become large enough (i.e., beyond 1000 pairs), the classical feature-based representation improves the results that can be obtained from the rest of the algorithms. Under this circumstance, the information loss incurred by the multidistance-based representations is detrimental because it limits the learning capabilities of the SVM classifier.
The Art database shows better results for the Multidistance Lp representation, which is the most interesting option for training sets composed of up to 500 pairs (see ). The Multidistance L1 representation produces the highest MAP values and outperfoms the feature-based representation in the interval ranging from 500 to, approximately, 2400 training pairs. Then again, the feature-based representation casts the best results when dealing with training sets of higher dimensionality. Overall, in this dataset, all the proposed classification similarity learning techniques perform better than the baseline methods.
Finally, the results for the Corel database show a similar ordering when focusing on the feature-based and the multidistance-based representations (see ). That is, the Multidistance Lp representation marginally outperforms the Multidistance L1 representation for training sizes smaller than 2000 pairs. Then, the Multidistance L1 representation works better than the feature-based representation although not reaching the cutoff point that, in this case, falls out of the plot. However, if we rightly consider the high MAP values obtained from the baseline methods, we see how difficult it is to learn a classification model in this database without having a significant number of training pairs. Apart from the larger size of this database, the main reason behind such a behavior is the higher subjectivity of its classification where different criteria have been applied (also by different people) that results in a classification that considers similar concepts under different labels. As an example, the Corel database includes Insects I and Insects II as two different categories and, as a result, our experimental setting considers images in these two groups as dissimilar even though they have very similar visual descriptors.
In spite of this singularity, all in all, the results obtained demonstrate that the training size has an important effect on the classification performance when we adopt different strategies for the representation of input data.
CONCLUSION
In this paper we have conducted an experimental study comparing two approaches for learning similarity scores in a multidimensional feature space using a classification-based method as the SVM. The difference between these approaches is based on the representation format followed by the sample dataset that is used to train the classifier. On the one hand, a feature-based representation of objects can have as a drawback the high dimensionality of the learning problem that it poses to the classifier. On the other hand, a multidistance-based representation can reduce the dimensionality by transforming the original multidimensional space in a distance space in a distance space constructed as the concatenation of distance functions.
A series of performance patterns has been extracted from the analysis of the different input data formats and the training size. We found that a low-dimensional multidistance-based representation can be convenient for small to medium-size training sets, whereas it is detrimental as the training size grows. The dimensionality reduction (e.g., in the form of distances relations and their combination) supposes additional information sent to the classifier and boosts its performance. For large training sets, though, a higher dimensional feature-based representation provides better results for the database considered. This result can be of value when designing future systems that need to automatically capture the similarity of pairs of objects.
Future work will extend this study by including further investigation to consider more distance combinations as well as other suitable techniques to reduce the dimensionality of the training set and to finally improve the performance of classifiers.
ACKNOWLEDGMENT
We would like to thank Juan Domingo for extracting the features from the images in the database.
FUNDING
This work has been supported by the Spanish Ministry of Science and Innovation through project TIN2011-29221-C03-02.
Additional information
Funding
Notes
1 Distributed by Nova Development (http://www.novadevelopment.com).
2 The interested reader can find more details about the databases at http://www.uv.es/arevalil/dbImages/ and http://kdd.ics.uci.edu/databases/CorelFeatures.
REFERENCES
- Aggarwal, C., A. Hinneburg, and D. Keim. 2001. On the surprising behavior of distance metrics in high dimensional space. In Database theory ICDT, Lecture Notes in Computer Science 1973:420–434, ed. J. Bussche and V. Vianu. Berlin, Heidelberg: Springer.
- Ali, S., and K. Smith-Miles. 2006. Improved support vector machine generalization using normalized input space. In AI 2006: Advances in artificial intelligence, Lecture Notes in Computer Science 4304:362–371. Berlin, Heidelberg: Springer.
- Arevalillo-Herráez, M., and F. J. Ferri. 2013. An improved distance-based relevance feedback strategy for image retrieval. Image and Vision Computing 31(10):704–713.
- Arevalillo-Herráez, M., M. Zacarés, X. Benavent, and E. de Ves. 2008, August. A relevance feedback CBIR algorithm based on fuzzy sets. Image Communication 23(7):490–504.
- Bar-Hillel, A., T. Hertz, N. Shental, and D. Weinshall. 2003. Learning distance functions using equivalence relations. In Proceedings of the 20th international conference on machine learning, 11–18. ICML.
- Bellet, A., A. Habrard, and M. Sebban. 2012. Similarity learning for provably accurate sparse linear classification. In Proceedings of the 29th international conference on machine learning, 1871–1878. Edinburgh, Scotland: ICML.
- Davis, J. V., B. Kulis, P. Jain, S. Sra, and I. S. Dhillon. 2007. Information-theoretic metric learning. In Proceedings of the 24th international conference on machine learning (ICML), 227:209–216, ed. Z. Ghahramani. New York, NY, USA: ACM.
- de Ves, E., J. Domingo, G. Ayala, and P. Zuccarello. 2006. A novel Bayesian framework for relevance feedback in image content-based retrieval systems. Pattern Recognition 39(9):1622–1632.
- Duin, R. P. W., and E. Pekalska. 2012, May. The dissimilarity space: Bridging structural and statistical pattern recognition. Pattern Recognition Letters 33(7):826–832.
- Giacinto, G., and F. Roli. 2004. Nearest-prototype relevance feedback for content based image retrieval. In Proceedings of 17th international conference on the pattern recognition, (ICPR), 2:989–992. Washington, DC, USA: IEEE Computer Society.
- Globerson, A., and S. T. Roweis. 2005. Metric learning by collapsing classes. In Advances in neural information processing systems 18 (NIPS). Cambridge, MA, USA: MIT Press.
- Howarth, P., and S. Rüger. 2005. Fractional distance measures for content-based image retrieval. In Proceedings of the 27th European conference on advances in information retrieval research (ECIR), 447–456. Berlin, Heidelberg: Springer-Verlag.
- Iqbal, Q., and J. K. Aggarwal. 2002. Combining structure, color and texture for image retrieval: A performance evaluation. In 16th international conference on pattern recognition (ICPR), 438–443. Washington, DC, USA: IEEE Computer Society.
- Köknar-Tezel, S., and L. J. Latecki. 2011. Improving SVM classification on imbalanced time series data sets with ghost points. Knowledge and Information Systems 28(1):1–23.
- Lee, W.-J., R. P. W. Duin, A. Ibba, and M. Loog. 2010. An experimental study on combining Euclidean distances. In Proceedings 2nd international workshop on cognitive information processing, 304–309. IEEE.
- Len, T., P. Zuccarello, G. Ayala, E. de Ves, and J. Domingo. 2007. Applying logistic regression to relevance feedback in image retrieval systems. Pattern Recognition 40(10):2621–2632.
- Liu, Y., and Y. F. Zheng. 2006. FS_SFS: A novel feature selection method for support vector machines. Pattern Recognition 39(7):1333–1345.
- McFee, B., and G. R. G. Lanckriet. 2010. Metric learning to rank. In Proceedings of the 27th international conference on machine learning (ICML), 775–782. Omnipress.
- Papa, J. P., A. X. Falcão, and C. T. N. Suzuki. 2009. Supervised pattern classification based on optimum-path forest. International Journal of Imaging Systems and Technology 19(2):120–131.
- Platt, J. C. 1999. Probabilistic outputs for support vector machines and comparisons to regularized likelihood methods. In Advances in large margin classifiers, 61–74. Cambridge, MA, USA: MIT Press.
- Soille, P. 2003. Morphological image analysis: Principles and applications (2nd ed.). Secaucus, NJ, USA: Springer-Verlag New York.
- Thomee, B., and M. S. Lew. 2012. Interactive search in image retrieval: A survey. International Journal of Multimedia Information Retrieval 1(2):71–86.
- Vert, J., K. Tsuda, and B. Schölkopf. 2004. A Primer on kernel methods, 35–70. Cambridge, MA, USA: MIT Press.
- Xing, E. P., A. Y. Ng, M. I. Jordan, and S. J. Russell. 2002. Distance metric learning with application to clustering with side-information. In Advances in neural information processing systems 15 (NIPS), 505–512. Cambridge, MA, USA: MIT Press.
- Zhang, J., and L. Ye. 2009. Local aggregation function learning based on support vector machines. Signal Processing 89(11):2291–2295.