
Abstract
Recent developments in man–machine interaction have increased the need for recognizing human emotion from speech. The present study aimed to classify the highly confused emotions, anger and joy, using Nonlinear Dynamic features (NLDs). The proposed NLDs are extracted from the geometrical properties of reconstructed phase space of speech. A linear support vector machine is employed to classify emotional speech signals. The recognition rates of 99.1% and 98.85% were achieved on the Berlin database for females and males, respectively. The proposed system can also be employed as an error-correction procedure to reduce ambiguity between anger and joy in multiemotional problems. We show that applying this strategy on a selected multiemotional system significantly improves the overall recognition rate from 91.59% to 94.58%. These results reveal the capability of the proposed NLDs to classify highly confused emotions, joy and anger.
INTRODUCTION
Recent developments in man–machine interaction have increased the need for distinguishing human emotion from biological signals. Because speaking is the most used method of communication, recognizing the emotional state of the speaker from his/her speech can help make a natural and efficient interaction. This has introduced a relatively new field of research in speech processing known as Speech Emotion Recognition (SER). SER can be considered as a pattern recognition problem, which includes three main stages: feature extraction, feature reduction, and classification.
Despite widespread efforts, finding effective features is still one of the main challenges in SER. Most acoustic features that have been employed for emotion recognition can be grouped into two categories: prosodic features and spectral features. Prosodic features, which are widely used in SER, have been shown to offer important emotional cues about the speaker (Altun and Polat Citation2009; Bitouk, Verma, and Nenkova Citation2010; ElAyadi, Kamel, and Karray Citation2011; Kamaruddin, Wahab, and Quek Citation2011; Rong, Li, and Phoebe Chen Citation2009; Wu, Falk, and Chan Citation2011). These features are usually derived from pitch and energy contours using time-domain analysis techniques.
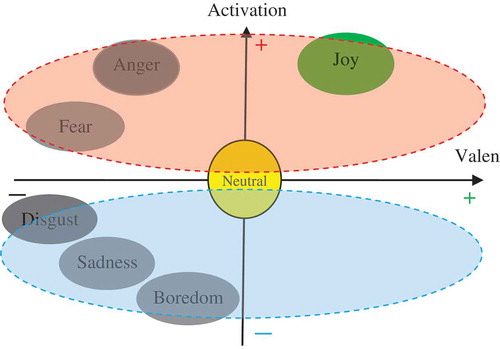
In recent years, spectral features, which are generally obtained from the speech spectrum, have received increased attention. These features have improved the rate of recognition by providing complementary information for prosodic features (Wu, Falk, and Chan Citation2011). But, most of the aforementioned acoustic features are related to arousal (Kim et al. Citation2009). This suggests that the most emotional features are not discriminative for valence-related emotions such as anger and joy (Grimm, Kroschel, and Narayanan Citation2007; Kim et al. Citation2009; Wu, Falk, and Chan Citation2011). shows the location of different emotions in the two-dimensional arousal–valence spaces (Cowie et al. Citation2001).
FIGURE 1 Two-dimensional arousal–valence emotion space.
The ambiguity in classification of this pair is responsible for a majority of errors in many SER systems. Therefore, it seems that it is necessary to extract effective features for classifying joy versus anger. Both prosodic and spectral features are commonly computed based on the traditional linear source-filter model of the speech production system (Huang, Acero, and Hon Citation2001). It is believed that there exist significant nonlinear 3D fluid dynamics phenomena during speech production that are not taken into account by the linear model (Sauer, Yorke, and Casdagli Citation1991; Takens Citation1981; Teager and Teager Citation1989). So, it seems that nonlinear analytical tools could be efficient to fill the enormous gap between linear deterministic models and random, complicated, and strongly unpredictable processes.
Phase space reconstruction (PSR), which has been offered by nonlinear dynamics, is a powerful predictive-modeling technique applied to chaotic dynamical systems. In the last decade, PSR has been proposed for various speech processing applications such as speech recognition (Indrebo, Povinelli, and Johnson Citation2006; Prajith Citation2008), speech enhancement (Johnson et al. Citation2003; Sun, Zheng1, and Wang Citation2007), and detecting sleepiness from speech (Krajewski et al. Citation2012); but, to our knowledge, there is not extensive research on the effectiveness of PSR in SER.
The main contribution of this work is the employment of nonlinear dynamics features (NLDs), which are extracted from the geometrical characteristics of the PSR. The PSR-based features are extracted from speech signals, for classifying a highly confused valence-related emotions pair: anger vs. joy. Moreover, the proposed classifier is suggested to be used as a cascade system with a multiemotion recognition SER system in order to reduce the confusion between the two emotions anger vs. joy.
The remainder of this article is as follows. The next section presents the phase space reconstruction of speech. In “Features Extraction,” we explain the NLDs proposed in this work, as well as prosodic and spectral features extracted for comparison purposes. “Emotional Speech Data” introduces the database employed. Experimental results are presented and discussed in “Experiments.” Finally, “Conclusion” gives concluding remarks.
PHASE SPACE RECONSTRUCTION FOR SER
According to Taken’s embedding theorem (Takens Citation1981), for a time series xn, n = 1,2,3,4 … N, PSR can be produced by creating vectors given by:
In order to estimate an optimal time lag (τ) for our study, the first zero of an autocorrelation function or the first minimum of an automutual function is used (Fraser Citation1989). This provides the maximum independence of dimensions in PSR space. The minimum embedding dimension is also determined by employing the false nearest neighbor algorithm (Hong-guang and Chong-zhao Citation2006).
The process of producing speech can be treated as a dynamical system with a one-dimensional time series data, so the nonlinear dynamics of the system can be modeled by PSR (Prajith Citation2008). In applications such as speech recognition, the objective is to classify short segments of speech (e.g., phonemes) using frame-level features. In such cases, the speech signal is commonly segmented into short frames, and then the proper time lag (τ) and embedding dimension (d) are determined for each frame individually in order to represent it in the phase space. Finally, the frame-level features are extracted from the PSRs. In the utterance-level analysis techniques, such as detecting sleepiness from speech, (Krajewski et al. Citation2012) or emotion recognition, the speech signal is classified entirely using utterance-level features, so it is common to choose a suboptimal τ and d to reconstruct the entire speech signal in the phase space. Here, we set the τ and d to 1 and 3, respectively, as suggested in (Krajewski et al. Citation2012). Considering τ = 1, the equation of identity line in the reconstructed phase space is written as:
shows the phase space representation of four German sentences uttered by four different speakers in anger (left column) and joy (right column). In this figure, the first two rows belong to two males and the last two rows belong to two females. The sentences are chosen from the Berlin emotional database (Burkhardt et al. Citation2005).
FIGURE 2 PSR (with τ = 1 and d = 3) of four German sentences; (a), (c): Two males expressed two sentences in anger. (b), (d): Two males expressed two sentences in joy. (e), (g): Two females expressed two sentences in anger. (f), (h): Two females expressed two sentences in joy.
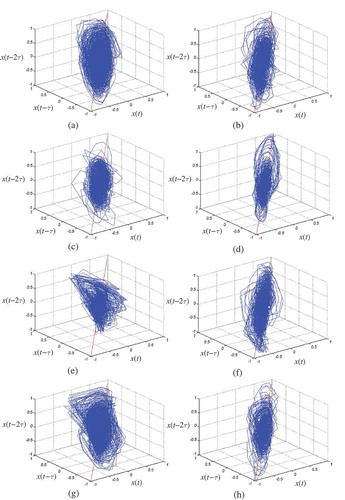
As seen from , the shape of PSR dramatically differs for anger and joy emotions. For instance, the trajectories of joy sentences appear along the identity line whereas the trajectories of anger sentences are scattered across the space. This result is promising for us to be able to extract vital emotional information from PSR for classifying anger vs. joy.
FEATURES EXTRACTION
In this section, the proposed NLDs extracted from the PSR are explained in detail. Prosodic and spectral features used in this study are also described. These features represent the essential features. The aforementioned features are used here as a benchmark, and more importantly, to verify whether the NLDs can serve as useful additions to the widely used prosodic and spectral features.
Nonlinear Dynamics Features
In this method, the geometrical properties of PSR are represented by four trajectory-based descriptor contours. The first descriptor contour is the distance to the centroid of the attractor (Krajewski et al. Citation2012):
The second contour refers to the length of trajectory legs (Krajewski et al. Citation2012):
The third represents the current angle between consecutive trajectory legs (Krajewski et al. Citation2012):
And, finally, the last descriptor, which is proposed to be used in this work, is the distance to the identity line of the points, denoted as
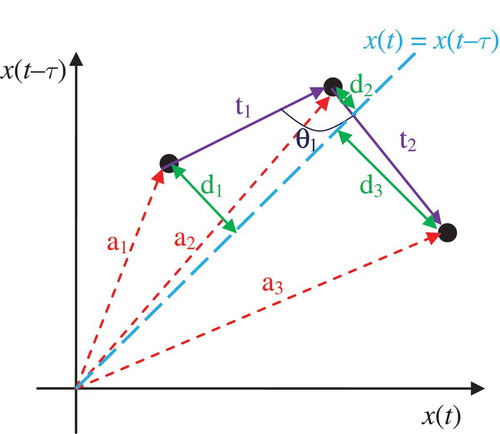
As described in “Phase Space Reconstruction for SER,”, the amplitude of this curve is highly correlated to the rate of changes between consecutive samples in the original signal. shows the attractor-forming trajectory of three consecutively following vectors a1, a2, and a3 and geometrical properties of this attractor on a typical two-dimensional phase space.
FIGURE 3 Attractor forming trajectory of three consecutively following vectors a1, a2 and a3 and geometrical properties of this attractor describing values: angle between consecutive trajectory parts (θ), the distance to the centroid of the attractor (a1, a2, and a3), the length of trajectory leg (t1 and t2), and the distance to the identity line (d1, d2, and d3).
In this study, the proposed NLDs are extracted from these four descriptor contours using two different methods. In the first method, as a common technique, 20 time-domain functions are applied to capture the statistical information of descriptor contours. These functions include: min, max, range, mean, median, trimmed mean 10%, trimmed mean 25%, 1st, 5th, 10th, 25th, 75th, 90th, 95th, and 99th percentile, interquartile range, average deviation, standard deviation, skewness and kurtosis (Krajewski et al. Citation2012; Schuller et al. Citation2008). These functions are also applied to the first and second derivatives of the contours as a common practice. So, the process provides a 240-dimensional feature vector containing NLDs for each input speech signal. We refer to these types of features as NLD(1).
In the second method, the discrete cosine transform (DCT) is used to compact the information of the descriptor contours. Then, significant DCT coefficients (the first 200 coefficients) of each descriptor contour form the second type of NLDs referred to as NLD(2). So, there are 800 NLD(2) features for each input waveform. The block diagram of extracting NLDs is shown in .
FIGURE 4 Process of extracting nonlinear dynamics features (NLDs).
In this study, the proposed NLDs are extracted from the original speech signal, voiced parts of speech signal, unvoiced parts of speech signal, glottal excitation waveform, pitch contour, and energy contour. Voiced and unvoiced parts of speech are separated by thresholding on energy and zero-crossing rate (ZCR) contours. Glottal excitation is determined using an inverse filtering method (Drugman, Bozkurt, and Dutoit Citation2011), and pitch is estimated for voiced parts of speech using the autocorrelation-based pitch tracking algorithm (Gonzalez and Brookes Citation2011). So, in total, NLD(1) and
NLD(2) features are extracted from a spoken sentence.
Prosodic Features
Prosodic features are the most widely used features in SER (Altun and Polat Citation2009; Bitouk, Verma, and Nenkova Citation2010; El Ayadi, Kamel, and Karray Citation2011; Kamaruddin, Wahab, and Quek Citation2011; Rong, Li, and Phoebe Chen Citation2009; Wu, Falk, and Chan Citation2011). They are commonly based on pitch, energy, and speaking rate. In order to extract these types of features, it is common to use statistical properties of pitch and energy-tracking contours. In this work, the 20 time domain functions described in “Nonlinear Dynamics Features” are employed to extract features from these contours and their first and second derivatives. The ratio between the duration of voiced and unvoiced speech is also used as a timing-based feature. So, we have in total 60 pitch-based features and 60 energy-based features in addition to one timing-based feature.
The commonly used ZCR and the Teager energy operator (TEO) (Kaiser Citation1990) of the speech signal are also examined here. These features do not directly relate to prosody, but in this work we evaluate their performance along with prosodic features. TEO conveys information about the nonlinear airflow structure of speech production (Zhou, Hansen, and Kaiser Citation2001). The TEO for a discrete-time signal xn is defined as
In order to extract ZCR and TEO related features, we apply the 20 statistical functions to ZCR and TEO curves and their deltas and double deltas. Finally, we have prosodic features.
Spectral Features
In this study, we employ two types of spectral features: the mel-frequency cepstral coefficients (MFCCs) and formants. These features are successfully applied to automatic speech recognition and reported as effective spectral features for emotion recognition (Polzehl et al. Citation2011; Lee et al. Citation2011; He et al. Citation2011; Laukka et al. Citation2011). The speech signal is first filtered by a high-pass filter with a preemphasis coefficient of 0.97, and the first 12 MFCCs and 4 formants are extracted from 20 ms Hamming-windowed speech frames every 10 ms, and so their contours are formed. Then, the 20 functions described in “Nonlinear Dynamics Features” are applied to extract their statistical features. The features are also extracted from the delta and double-delta contours. In total, spectral features are extracted in this work. All features employed here are listed in .
TABLE 1 List of Extracted Features
EMOTIONAL SPEECH DATA
The final goal of an SER system is to recognize the emotional state of the natural speech, but developing natural speech databases is very expensive and they are commonly restricted (Albornoz, Milone, and Rufiner Citation2011). Thus, despite the crucial role of the database in emotion recognition (Yang and Lugger Citation2010), a large number of the researchers who study this topic use acted (opposed to fully natural emotional) databases for SER experiments. The Berlin database of German emotional speech (Burkhardt et al. Citation2005) is a pretty small and public database, and the performances of many algorithms have been evaluated using this database (Albornoz, Milone, and Rufiner Citation2011; Altun and Polat Citation2009; Bitouk, Verma, and Nenkova Citation2010; Kamaruddin, Wahab, and Quek Citation2011; Wu, Falk, and Chan Citation2011). Therefore, we use this database to test our classifier. This database consists of 535 utterances in ten different contexts, which are expressed by ten professional actors (five males and five females) for seven emotions. The numbers of speech utterances for the emotion categories are listed in .
TABLE 2 Number of Utterances in the Berlin Database
EXPERIMENTS
In this section, the results of the experimental evaluation are presented. Linear Support Vector Machine (SVM) (Vapnik Citation1995) is used for recognition of anger vs. joy. In this study, it is assumed that a gender classifier with perfect classification accuracy, which is proposed by (Kotti and Kotropoulos Citation2008), is utilized in the first stage, so the system is implemented completely separately for males and females. Features from training data are linearly scaled to [−1, 1] before applying SVM. As suggested in (Hsu, Chang, and Lin Citation2007), features from test data are also scaled using the trained linear mapping function.
Here, results are produced using 10-fold cross-validation. In this method, the data is parted based on random sampling of data from a pool wherein all samples are mixed. In each class, samples have been randomly divided into 10 nonoverlapping subsets approximately equal in size. In each validation trial, nine subsets from each class are taken for training, and the remaining one is kept unseen until the testing phase. The training and testing procedure for one trial is schematically shown in .
FIGURE 5 The training and testing procedure in one trial.
The feature selection scheme is described in the following subsection. The proposed NLDs are compared to prosodic and spectral features in terms of FDR score and classification accuracy. We consider different combinations of these features in order to find the most efficient feature set. Finally, our proposed classifier is employed as an error correction procedure to improve the accuracy of the existing SER systems.
Feature Selection
Removing irrelevant features is an important task undertaken to avoid the curse of dimensionality (Bishop Citation2006). To this end, we employ a filter-based feature selection scheme to discard irrelevant features. In this method, the features are filtered according to the Fisher discriminant ratio (FDR) (Guyon and Elisseeff Citation2003). The FDR evaluates individual features by means of measuring the interclass distance against the intraclass similarity for each feature. The two-class FDR for the uth feature is defined as (Duda, Hart, and Stork Citation2001)
Comparison of Proposed NLDs with Prosodic and Spectral Features
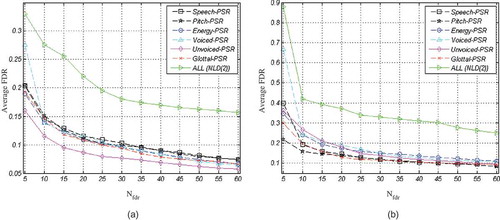
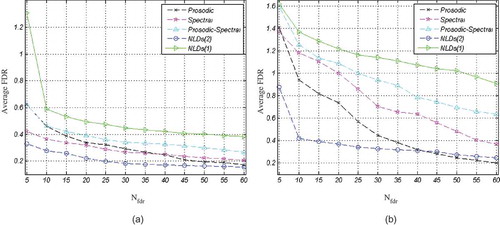
The features proposed for classification of joy from anger are first compared to prosodic and spectral features, using FDR criterion before applied to the classifier. To this end, the features are ranked by their FDR values using all samples in the Berlin database, and then, the FDR values are averaged over the top Nfdr FDR-ranked features. to show the average FDR curves as a function of Nfdr for prosodic, spectral, NLD(1), and NLD(2) features, respectively. These curves illustrate discrimination power of the four feature types, regardless of the utilized classifier.
FIGURE 6 Average FDR for the prosodic features, (a) Females, and (b) Males.
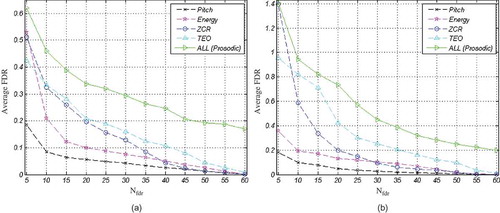
FIGURE 7 Average FDR for the spectral features, (a) Females, and (b) Males.
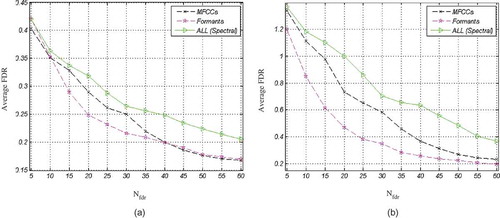
FIGURE 8 Average FDR for the proposed NLD(1) features, (a) Females, and (b) Males.
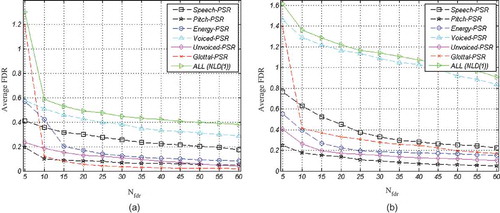
FIGURE 9 Average FDR for the proposed NLD(2) features, (a) Females, and (b) Males.
According to (a) and (b), TEO-related features are superior to other prosodic features. As was pointed out in “Prosodic Features,” these features convey information about the nonlinear airflow structure of speech production.
(a) and (b) represent a comparison between different types of features for females and males, respectively. Based on these figures, NLD(1) offers the most discriminative features for both males and females. Comparing (a) with (b) reveals that, for each type of feature, average FDR for males are higher than for females. In other words, male features are more discriminative than female features. Through the experiments, we noticed that combining other types of features with NLD(1) does not improve the average FDR any more.
FIGURE 10 Average FDR for different types of features, (a) Females and (b) Males.
As mentioned earlier, the FDR evaluates the discriminative power of each feature individually; to evaluate the power of a feature set in classification, we use direct classification accuracy as a criterion. The classification accuracy represents the performance of the employed classifier as a function of Ntop features, which are chosen by the FDR-based feature selection algorithm. In this study, we plot the classification accuracy for the conventional prosodic and spectral features, NLD(1) features, and NLD(2) features for comparison. The linear SVM is selected as the classifier. The computed curves are depicted in (a) and (b) for females and males, respectively.
FIGURE 11 Classification accuracy for different types of features, (a) Females, and (b) Males.
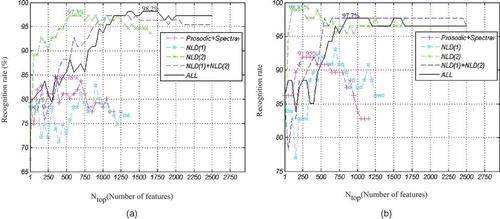
According to (a), for female speakers, the maximum recognition rate is 98.2% when 1400 top features from the collection of all types of features are chosen. Surprisingly, using just 600 top NLD(2) features (proposed in this work) provides the recognition rate 97.3%. This means that the effect of 800 non-NLD(2) features improves the recognition rate only about 0.9%. Similarly, for male speakers in (b), it can be seen that the maximum recognition rate of 98.85% is achievable using the top 150 NLD(2) features, whereas the best recognition rate of 97.7% is achieved using 900 top features from the collection of all features. In other words, adding other types of features to NLD(2) degrades the recognition performance.
Interestingly, considering classification rate, the set of NLD(2) features performs the best among other feature types under study ( (a) and (b)), whereas the FDR criterion for these features is weak ( (a) and (b)). This reveals that an individual NLD(2) feature is not discriminative for emission classification, but when a classifier uses the combination of these features, it performs very well. The result presented in (a) and (b) also confirms this fact. As seen from (a) and (b), dissimilar to other feature types, the classification accuracy using NLD(2) is considerably low when a few features are used, but the accuracy notably increases when the number of features in the set increases.
Moreover, as seen from (a) and (b), the classification accuracy is initially improved by increasing the number of features, but after a critical value, further increase of the number of features results in degrading the performance. This can be explained as a curse of dimensionality, overfitting, or peaking phenomenon (Theodoridis and Koutroumbas Citation2008), wherein the optimal number of features could be represented as a function of the number of samples and correlation of the features (Sima and Dougherty Citation2008).
The Most Efficient Feature Set
As discussed, the proposed NLD(2) features are extracted from the raw speech signal, voiced speech signal, unvoiced speech signal, glottal excitation waveform, pitch contour, and energy contour. (a) and (b) show the classification accuracy for different parts of NLD(2) features for females and males, respectively.
FIGURE 12 Classification accuracy for different types of NLD(2) features, (a) Females, and (b) Males.
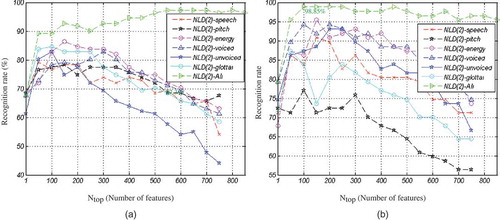
As seen from (a) and (b), the combination of different parts of NLD(2) features significantly improves the recognition rate.
In another experiment, we examine different combinations of features in NLD(2) to find out the discriminative feature set. (a) and (b) show the classification accuracy for the two proper feature sets. “Combination 1” is composed of all NLD(2) features except those extracted from raw speech signals and energy contour. “Combination 2” is a feature set extracted from voice part of speech, glottal excitation waveform, and pitch contour.
FIGURE 13 Classification accuracy for three NLD(2) feature sets, (a) Females, and (b) Males.
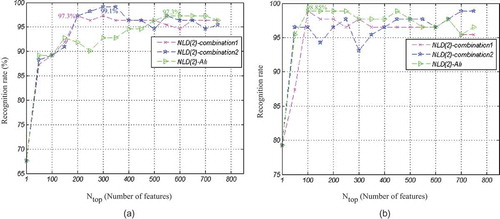
From (a), it is clear that for female speakers the “Combination 1” yields the best recognition rate of 99.1%, using the top 300 features among NLD(2) features. Thus, removing some types of NLD(2) features improves the classification accuracy. On the contrary, from (b), it is seen that, for male speakers, using the top 100 features of all NLD(2) features provides the best performance, 98.85%.
The results of classification when a combination of prosodic and spectral features is used are reported as two confusion matrices for females and males in and , respectively. In these tables the left-most column show the true emotions and the top row indicates the recognized emotions. The average recognition rate for each emotion is determined as the number of samples correctly recognized divided by the total number of samples in the class. The precision of each class is calculated as the number of samples correctly classified, divided by the total number of samples classified to the class.
TABLE 3 Confusion Matrix for Using Combined Prosodic and Spectral Features (Females)
TABLE 4 Confusion Matrix for Using Combined Prosodic and Spectral Features (Males)
As can be seen from and , the best recognition rates of 83.78% and 91.95% are achievable using the top 350 and 250 combined prosodic and spectral features for females and males, respectively.
shows the confusion matrix for the best recognition rate achieved by “Combination 1” of the NLD(2) feature set for females. The confusion matrix for the best recognition rate for males using all proposed NLD(2) features is shown in .
TABLE 5 Confusion Matrix for Using Proposed “Combination 2” Features (Females)
TABLE 6 Confusion Matrix for Using Proposed NLD(2) Features (Males)
Comparing the results of experiments using the combination of prosodic and spectral features ( and ) and those of proposed NLD(2) features ( and ) show that the classification rate using the proposed features improves the classification rate by 15.32% and 6.9% and decreases the feature size by 50 and 150 features for females and males, respectively. According to the results in and , for each gender, only one joy sample was mistakenly recognized as anger and other samples were recognized correctly.
The Proposed Classifier as an Error Correction Stage
In this section, we suggest using the proposed features and corresponding classifier to reduce the ambiguity of classification in the multiemotion problem. This strategy performs as an error correction procedure to reduce ambiguity between joy and anger in a multiemotion problem. The fact is that, in the confusion matrix of emotion classification proposed by other researchers, the ambiguity between joy and anger is high. We suggest adding the proposed classifier in tandem with the general emotion classifier. This strategy reduces the classification ambiguity between joy and anger, which are highly confused. As an example, the confusion matrix for the best recognition performance achieved by the method proposed by (Wu, Falk, and Chan Citation2011) using the 10-fold cross validation testing method (similar to this work), is represented in .
From , one can see that anger and joy constructed the most notable confused pair. As mentioned in the “Introduction,” it is because activation is more easily recognized by machine than valence is (Wu, Falk, and Chan Citation2011). shows the result of applying our proposed classifier as an error correction stage for the classifier proposed by (Wu, Falk, and Chan Citation2011).
TABLE 7 Confusion Matrix of the Method Proposed by Wu, Falk, and Chan (Citation2011; Females and Males)
TABLE 8 The Results of Classification After Applying Our Proposed Classifier as an Error Correction Stage for the Method Proposed by Wu, Falk, and Chan (Citation2011; Mixed Females and Males)
Comparing with shows that the proposed classifier for classification of joy and anger improves the average recognition rate of anger and joy emotions by 4.73% and 14.08%, respectively. Accordingly, the average accuracy for classification of seven emotions on the Berlin database is increased by 2.99%. The precision of anger and joy are also improved by 7.43% and 10.04%, respectively. This gain is achieved by employing an additional binary classifier with 400 NLD(2) features.
CONCLUSION
The aim of this study was to evaluate classification of anger vs. joy using proposed nonlinear dynamics features (NLDs) on the Berlin database. These two classes are the highly confused valence-related emotions. Our finding suggests that the NLDs that are derived from the phase space representation (PSR) of speech offers important emotional cues of speech. The following conclusions have been drawn from this study.
First, the experimental result shows that various sentences uttered by different speakers appeared alike in phase space when they are expressed by similar emotions. So, it seems that PSR is a practical tool for extracting emotional features from speech, regardless of its context information.
Second, the contours that are obtained from the PSR are useful descriptors for characterizing emotions. The statistical properties of these contours are excellent in terms of the Fisher discriminant ratio and their discrete cosine transform (DCT) coefficients are superior in terms of classification accuracy. This suggests that the statistical properties of PSR contours provide great single features and DCT coefficients yield the most effective feature set.
Moreover, the proposed classifier can improve the performance of methods that consider the problem of multiemotion classification. As the classification of joy versus anger is highly ambiguous, using the proposed method after a multiemotion classifier improves the classification performance.
Over the years, PSR has demonstrated good performance for applications such as automatic speech recognition (Indrebo, Povinelli, and Johnson Citation2006; Prajith Citation2008), speech enhancement (Johnson et al. Citation2003; Sun, Zheng1, and Wang Citation2007), and detecting sleepiness (Krajewski et al. Citation2012) from speech. However, features extracting nonlinear dynamic information have recently demonstrated promising performance for various applications in speech processing. In this article we suggest using the NLDs for classifying anger versus joy, which are emotions that are frequently highly confused in speech emotion recognition.
As future work, we plan to investigate the extraction of other features from PSR contours. Also, because the ultimate aim of a speech emotion recognition system is to recognize emotions for real work data, evaluating the proposed system under different conditions, such as in the presence of noise and chatter, is useful.
REFERENCES
- Albornoz, E. M., D. H. Milone, and H. L. Rufiner. 2011. Spoken emotion recognition using hierarchical classifiers. Computer Speech & Language 25:556–70. doi:10.1016/j.csl.2010.10.001.
- Altun, H., and G. Polat. 2009. Boosting selection of speech related features to improve performance of multi-class SVMs in emotion detection. Expert Systems with Applications 36:8197–203. doi:10.1016/j.eswa.2008.10.005.
- Bishop, C. 2006. Pattern recognition and machine learning. New York, NY: Springer.
- Bitouk, D., R. Verma, and A. Nenkova. 2010. Class-level spectral features for emotion recognition. Speech Communication 52:613–25. doi:10.1016/j.specom.2010.02.010.
- Buck, R. 1988. Human motivation and emotion. New York, NY: Wiley.
- Burkhardt, F., A. Paeschke, M. Rolfes, W. Sendlmeier, and B. Weiss (2005). A database of German emotional speech. In Proceedings of Interspeech, 1517–20. ISCA.
- Cowie, R., E. Douglas-Cowie, N. Tsapatsoulis, G. Votsis, S. Kollias, W. Fellenz, and J. Taylor. 2001. Emotion recognition in human–computer interaction. IEEE Signal Processing Magazine 18 (1):32–80. doi:10.1109/79.911197.
- Drugman, T., B. Bozkurt, and T. Dutoit. 2011. Causal-anticausal decomposition of speech using complex cepstrum for glottal source estimation. Speech Communication 53 (6):855–66. doi:10.1016/j.specom.2011.02.004.
- Duda, R. O., P. E. Hart, and D. G. Stork. 2001. Pattern classification. New York, NY: John Wiley & Sons.
- El Ayadi, M., M. S. Kamel, and F. Karray. 2011. Survey on speech emotion recognition: Features, classification schemes, and databases. Pattern Recognition 44:572–87.
- Fraser, A. M.. 1989. Information and entropy in strange attractors. IEEE Transactions Informatics Theory 35 (2):245–62.
- Gen, M., and R. Cheng. 2000. Genetic algorithms and engineering optimization. vol. 68. New York, NY: Wiley Interscience Publication.
- Gonzalez, S., and M. Brookes. 2011. A pitch estimation filter robust to high levels of noise (PEFAC). In Proceedings of EUSIPCO, Barcelona, Spain, August 29–September 2, 2011.
- Grimm, M., K. Kroschel, and S. Narayanan. 2007. Support vector regression for automatic recognition of spontaneous emotions in speech. In Proceedings of the international conference on acoustics, speech and signal processing, vol. 4:1085–88. ICASSP/IEEE.
- Guyon, I., and A. Elisseeff. 2003. An introduction to variable and feature selection. Journal of Machine Learning Research 3:1157–82.
- He, L., M. Lech, N. C. Maddage, and N. B. Allen. 2011. Study of empirical mode decomposition and spectral analysis for stress and emotion classification in natural speech. Biomedical Signal Processing and Control 6:139–46.
- Hong-guang, M. A., and H. Chong-Zhao. 2006. Selection of embedding dimension and delay time in phase space reconstruction. Frontiers of Electrical and Electronic Engineering China 1:111–14.
- Hsu, C. C., C. C. Chang, and C. J. Lin. 2007. A practical guide to support vector classification (Technical Report Department of Computer Science, National Taiwan University, Taiwan).
- Huang, X., A. Acero, and H. S. Hon. 2001. Spoken language processing: A guide to theory, algorithm, and system development. Upper Saddle River, NJ: Prentice Hall.
- Indrebo, K. M., R. J. Povinelli, and M. T. Johnson. 2006. Sub-banded reconstructed phase spaces for speech recognition. Speech Communication 48:760–74.
- Johnson, M. T., A. C. Lindgren, R. J. Povinelli, and X. Yuan. (2003). Performance of nonlinear speech enhancemeny using phase space reconstruction. In Proceedings of the international conference on acoustics, speech, and signal processing, 2003, 872–75. ICASSP/IEEE.
- Kaiser, J.. 1990. On a simple algorithm to calculate the ‘energy’ of a signal. In Proceedings of the international conference on acoustics, speech and signal processing, 1990, vol. 1:381–84. ICASSP/IEEE.
- Kamaruddin, N., A. Wahab, and C. Quek. 2011. Cultural dependency analysis for understanding speech emotion. Expert Systems with Applications 11:028.
- Kim, E. H., K. H. Hyun, S. H. Kim, and Y. K. Kwak. 2009. Improved emotion recognition with a novel speaker-independent feature. IEEE/ASME Transactions on Mechatronics 14 (3):317–25.
- Kotti, M., and C. Kotropoulos (2008). Gender classification in two emotional speech databases. Paper presented at 19th International Conference on Pattern Recognition, ICPR 2008, Tampa, Florida, December 8–11.
- Krajewski, J., S. Schnieder, D. Sommer, A. Batliner, and B. Schuller. 2012. Applying multiple classifiers and non-linear dynamics features for detecting sleepiness from speech. Neurocomputing 84:65–75.
- Laukka, P., D. Neiberg, M. Forsell, I. Karlsson, and K. Elenius. 2011. Expression of affect in spontaneous speech: Acoustic correlates and automatic detection of irritation and resignation. Computer Speech and Language 25:84–104.
- Lee, C. C., E. Mower, C. Busso, S. Lee, and S. Narayanan. 2011. Emotion recognition using a hierarchical binary decision tree approach. Speech Communication 53:1162–71.
- Polzehl, T., A. Schmitt, F. Metze, and M. Wagner. 2011. Anger recognition in speech using acoustic and linguistic cues. Speech Communication 53:1198–209.
- Prajith, P. (2008). Investigation on the applications of dynamical instabilities and deterministic chaos for speech signal processing (PhD thesis, University of Calicut).
- Rong, J., G. Li, and Y. P. Phoebe Chen. 2009. Acoustic feature selection for automatic emotion recognition from speech. Information Processing and Management 45:315–28.
- Sauer, T., J. A. Yorke, and M. Casdagli. 1991. Embedology. Journal Statistical Physics 65: 579–616.
- Schuller, B., M. Wimmer, L. M. Osenlechner, C. Kern, and G. Rigoll (2008). Brute-forcing hierarchical functional for paralinguistics: A waste of feature space? In Proceedings of the international conference on acoustics, speech, and signal processing, vol. 33:4501–04. ICASSP/IEEE, Las Vegas, Nevada.
- Sima, C., and E. R. Dougherty. 2008. The peaking phenomenon in the presence of feature-selection. Pattern Recognition Letters 29:1667–74.
- Sun, J., N. Zheng1, and X. Wang. 2007. Enhancement of Chinese speech based on nonlinear dynamics. Signal Processing 87: 2431–45.
- Takens, F.. 1981. Detecting strange attractors in turbulence. In Dynamical systems and turbulence, Warwick, 1980, ed. D. Rand and L. S. Young, 898: 366–81. Berlin, Heidelberg: Springer
- Teager, H. M., and S. M. Teager. 1989. Evidence for nonlinear sound production mechanisms in the vocal tract. Speech production and speech modelling. In NATO advanced study institute series D, eds. W. J. Hardcastle, and A. Marchal, vol. 55. France: Bonas.
- Theodoridis, S., and K. Koutroumbas. 2008. Pattern recognition. Florida: Elsevier.
- Vapnik, V.. 1995. The nature of statistical learning theory. New York, NY: Springer.
- Wu, S., T. H. Falk, and W. Y. Chan. 2011. Automatic speech emotion recognition using modulation spectral features. Speech Communication 53:768–85.
- Yang, B., and M. Lugger. 2010. Emotion recognition from speech signals using new harmony features. Signal Processing 90:1415–23.
- Zhou, G., J. Hansen, and J. Kaiser. 2001. Nonlinear feature based classification of speech under stress. IEEE Transactions on Audio Speech Language Processing 9:201–16.