
Abstract
Microbioreactors with immobilized cells or enzymes are normally packed uniformly. However, uniform packing is good only when the flow is uniform throughout the microtube. In real situations this is not true. For such cases it was shown recently that, although radial variations may be ignored, a topologically optimized longitudinal distribution of immobilized pellets generated higher outputs of glucoamylase by a recombinant strain of Saccharomyces cerevisiae. However, topology optimization (or any equation-based method) requires a good (and preferably simple) mathematical model. Such models are difficult to formulate for real nonideal conditions. Hence, a recent article by this author employed an expert system that selected between two artificial intelligence (AI) methods to determine the better method over successive intervals of time. However, such a switching strategy is complex and practically difficult. The present work, therefore, investigates a corresponding set of single (standalone) AI methods, each incorporating more biological information than earlier methods. For the same S. cerevisiae strain, it was seen that expressing the two input variables—feed concentration of glucose and the lengthwise distribution of immobilized cells—by genetic algorithms allowed greater flexibility and resulted in higher production rates of recombinant glucoamylase than all the methods used previously. This method is also easier to implement than topology optimization and the variable AI method.
INTRODUCTION
Microbioreactors are either replacing or supplementing traditional large bioreactors (called macrobioreactors, here) in an increasing number of biological and biochemical applications. This trend is favored because of the many benefits of microbioreactors over macrobioreactors. Some of the prominent benefits are greater cost effectiveness; smaller human resource requirement (owing to greater automation); easier scale-up by stacking many microbioreactors in parallel inside an overall shell (similar to a heat exchanger); better heat transfer rates and smaller radial gradients (both of which are related to the larger aspect ratios); and conveniently achievable high resolution and high precision of online monitoring and control (Hessel, Lob, and Lowe Citation2008; Patnaik Citation2011).
These benefits have been utilized and validated in a variety of applications, mainly with the bacterium Escherichia coli and the yeast Saccharomyces cerevisiae. Our focus, here, is on a particular application of S. cervisiae, so some illustrative examples utilizing this organism will be discussed. Among recent studies, that by Zhang, Szita et al. (Citation2006) is noteworthy because it established not only the suitability of a microbioreactor for biopolymer production but also the usefulness of optical measurements in a viscous broth in such a bioreactor. Later, Edlich et al. (Citation2010) used a diffusion-based microbioreactor for continuous cultivation of S. cerevisiae. The versatility of microbioreactors is exemplified further by the work of Patel et al. (Citation2009), Rodionov et al. (Citation2009), and Ferndal et al. (Citation2010). The first group induced the cells to synthesize virus-like molecules of the human papillomavirus-16 major capsid protein, an immune-enhancing molecule. Rodionov and colleagues (Citation2009) produced high titers of pure recombinant M-Pol I with alpha-1,6 mannosylpolymerase activity; this product is useful in preserving the flavor of wines. Ferndahl et al. (Citation2010) focused on the simultaneous synthesis of three membrane proteins and soluble green fluorescence protein by the S. cerevisiae TM6 strain, which have important diagnostic applications.
The present work is based on the study reported by Schäpper et al. (Citation2011), who utilized immobilized recombinant S. cerevisiae C468 (ATCC 20690) harboring the plasmid pGAC9 to produce glucoamylase. As did earlier workers, they, too, used a tubular reactor. However, unlike those studies, Schäpper et al. used immobilized cells in place of cells suspended freely in a liquid medium. The advantages of immobilization are well known, the more notable being reusability of the cells; reduced contamination of the product; improved viability or activity, resulting in greater synthesis of the product(s); and the scope to develop multienzyme or multicellular matrices with high selectivity (Andres, Zueco, and Parascondla Citation2003; Kilonzo, Margaritis, and Bergougnou Citation2010; Nguyen, Ton, and Le Citation2009). Schäpper and coworkers (Citation2011), however, did not use uniformly (or homogeneously) packed pellets as is usual with most immobilized bioreactors but instead determined an “optimal” distribution that generated greater effectiveness and greater product formation. Their system differed from conventional packed bed microbioreactors in one other significant aspect: to have a practically more reasonable model, they considered that at any time some cells got detached from the pellets to which they had been anchored and that the fraction of freely suspended cells varied with time. These two aspects are elucidated later in the presentation of Schäpper et al.’s mathematical model.
KINETIC MODEL
As stated in the “Introduction,” this study is based on the kinetic model described by Schäpper et al. (Citation2011). The model applies to an immobilized S. cerevisiae system, in which, from practical considerations, at any time some cells are detached from the pellets and swim freely in the liquid medium. The authors used the genetically modified strain S. cerevisiae C468 (ATCC 20690) containing the plasmid pGAC9, which expresses the Aspergillus awamori glucoamylase gene into the extracellular medium. This recombinant S. cerevisiae fermentation, thus, offers two advantages over natural expression systems: (1) it generates higher titers of glucoamylase, and (2) because the product is extracellular, the cost of recovering it from the immobilized system is reduced significantly.
Schäpper et al.’s (Citation2011) model considers three main metabolic steps in S.cerevisiae cultivation: (1) glucose fermentation, (2) glucose oxidation, and (3) ethanol oxidation. The respective specific growth rates of the cells on these three pathways are given by
The rate of detachment of cells for the pellets was described by a similar Monod model:
The second term, , on the right side of Equation (4) was introduced by Schäpper et al. (Citation2011) to reflect switching of the growth for glucose dependence to ethanol dependence when glucose concentration becomes too low. This shift is present not just in the recombinant S. cerevisiae strain (Shafaghat et al. Citation2009) but in many natural S.ceervisiae strains also (van Dijken, Weusthuis, and Pronk Citation1993; de Kock, du Preez, and Kilian Citation2000; Snoep et al. Citation2009), thus suggesting that it is a generic feature of S. cerevisiae.
Because some immobilized cells are lost into the surrounding fluid, the total mass of cells that are anchored to the host matrix is given by
Recombinant cells themselves may lose their plasmid content as time progresses (Friehs Citation2004) and, hence, only a fraction p of the total immobilized biomass, , contains the plasmid pGAC9.Thus, the mass of plasmid bearing immobilized cells is
In the predominantly laminar flow observed in microbioreactors (Beebe, Mensing, and Walker Citation2002; Rohe et al. Citation2012) the suspended (free) biomass, glucose, and ethanol flow along the microtube mainly by convection and diffusion. The combined rates may then be modeled by Fickian kinetics.
Equations (7)–(10) are solved to determine the total glucoamylase production rate for a given distribution of immobilized cells. The objective is to determine the distribution that maximizes glucoamylase output. To determine this, we require first the local rate of production of glucoamylase along the length, l, of the microbioreactor. According to Zhang and coauthors (Citation1997), glucose is synthesized only in the second and third steps, corresponding to Equations (2) and (3). Hence, the net local rate of production of glucoamylase is
Maximization of the total glucoamylase production rate, thus, corresponds to maximization of ,
being the spatial distribution index of immobilized cells. Schäpper et al. (Citation2011) determined this by topology optimization. The present analysis and another study preceding this (Patnaik Citation2014) determined the best distribution through artificial intelligence (AI) methods. Both approaches are briefly presented in the following sections.
TOPOLOGY OPTIMIZATION AND INTELLIGENT OPTIMIZATION
The kinetic model depicted by Equations (1)–(12) was solved by Schäpper et al. (Citation2011) for two situations: (1) a uniform (or homogeneous) distribution of the pellets and (2) a spatially varying distribution. As stated above, optimization involves determination of the distribution that maximizes
. Because
denotes the fraction of the total contents of the microbioreactor that is occupied by the extracellular broth
with
signifying a microtube filled with only broth and no pellets and
denoting a tube containing pellets without broth. Thus, both extreme types are not useful and a real functional microbioreactor has
. For a uniform distribution of pellets, γ is the same throughout the reaction.
Schäpper and colleagues (Citation2011) obtained the distribution of that maximized
through topology optimization. The methodology has been described in detail by Borrvall and Petersson (Citation2003), and its applicability to microbial systems has been demonstrated by a number of studies (Gregerson et al. Citation2009; Okkels et al. Citation2005; Okkels and Bruus Citation2007). So, only a brief presentation is provided here. The optimization method proceeds through five main steps:
An assumed initial distribution of the carrier (i.e., the pellets) containing the immobilized cells.
Calculation of the steady-state flow of the culture broth by using computational fluid dynamics.
Solution of the kinetic model for the cells.
Determination of compliance of the optimization function with a prescribed stopping criterion.
Iterations through Steps 1–4 until the stopping criterion is satisfied.
Although topology optimization has advantages over classical optimization methods (Kelley Citation1999; Cavazzuti Citation2013), it also suffers from some of the weaknesses of those methods. The success of the method depends on the choice of initial guesses for the design variables, the nonlinearity of the objective function, and the speed of convergence of the differential equations. In the present application, the kinetics are nonlinear, the concentrations are interconnected, it is difficult to guess a good starting distribution for , and in real situations the inflows often fluctuate due to environmental disturbances. Such difficulties complicate the formulation of reliable and sufficiently simple mathematical models in real situations, thus restricting the applicability of equation-based optimization methods.
Many recent optimizations of both microbioreactors and large bioreactors have therefore employed methods of AI that do not require mathematical models, are both robust and flexible, can accommodate uncertainties in the inputs, and can evolve and improve with continuing usage. Literature on such applications indicates that three AI methods are effective for most microbial processes: artificial neural networks (ANN; Julien and Whitford Citation2007), fuzzy logic (FL; Bailey et al. Citation2005; Woodley and Gernaey Citation2013); and genetic algorithms (GA; Patnaik Citation2009a). Sometimes a combination of two methods works better than any one of them alone, as with fuzzy neural networks (FNN; Caraman et al. Citation2002; Petrov et al. Citation2005). On the basis of the last two studies, and similar ones with FNNs, recently Patnaik (Citation2014) employed FNNs and GA to the present system in a microbioreactor. That study is discussed in the next section as a basis for comparison with the results reported here.
AI MODELS FOR MICROBIOREACTORS
In a recent study, Patnaik (Citation2014) investigated the performance of a continuous flow microbioreactor for which two important input variables—the feed rate of the main carbon source (glucose) and the longitudinal distribution of immobilized cells—were optimized by (1) an FNN and (2) a GA. Although each method may be applied separately, the novelty of Patnaik’s (Citation2014) work lies in the implementation of an expert system that determines from time to time which of these two AI methods resulted in higher synthesis of the glucoamylase.
The rationale for a time-dependent choice between two AI methods is that the superiority of one method over the other might depend on local conditions, which could very as time progresses. It has been argued that such dynamic changes might occur because of variations in the flow conditions owing to changes in cell density and thermodynamic properties (Schäpper et al. Citation2011), and/or interactions between intracellular metabolic processes and noise from within the cells and from the environment (Patnaik Citation2006). The overall architecture incorporating a supervisory expert system, an FNN and a GA, is illustrated in . This dynamic switching algorithm constitutes the inference engine of the expert system, whose information flow scheme is shown in . The expert system itself has three main components:
a knowledge-base editor,
FIGURE 1 Schematic diagram of a supervisory expert system for a bioreactor. ©Taylor and Francis Group, LLC. 2014. Redrawn from Patnaik (Citation2014) with the permission of Taylor and Francis Group, LLC. Permission to reuse must be obtained from the rightsholder.
FIGURE 2 Architecture of the dual-AI system under supervisory expert control used previously. ©Taylor and Francis Group, LLC. 2014. Redrawn from Patnaik (Citation2014) with the permission of Taylor and Francis Group, LLC. Permission to reuse must be obtained from the rightsholder.
an explanation system, and
an inference engine.
These three components interact with one another on one side and with problem-specific data on the other side. The formulation of suitable rules obviously requires a reasoning strategy, thus making the inference engine the AI core of the expert system. Given that is a key component of the overall control strategy of the microbioreactor and that the efficiency of this control depends critically on the knowledge base, it is important to keep the knowledge base up-to-date; this is done partly by information feedback of performance as the fermentation progresses and partly by information supplied by human experts.
For compatibility with earlier studies (Schäpper et al. Citation2011; Patnaik Citation2014), the same performance index (
) was employed here. The objective is to optimize
(
) in order to maximize glucoamylase output.
As the results that will be presented later show, the switching strategy between two AI systems enhances glucoamylase outflow by 800%–850% over topology optimization, which itself improves the outflow by 100%–150% over a uniform distribution of pellets. Thus, there is considerable benefit in implementing AI methods. However, such frequent dynamic shifts can create instability; moreover, the strategy may be difficult to practice because of uncertain changes in the noise experienced by microbioreactors and their effects on cellular metabolism (Patnaik Citation2012; Zhang, Boccazzi et al. Citation2006). Hence, easier single AI methods (i.e., methods that do not require time-varying shifts) have been studied here as alternatives, and the microbioreactor performance has been compared with the dynamic switching strategy and with topology optimization. Besides being easier to implement and avoiding instability risks, the single AI methods used here also incorporate more biological detail than that used by Patnaik (Citation2014), as described following.
The dynamic switching method studied earlier used two lumping simplifications. One is that, at all times both the main control variables—the feed rate of glucose and the longitudinal distribution of the immobilized cells—are considered to be adequately described by the same AI method, i.e., FNN or GA. The second simplification is the lumping of an ANN and FL into the FNN. Although FNNs have been successful in optimally controlling nonideal bioreactors (Caraman et al. Citation2002; Petov et al. Citation2005), so have FL (Bailey et al. Citation2005; Woodley and Gernaey Citation2013) and ANN (Julien and Whitford Citation2007) alone in certain cases. Two other reasons favor investigations of the validity of ANN and FL separately. One reason is that this enables expressing the two control variables by different AI systems (i.e., by FL or ANN). The second reason is that it is useful to study the application of easier ANN control or FL control to a bundle of many microbioreactors stacked in parallel (“numbering up”) in a single shell because such a configuration is employed by many production-scale (micro)bioreactors (Pasirayi et al. Citation2011; Gernaey et al. Citation2012).
The representation of the glucose feed rate (G) and the lengthwise distribution of immobilized S. cerevisiae cells (C) by either FL or ANN or GA results in nine possibilities. summarizes these as cases 4–12, with a homogeneous distribution, a topology optimized distribution, and a dynamically switching distribution, also listed as cases 1–3, respectively, for comparison. Results for all 12 situations are discussed next.
TABLE 1 Different Possible Representations of the Microbioreactor by the AI Methods Used Here
APPLICATION AND DISCUSSION
The results and discussion presented here are an extension of the AI studies reported earlier (Patnaik Citation2014). As explained, whereas those studies utilized an expert system to choose the better of two AI options—FNN or GA—during successive intervals of time, the present work uses one of three options—FL, ANN, or GA. In other words, FL and ANN are decoupled from the FNN. There is, however, more biological information embedded in the present study, in the sense that each of the two controlled variables—the feed glucose concentration and the longitudinal distribution of immobilized S. cerevisae—is described by an FL system or an ANN or a GA. This results in nine possible combinations. Together with the three cases studied earlier, these constitute 12 combinations, which are summarized in .
Because this work is a variant of a previous study (Patnaik Citation2014), the architecture of the inference engine of the expert system that oversees each of the 12 AI possibilities is broadly similar to that employed earlier but differs in some detail from that topology. The present architecture is shown in , and a companion with the previous design (Patnaik Citation2014; ) indicates the addition of a set of nine contiguous boxes representing the nine new possibilities available through the present methodology.
FIGURE 3 Topology of the three-AI system studied in the present work. As in Figure 1, this system is also under supervisory expert control. Differences between Figure 2 and 3 are discussed in the text.
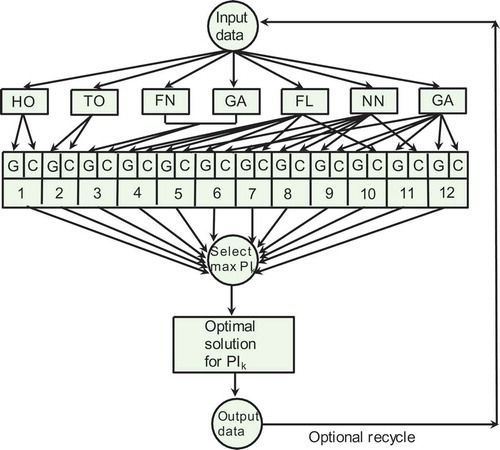
To implement the flow diagram of , it is necessary first to define the types of FL, ANN, and GA to be used, as has been discussed previously (Patnaik Citation2014). Recapitulating that discussion, we recognize first that the primary control variables—the concentration of glucose in the feeds stream and the linear distribution of immobilized cells (denoted by G and C, respectively, in )—are often not known exactly for production scale vessels. G varies with time because of (1) the scale of preparation of commercial glucose solutions and (2) fluctuations arising from the impact of disturbances in the environment (Henson Citation2003; Patnaik Citation2006; Xu and Tao Citation2006). Uncertainties in the cell distribution are a consequence of practical difficulties in realizing a theoretically described nonuniform distribution and measuring the actual distribution. The uncertainties in G and C can be conveniently expressed in fuzzy logic by a truncated pyramidal membership function () whose central flat segment corresponds to the most likely value and the tapering segments on either side denote less likely values.
FIGURE 4 Membership function for a truncated pyramidal distribution.
Similarly, earlier applications (Caraman et al. Citation2002; Petrov et al. Citation2005; ul-Haq and Mukhtar Citation2006) have favored a recurrent neural network as the most suitable for microbioreactors. For the present applications, the ANN has the topology shown in . The numbers of neurons in the input and output layers are defined by the numbers of input and output variables. The optimum number of hidden neurons is determined by starting with only one and adding neurons until the difference between a prescribed performance index determined from the ANN and the actual training data is minimized. This difference does not decrease indefinitely with increasing the number of hidden neurons because, with too few neurons, an ANN cannot learn all the important relevant features of the (bio)process; however, too many neurons cause the network to imbibe spurious features in addition to those that are relevant (Gadkar, Mehra, and Gomes Citation2005; Patnaik Citation2009b); both features, thus, undermine the performance of the ANN. also has a so-called recurrent neuron, R1. Although this is an optional feature, recurrent neurons improve the representation and optimization of bioreactors with nonideal features (Patnaik Citation2008; Sivakumaran, Sarat Chandra, and Radhakrishnan Citation2006).
FIGURE 5 Topology of the recurrent neural network used here. I1, I2 = input neurons; H1, H2, H3 = hidden neurons; O1, O2, O3 = output neurons; R1 = recurrent neuron.
also shows that the recurrent neuron transmits glucose outlet concentration data back to the corresponding input neuron, I1. This choice was guided by previous applications (Orrell and Bolouri Citation2004; Patnaik Citation2006; Xu and Tao Citation2006), which have demonstrated that recycling the glucose outlet concentration enhances stability and improves product synthesis in recombinant microbial systems.
Both fuzzy logic and neuron networks, either separately or in combination, have been criticized for being empirical representations of real systems. Although empiricism might not prevent them from being useful for normal applications, it can limit their effectiveness when sudden large disruptions drive the microbioreactor significantly away from the conditions under which it was optimized with training data. This limitation has been attributed to the absence of any organic link between FL or ANN and the mechanism underlying the bioprocess. Such links are built into the structure of GAs (even though implicitly at times), and hence, there is growing preference for GAs to portray real bioprocesses (Angelova, Melo-Pinto, and Pencheva Citation2012; Chen et al. Citation2004; Patnaik Citation2009a), which have demonstrated that recycling the glucose outlet concentration enhances stability and improves production synthesis recombinant microbial systems. GAs are also applicable to both “black box” and “white box” models and, hence, they can be combined with FL or ANN or FNN.
A GA contains five basic steps ():
Encode the decision variables as random strings called chromosomes or genomes (hence the name GA).
FIGURE 6 Information flow diagram of a genetic algorithm. ©Taylor and Francis Group, LLC. 2014. Redrawn from Patnaik (Citation2014) with the permission of Taylor and Francis Group, LLC.
Evaluate the fitness of individual members of a genome, called genes, using a defined fitness function.
Select genes that satisfy the fitness criteria and then perform crossover and mutation operations.
Generate a new population of chromosomes.
Repeat Steps (2)–(4) until a specified convergence criterion is satisfied.
Readers interested in the detailed theory of GAs may refer to standard references (Goldberg Citation1989; Mitchell Citation1998). It will suffice to explain here that mutation enhances the stochasticity of the algorithm and, thus, helps the search to reach a global optimum rather than achieving only a local optimum. Crossover is the mating of two members of a population, and it ensures that the relevant features of each generation are passed on to the next generation. In this sense, crossover has a function similar to an optimum number of hidden neurons in an ANN.
A simple GA might not always function efficiently; for example, for complex biological process with noise and hydrodynamic effects. Hence, different methods have been suggested to improve the efficiency; these include a “compensation method” within the fitness function (Chen et al. Citation2004), variations in the rates of mutation and crossover (Angelova, Melo-Pinto, and Pencheva Citation2012), and adaption of the stochastic remainder roulette wheel method (Patnaik Citation2009a). The last method was selected in this study and its predecessor (Patnaik Citation2014) owing to its robustness and effectiveness for microbial processes (Sibalija and Majstorovic Citation2012; Sivaraj and Ravichandran Citation2011).
Our previous study (Patnaik Citation2014) compared the results of microbioreactor performance by the variable AI method (dynamic switching between a GA and an FNN) with the performances for a homogeneous distribution of immobilized cells and for a topologically optimum nonuniform distribution varying along the length of the microbioreactor (Schäpper et al. Citation2011). It was seen that the variable AI method of optimal operation resulted in significantly greater outputs of gluoamylase, in terms of both the production rate and the outlet concentration per unit mass of cells, than the topologically optimized method, which in turn generated higher outputs than a microbioreactor with a uniform distribution. These results are compared, here, with the nine additional possibilities depicted in . It should be clarified again that these nine cases do not require dynamic switching, thereby simplifying their implementation. However, they do incorporate more phenomenological detail than appears in the previous scheme ().
Because our interest is mainly in recombinant glucoamylase production, those results are presented graphically in –. shows the variation of glucoamylase concentration along the length of the microbioreactor. The numbers in the legend pertain to the cases listed in . To avoid cluttering the figure, only the best three of the nine separate AI combinations are plotted. Whereas these plots show the steady state concentrations for a glucose concentration of 0.5 g/L in the feed stream, – display the effect of varying the inlet concentration of glucose on the production rate of glucoamylase and the outlet concentration of immobilized biomass.
FIGURE 7 Variation of glucose concentration along the distance of the microbioreactor; feed concentration = 0.5 g/L.
FIGURE 8 The effect of feed glucose concentration on total glucoamylase output for cases 1–4, 8, and 12. The individual cases are identified in .
FIGURE 9 The effect of feed glucose concentration on the incremental enhancement of glucoamylase output; index i − j indicates a change from case j to case i, where i and j refer to the numbers in the legend.
FIGURE 10 The effect of feed glucose concentration on glucoamylase output per unit mass of immobilized cells for cases 1–4, 8, and 12. The individual cases are identified in .
All three figures reveal the same interesting trends: (1) glucomylase output goes up significantly with a nonuniform distribution of immobilized cells; (2) expressing both input variables by GAs results in the highest rate of synthesis of glucoamylase, with ANNs and FLs following in that order; (3) all nine stationary combinations considered here generate more glucoamylase than dynamic switching; (4) portrayal of both input variables by the same kind of AI systems (FL or ANN or GA) is more favorable than by different AI methods; and (5) the supremacy of representing both input variables by GAs holds true even for the glucoamylase production per unit biomass.
The last three observations underscore the relevance of the present analysis for production-scale microbioreactors. The superiority of the more detailed standalone combinations over relatively lumped varying choices between two AI systems allows simpler controls and easier operation. Similar benefits also accrue from compatible AI expressions of both control variables, thereby favoring easier logistics and synchronous operations. emphasizes that these benefits are independent of the scale of operation.
As informative as the concentration profiles themselves are the incremental improvements on moving from one mode of optimization to another. The three most important cases are shown graphically in . The first two were presented in our previous work (Patnaik Citation2014); to those two plots have been added the plots for case 12 relative to those for cases 1, 2, and 3. All five plots show substantive enhancements in the glucoamylase production rate; more significantly, they also show the existence of an optimum feed glucose concentration of about 0.1 g/L, for which the production increments are the highest.
The existence of an optimum feed concentration was briefly discussed earlier (Patnaik Citation2014). A more detailed discussion based on the mechanism of biosynthesis of ethanol by S. cerevisiae is available from Postma et al. (Citation1989), especially in contesting the Crabtree effect observed commonly in fermentations that use glucose as a carbon source. Two of their significant observations are (1) acetate formation results from the activity of acetyl-CoA synthetase, and ethanol formation results from insufficient activity of acetaldelyde deydrogenases; and (2) in yeast fermentations, weak organic acids may interfere with energy metabolism at two levels: (a) by dissipation of the proton motive force over the plasma membrane and (b) by direct uncoupling at the level of the inner mitochondrial membrane, thus affecting negatively the proton-ATP stoichiometry. Postma et al.’s (Citation1989) explanation has been confirmed by both earlier (Bartford, Jeffry, and Hall Citation1981; Petrik, Kappelli, and Fiechter Citation1983) and later (Diaz-Ruiz et al. Citation2008; Vaseghi et al. Citation1999) investigators.
CONCLUSIONS
Microbioreactors with immobilized cells are normally packed uniformly with the pellets anchoring the cells. However, it has been shown recently (Schäpper et al. Citation2011) for a continuous flow bioreactor that, because the characterizing features of fluid flow are not constant throughout the length of the microtube, a nonuniform longitudinal distribution of the cells can exploit the varying conditions and thus generate a better performance. This was demonstrated for the synthesis of glucoamylase by a recombinant strain of Saccharomyces cerevisiae.
Schäpper et al. (Citation2011) reported that an “optimum” nonuniform distribution of immobilized cells determined by topology optimization produced a 10-fold increase in glucoamylase outflow. Because the success of this method depends on a good mathematical model, which is often difficult to formulate under real nonideal conditions, Patnaik (Citation2014) employed artificial intelligence to determine the best distribution. His method was based on an expert system that decided, at prescribed time intervals, the better of two AI methods—a fuzzy neural network or a genetic. Even though this AI scheme more than doubled the output of glucoamylase, it is difficult to implement practically. Moreover, frequent changes in the packing density distribution can create operational instabilities. Therefore, in this work the “optimum” distribution has been determined by nine different single-AI systems (as contrasted with the dual-AI system of Patnaik, Citation2014), each of which expresses the two input variables—feed glucose concentration and the lengthwise distribution of immobilized cells—by any one of three AI methods: fuzzy logic, artificial neural network, and GA. Apart from avoiding the difficulties of switching between two or more AI systems, the present methods also allow the two input variables to be expressed independently by different AI methods.
Results of simulations showed that (1) all the nine single-AI methods generated greater outflows of glucoamylase than the dual-AI method, (2) the representation of both input variables by the same kind of AI system generated better performances than those by different AI systems, and the largest improvement was obtained when both input variables were represented by GAs. The last method resulted in productivity enhancement of nearly 100% over the dual-AI method and 8,000%–10,000% over uniform packing of the immobilized cells. The significance of the improvements is enhanced by the additional observation that they were independent of the scale of production, thus underlining the versatility of the AI-optimization methods used here.
NOMENCLATURE
| DG: | = | diffusion coefficient for glucose, m2 s−1 |
| DE: | = | diffusion coefficient for ethanol, m2 s−1 |
| = | diffusion coefficient for total suspended biomass, m2 s−1 | |
| = | diffusion coefficient for plasmid-containing suspended biomass, m2 s−1 | |
| E: | = | concentration of ethanol in microbioreactor, g L−1 |
| G: | = | concentration of glucose in microbioreactor, g L−1 |
| K1: | = | saturation constant for μ1, g L−1 |
| K2: | = | saturation constant for μ2, g L−1 |
| K3 | = | saturation constant for μ3, g L−1 |
| KS: | = | saturation constant for |
| ka′: | = | enzyme pool regulation constant,— |
| kb′: | = | enzyme pool regulation constant,— |
| kc′: | = | enzyme pool regulation constant,— |
| kd′: | = | enzyme pool regulation constant,— |
| = | rate of detachment of immobilized cells, g L−1 | |
| = | steady state value of | |
| p: | = | probability of plasmid loss,— |
| PC: | = | total mass of carrier, g |
| Xim: | = | total concentration of immobilized cells, g L−1 |
| = | maximum value of Xim, g L−1 | |
| = | active component of Xim, g L−1 | |
| = | concentration of plasmid-bearing immobilized cells, g L−1 | |
| Xf: | = | concentration of suspended (free) biomas, g L−1 |
| = | concentration of plasmid-bearing suspended (free) biomass, g L−1 | |
| Vr: | = | total volume of microbioreactor, L |
| = | yield coefficient of biomass on glucose for glucose oxidation, g g−1 | |
| = | yield coefficient of biomass on glucose for glucose fermentation, g g−1 | |
| = | yield coefficient of ethanol on glucose for glucose fermentation, g g−1 | |
| = | yield coefficient of biomass on ethanol for ethanol oxidation, g g−1 |
Greek letters
| γ: | = | free (unused) fraction of the carrier,— |
| μ1: | = | specific growth of biomass via glucose fermentation, h−1 |
| μ2: | = | specific growth of biomass via glucose oxidation, h−1 |
| μ3: | = | specific growth of biomass via ethanol oxidation, h−1 |
REFERENCES
- Andres, I., J. Zueco, and P. Parascandola. 2003. Immobilization of Saccharomyces cerevisiae cells to protein G-Sepharose by cell wall engineering. Journal of Molecular Microbiology and Biotechnology 5:161–66. doi:10.1159/000070266.
- Angelova, M., P. Melo-Pinto, and T. Pencheva. 2012. Modified simple genetic algorithms improving convergence time for the purposes of fermentation process parameter identification. WSEAS Transactions on Systems 11:256–62.
- Bailey, R., F. Jones, B. Fisher, and B. Elmore. 2005. Immobilized enzymatic microbioreactor design enhancement using computational simulation. Applied Biochemistry and Biotechnology 121–124:639–52. doi:10.1385/ABAB:122:1-3:0639.
- Bartford, J. P., P. M. Jeffry, and R. J. Hall. 1981. The Crabtree effect in Saccharomyces cerevisiae – primary control mechanism or transient? In Advances in biotechnolgy, ed. M. Moo-Young, C. W. Robinson, and C. Vezina, vol. 1, 255–60. Toronto, Canada: Pergamon Press.
- Beebe, D. J., G. A. Mensing, and G. M. Walker. 2002. Physics and applications of microfluidics in biology. Annual Review of Biomedical Engineering 4:261–86. doi:10.1146/annurev.bioeng.4.112601.125916.
- Borrvall, T. and J. Petersson. 2003. Topology optimization of fluids in Stokes flow. International Journal of Numerical Methods in Fluids 41:77–107.
- Caraman, S., L. Frangu, E. Ceanga, and M. Barbu. 2002. Neuro-fuzzy control of microrganisms mean age in biotechnological processes. Proceedings of the 10th Mediterranean Conference on Control and Automation, Lisbon, Portugal, July 9–12.
- Cavazzuti, M. 2013. Optimization methods. From theory to design. Berlin, Heidelberg, Germany: Springer-Verlag.
- Chen, L. Z., S. K. Nguang, X. D. Chen, and X. M. Li. 2004. Modelling and optimization of fed-batch fermentation processes using dynamic neural networks and genetic algorithms. Biochemical Engineering Journal 22:51–61. doi:10.1016/j.bej.2004.07.012.
- de Kock, S. H., J. C. du Preez, and S. G. Kilian. 2000. Anomalies in the growth kinetics of Saccharomyces cerevisiae strains in aerobic chemostat cultures. Journal of Industrial Microbiology and Biotechnology 24:231–36. doi:10.1038/sj.jim.2900813.
- Diaz-Ruiz, R., N. Averet, D. Araiza, B. Pinson, S. Uribe-Carvajal, A. Devin, and M. Rigoulet. 2008. Mitochondrial oxidative phosphorylation is regulated by fructose 1,6-bisphosphate: A possible role in Crabtree effect induction? Journal of Biological Chemistry 283:26948–55. doi:10.1074/jbc.M800408200.
- Edlich, A., V. Magdanz, D. Rasch, S. Demming, S. A. Zadeh, R. Segura, C. Kähler, R. Radespiel, S. Büttgenbach, E. Franco-Lara, and R. Krull. 2010. Microfluidic reactor for continuous cultivation of Saccharomyces cerevisiae. Biotechnology Progress 26:1259–70. doi:10.1002/btpr.449.
- Ferndahl, C., N. Bonander, C. Logez, R. Wagner, L. Gustafsson, C. Larsson, K. Hedfalk, R. A. J. Darby, and R. M. Bill. 2010. Increasing cell biomass in Saccharomyces cerevisiae increases recombinant protein yield: The use of a respiratory strain as a microbial cell factory. Microbial Cell Factories 9:47. doi:10.1186/1475-2859-9-47.
- Friehs, K. 2004. Plasmid copy and plasmid stability. Advances in Biochemical Engineering/Biotechnology 86:47–82.
- Gadkar, K. G., S. Mehra, and J. Gomes. 2005. On-line adaptation of neural networks for bioprocess control. Computers & Chemical Engineering 29:1047–57. doi:10.1016/j.compchemeng.2004.11.004.
- Gernaey, K. V., F. Baganz, E. Franco-Lara, F. Kensy, M. Luebberstedt, U. Mary, E. Palmquist, A. Schmidt, F. Schubert, and C. F. Mandenius. 2012. Monitoring and control of microbioreactors: An expert opinion on development needs. Biotechnology Journal 7:1308–14. doi:10.1002/biot.201200157.
- Goldberg, D. E. 1989. Genetic algorithms in search, optimization and machine learning. New York, NY: Addison-Wesley.
- Gregersen, M. M., F. Okkels, M. Z. Brazant, and H. Bruus. 2009. Toplogy and shape optimization of induced-charge electro-osmotic micropumps. New Journal of Physics 11:075019.
- Henson, M. A. 2003. Dynamic modeling and control of yeast cell populations in continuous biochemical reactors. Computers & Chemical Engineering 27:1185–99. doi:10.1016/S0098-1354(03)00046-2.
- Hessel, V., P. Lob, and H. Lowe. 2008. Industrial microreactor process development up to production. In Microreactors in organic synthesis and catalysis, ed. T. Wirth, 211–90. Weinheim, Germany: Wiley-VCH.
- Julien, C., and W. J. Whitford. 2007. Bioreactor monitoring, modeling and simulation. BioProcess International Supplement January 2007: 10–17.
- Kelley, C. T. 1999. Iterative methods for optimization. Philadelphia, PA: Society for Industrial and Applied Mathematics.
- Kilonzo, P. M., A. Margaritis, and M. A. Bergougnou. 2010. Repeated-batch production of glucoamylase using recombinant Saccharomyces cerevisiae immobilized in a fibrous bed bioreactor. Journal of Industrial Microbiology and Biotechnology 37:773–83. doi:10.1007/s10295-010-0719-4.
- Mitchell, M. 1998. An introduction to genetic algorithms (Complex dynamic systems). Cambridge, MA: MIT Press.
- Nguyen, D. N., N. M. N. Ton, and V. V. M. Le. 2009. Optimization of Saccharomyces cerevisiae immobilization in bacterial cellulose by adsorption-incubation method. International Food Research Journal 16:59–64.
- Okkels, F. and H. Bruus. 2007. Design of microfluidic bioreactors using topology optimization. Journal of Computational and Theoretical Nanoscience 4:814–6.
- Okkels, F., L. Hojgaard, and H. Bruus. 2005. Applications of topology optimization in the design of micro- and nano-fluidic devices. Proceedings of NSTI-Nanotech 1:575–8.
- Orrell, D., and H. Bolouri. 2004. Control of internal and external noise in genetic regulatory networks. Journal of Theoretical Biology 230:301–12. doi:10.1016/j.jtbi.2004.05.013.
- Pasirayi, G., V. Auger, S. M. Scott, P. K. S. M. Rahman, M. Islam, L. O’Hare, and Z. Ali. 2011. Microfluidic bioreactors for cell culturing: A review. Micro and Nanosystems 3:137–60. doi:10.2174/1876402911103020137.
- Patel, M. C., K. K. Patkar, A. Basu, K. M. Mohandas, and R. Mukhopadhyaya. 2009. Production of immunogenic human papillomavirus-16 major capsid derived virus like particles. The Indian Journal of Medical Research 130:213–18.
- Patnaik, P. R. 2006. External, extrinsic and intrinsic noise in cellular systems: Analogies and implications for protein synthesis. Biotechnology and Molecular Biology Reviews 1:123–29.
- Patnaik, P. R. 2008. Neural and hybrid neural modeling and control of fed-batch fermentation for streptokinase: Comparative evaluation under nonideal conditions. The Canadian Journal of Chemical Engineering 82:599–606. doi:10.1002/cjce.5450820320.
- Patnaik, P. R. 2009a. Genetic algorithmic optimization of PHB production by a mixed culture in an optimally dispersed fed-batch bioreactor. Bioautomation 13:27–46.
- Patnaik, P. R. 2009b. Intelligent models of the quantitative behavior of microbial systems. Food and Bioprocess Technology 2:122–37. doi:10.1007/s11947-008-0112-8.
- Patnaik, P. R. 2011 Microfluidic processes: Blending new chemistry with new engineering. International Journal of Chemical Engineering 4:143–73.
- Patnaik, P. R. 2012. Lyapunov stability of a microbioreactor under the influence of external noise. International Journal of Mathematical Models and Methods in Applied Sciences 6:419–26.
- Patnaik, P. R. 2014. Supervisory expert system-based intelligent optimization of a microbioreactor. Applied Artificial Intelligence 28:91–110. doi:10.1080/08839514.2014.875678.
- Petrik, M., O. Kappelli, and A. Fiechter. 1983. An expanded concept for the glucoseEdit per online search for article correct?effect in the yeast Saccharomyces uvarum: Involvement of short- and long-term regulation. Journal of General Microbiology 129:43–49.
- Petrov, M., T. Llkova, S. Tzonkov, and U. Viesturs. 2005. Application of a fuzzy neural network for modeling of the mass-transfer coefficient in a stirred tank bioreactor. Bioautomation 2:1–7.
- Postma, E., C. Verduyn, W. A. Scheffers, and J. van Dijken. 1989. Enzymatic analysis of the Crabtree effect in glucose-limited chemostat cultures of Saccharomyces cerevisiae. Applied and Environmental Microbiology 55:468–77.
- Rodionov, D., P. A. Romero, A. M. Berghuis, and A. Herscovics. 2009. Expression and purification of recombinant M.-Pol I from Saccharomyces cerevisiae with alpha-1,6 mannosyl polymerase activity. Protein Expression and Purification 66:1–6. doi:10.1016/j.pep.2009.02.013.
- Rohe, P., D. Venkanna, B. Kleine, R. Freudl, and M. Oldiges. 2012. An automated workflow for enhancing microbial bioprocess optimization on a novel microbioreactor platform. Microbial Cell Factories 11:144. doi:10.1186/1475-2859-11-144.
- Schäpper, D., R. L. Fernandez, A. E. Lantz, F. Okkels, H. Bruus, and K. V. Gernaey. 2011. Topology optimized microbioreactors. Biotechnology and Bioengineering 108:786–96. doi:10.1002/bit.23001.
- Shafaghat, H., G. D. Najafpour, P. S. Rezaei, and M. Sharifzadeh-Baci. 2009. Growth kinetics and ethanol productivity of Saccharomyces cerevisiae PTCC24860 on various carbon sources. World Applied Sciences Journal 7:140–44.
- Sibalija, T. V., and V. D. Majstorovic. 2012. An integrated approach to optimise parameter design of multi-response processes based on Taguchi method and artificial intelligence. Journal of Intelligent Manufacturing 23:1511–28. doi:10.1007/s10845-010-0451-y.
- Sivakumaran, N., J. Sarat Chandra, and T. K. Radhakrishnan. 2006. Identification and control of bioreactor using recurrent networks. Instrumentation Science & Technology 34:635–51. doi:10.1080/10739140600963871.
- Sivaraj, R., and T. Ravichandran. 2011. A review of selection methods in genetic algorithm. International Journal of Engineering Science and Technology 3:3792–97.
- Snoep, J., M. Mrwebi, J. M. Schuurmans, J. M. Rohwer, and M. J. T. de Mattos. 2009. Control of specific growth rate in Saccharomyces cerevisiae. Microbiology 155:1699–707. doi:10.1099/mic.0.023119-0.
- ul-Haq, I., and H. Mukhtar. 2006. Fuzzy logic control of bioreactor for enhanced biosynthesis of alkaline protease by an alkalophilic strain of Bacillus subtilis. Current Microbiology 52:149–52. doi:10.1007/s00284-005-0236-2.
- van Dijken, J. P., R. A. Weusthuis, and J. T. Pronk. 1993. Kinetics of growth and sugar consumption in yeasts. Antonie Van Leeuwenhoek Journal of Microbiology 63:343–52. doi:10.1007/BF00871229.
- Vaseghi, S., A. Baumeister, M. Rizzi, and M. Reusse. 1999. In vivo dynamics of the pentose phosphate pathway in Saccharomyces cerevisiae. Metabolic Engineering 1:128–40. doi:10.1006/mben.1998.0110.
- Woodley, J. M., and K. V. Gernaey. 2013. Microreactors and CFD as tools for biocatalysis reactor design: A case study. Chemical Engineering & Technology 36:1017–26. doi:10.1002/ceat.201200667.
- Xu, B.-L., and Y. Tao. 2006. External noise and feedback regulation: Steady-state statistics of auto-regulatory genetic network. Journal of Theoretical Biology 243:214–21. doi:10.1016/j.jtbi.2006.06.003.
- Zhang, Z., P. Boccazzi, H.-G. Choi, K. F. Jensen, and A. J. Sinskey. 2006. Microbioreactor for continuous cell culture. U.S., Patent No. WO2006037022 A2, April 6.
- Zhang, Z., J. M. Scharer, and M. Moo-Young. 1997. Mathematical model for aerobic culture of a recombinant yeast. Bioprocess Engineering 17:235–40.
- Zhang, Z., N. Szita, P. Boccazzi, A. J. Sinskey, and K. F. Jensen. 2006. A well-mixed polymer based microbioreactor with integrated optical measurements. Biotechnology and Bioengineering 93:286–96. doi:10.1002/(ISSN)1097-0290.