
Abstract
This study investigated the relationship between adverse events and infrastructure development projects in an active theater of war using fuzzy inference systems (FIS) with the help of fuzzy clustering that directly benefits from its prediction accuracy. Fourteen developmental and economic improvement projects were selected as independent variables. These were based on allocated budgets and included a number of projects from different time periods, urban and rural population density, and total number of adverse events during the previous month. A total of four outputs reflecting the adverse events in terms of the number of people killed, wounded, or hijacked and the total number of adverse events has been estimated. The performance of each model was investigated and compared to all other models with calculated mean absolute error (MAE) values. Prediction accuracy was also tested within ±1 (difference between actual and predicted value) with values around 90%. Based on the results, it was concluded that FIS is a useful modeling technique for predicting the number of adverse events based on historical development or economic project data.
INTRODUCTION
Irregular warfare is defined by the U.S. Department of Defense as “a violent struggle among state and non-state actors for legitimacy and influence over the relevant population(s) (United States Department of Defense Citation2010, p. 9).” It includes disproportional force to convince and hassle where opposite forces are not large or effective in their region (Clancy and Crossett Citation2007). The success of irregular warfare operations mostly depends on the safety of the civilian population, because the civilian population is at the center of irregular warfare. The military has made some adjustments to its force structure in recognizing the challenges of irregular warfare. Bhattacharjee (Citation2007) outlined a new field called human social culture behavior (HSCB) modeling to guide the U.S. military in understanding different types of cultures while operating in overseas countries (Drapeau and Mignone Citation2007).
The overarching aim of HSCB modeling is to enable the U.S. Department of Defense and the U.S. Government to better organize and control the human terrain during nonconventional warfare and other missions (HSCB Modeling Program Citation2009). HSCB models are therefore receiving considerable attention regarding current and future operational requirements. Because HSCB models can be defined as a complex system, computational modeling and simulation techniques are required to deal with this complexity (Cakit and Karwowski Citation2015; Çakıt et al. Citation2014). Computational social scientists are researching how observations of human behavior might be used to develop scientifically based models of HSCB events (Schmorrow and Nicholson Citation2011). HSCB models are developed in order to better understand the behavior and structure of organizational units at the macrolevel (economies, politics, sociocultural regions) and microlevel (terrorist networks, tribes, military units; Stanton Citation2007).
Different kinds of modeling approaches are being used in this field, but so far none has been widely accepted. To the best of our knowledge, there is currently no study on the use of any computational methodology for representing the relationship between adverse events and infrastructure development investments in an active theater of war. This study investigated the application of fuzzy inference systems (FIS) that directly benefit from their accuracy in prediction applications to examine the relationship between adverse events and infrastructure development projects in Afghanistan.
BACKGROUND
Trying to solve problems related to social science data represents the various difficulties encountered, and some of these challenges have been highlighted by other researchers. For instance, Numrich and Tolk (Citation2010) summarized these challenges as a lack of common vocabulary, variations in modeling approaches, and data acquisition. Schmorrow et al. (Citation2009) emphasized the challenge of leveraging modeling and simulation for HSCB. They noted the difficulty in understanding which modeling and simulation tools are actually useful and when and how best to use these tools at different complexity levels. All of the challenges illustrated by these authors must be understood, and researchers should meet specific modeling requirements before proceeding to apply various methodologies in the HSCB field.
Models of human behavior could be used to predict the effects of actions intended to disrupt terrorist networks. These groups of studies emerge from data-driven, statistical approaches where the modeler empirically derives the HSCB model from patterns identified in the data (Zacharias, MacMillan, and Van Hemel Citation2008). Because terrorist attacks are not random in space and time, they do exhibit patterns. It is possible to discover representative patterns in adverse activity or behavior over time and space by analyzing geospatial intelligence on various reported incidents as stated by the director of the National Intelligence Open Source Center (Federation of American Scientists Citation2009).
A study of terrorism in Afghanistan highlighted various types of analyses that include
spatial patterns and a distribution of incidents that would be valuable to those interested in the dynamics of Afghanistan’s security, more specifically those analyses included in this study are as follows: mapping incident density, identifying the dominant ethnic group where incidents occurred, mapping incidents by district, mapping incidents by province, identifying the mean center of incidents over time, calculating the standard deviation (spatial pattern/trend) of overall incidents, mapping total incidents by month, and computing the mean center of incidents by month. (Open Source Center Citation2009, p. 1)
The study of spatial and temporal patterns of terrorist attacks is gaining increasing interest in the academic literature. Thus, spatial and temporal analyses have been used by several authors to analyze patterns. Recently, LaFree et al. (Citation2012) examined spatial and temporal patterns of all terrorist attacks attributed to the Euskadi Ta Askatasuna (ETA) (a Spanish separatist group) from 1970 to 2007. They considered how the approaches of terrorist groups may have a relationship with their geospatial attack patterns over time. Siebeneck et al. (Citation2009) used historical data from 2004 to 2006 and developed a series of analyses to understand terrorist activity spaces and counterterrorist actions. They focused on terrorist incidents in Iraq in order to detect patterns. They applied several methodologies such as clustering analysis, spatial and temporal statistics, and global information sytems to provide knowledge about patterns. Brown, Dalton, and Hoyle (Citation2004) highlighted a specific event (suicide bombings) to represent the difficulties in understanding and preventing terrorist attacks. They proposed a fusion model that is a combination of spatial likelihood modeling of environmental characteristics and logistic regression modeling of demographic features. They concluded that the fusion model shows better performance than other methods, such as kernel density estimation methods. Johnson and Braithwaite (Citation2009) highlighted the space–time clusters of improvised explosive device and non-improvised explosive device attacks in Iraq from January to June 2005.
Webb and Cutter (Citation2009) described a trend in terrorist incidents with respect to space and time in the United States spanning the years 1970 through 2004. In this paper, the authors highlighted several aspects of terrorist incidents by applying spatial statistics. Reed, Colley, and Aviles (Citation2013) aimed to demonstrate a proof of concept that a statistical understanding of terrorists’ behaviors could be used to predict future behavior patterns. They applied a time correlation–based prediction approach and identified trends in the behaviors of terrorists. They concluded that these trends could be used for predicting future attacks and it might help decision makers to allocate more resources and personnel to places and targets that are more likely to be attacked.
Fuzzy inference systems, artificial neural networks, and neuro-fuzzy models can be applied independently, as well as jointly, depending on the domain of application. Inyaem et al. (Citation2010) applied FIS for event classification in the domain of terrorism. They presented a comparison of these frameworks of classification using FIS with structured and unstructured events and a comparison of structured event frameworks of classification using FIS and adaptive neuro-fuzzy inference systems (ANFIS) in the terrorism domain. They concluded that ANFIS gives better performance than FIS for event classification to support decision making for the prediction of terrorism events.
METHODOLOGY
The Data Set
Two different Afghanistan data sets were provided by HSCB program management (from 2001 to 2010) and used in this research
The adverse event data set has information about the date of the event; incident type; number of dead, wounded, and hijacked; province, city, and district; description of the event; and simple event summary.
The infrastructure development data set has information about the population density, province, city, district, country, project types, allocated budget information for different sectors, types of construction, and usage of air fields.
In this research, the total budget of 14 project types considered at years t = 0 (i.e., current year), t − 1 (previous year), and t − 2 (2 years ago); number of adverse events in the previous month; and the urban and rural population (male and female) are used for the estimation purpose of adverse events numbers in year t + 1. Thus, the team was able to include a total of 89 inputs and four outputs reflecting adverse events. The data format used in this study is illustrated in .
TABLE 1 Variables used in model construction
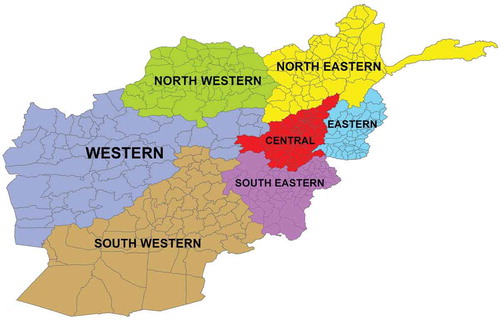
All data used for this study reflect events or project types that took place between the years 2004 and 2010. The data were divided into input and output data sets for analysis. Thirty-two different prediction models were developed, based on the number of output variables and regions, and summarized for Afghanistan (). A number of provinces, districts, and corresponding training and testing data sets for each region are shown in .
TABLE 2 Province and district info for each region
FIGURE 1 Regions of Afghanistan.
As illustrated in , the research was addressed using the following steps.
FIGURE 2 FIS flow diagram used in this study.
Fuzzy Sets
An alternative approach to the bivalued (true or false) logic of Aristotle was discussed by Lukasiewicz ([Citation1920] 1967), who defined a three-valued logic, one term of which can be translated as “possible,” and he assigned it an arithmetic value between true and false (Fullér Citation1999). The concept of fuzzy sets was initiated by Zadeh (Citation1965) and represents imprecise data and an extension of classical set theory. A fuzzy set is defined by “a function that ranges between 0 and 1, which assigns the degrees of membership to each element in a set” (Ammar and Wright Citation2000, p. 287). Following the first publication on fuzzy set theory by Zadeh (Citation1965), he suggested a linguistic description of human thinking (Zadeh Citation1968) and a linguistic approach for modeling complex and ill-defined systems related to fuzzy systems (Zadeh Citation1973).
As shown in , in classical set theory the membership of elements in relation to a set is defined in binary terms based on the “crisp” condition (an element is either part of the set or it is not). On the other hand, fuzzy set theory allows continuous assessment of the membership of elements in relation to a set; this is represented by the membership function defined in the real unit interval [0, 1]. Therefore, the crisp sets are special cases of fuzzy sets; in other words, crisp sets are subsets of fuzzy sets (crisp sets ⊆ fuzzy sets).
TABLE 3 Comparison of fuzzy sets and crisp sets
A fuzzy system consists of five functional blocks, including fuzzification, database, rule base, FIS (inference operations), and defuzzification (). Moreover, input and output variables can be included. A fuzzification interface maps real input numbers into fuzzy sets with linguistic values such as low, medium, and high. Each mapping is represented by its membership functions; a fuzzy rule base contains a number of fuzzy “IF–THEN” rules that include all possible fuzzy relationships between the input and output values and a database that describes the membership functions of the fuzzy sets used in the fuzzy rules.
FIS are also called fuzzy rule–based systems, fuzzy models, fuzzy expert systems, and fuzzy associative memory and perform the inference operations through a set of fuzzy rules. By formulating suitable IF–THEN rules, decision making, which is a crucial part for the entire system, occurs in this unit.
There are two categories of fuzzy inference systems called the Mamdani and Takagi-Sugeno-Kang models. These models have been generally used for solving problems in several applications, including decision analysis, expert systems, prediction, data classification, image processing, optimization, control, and system identification. The aggregation of rules and defuzzification approach are not the same for each type of models.
Data Clustering
Data clustering allows separation of data sets into groups such that identical data sets belong to the same cluster and nonidentical data sets belong to different clusters. The main aim of data clustering is to determine representative behavior of a complex system from a large data set. MATLAB functions allow the determination of the number of clusters using an input–output data set. Using clustering algorithms helps to generate less complicated FIS by using fewer rules. In this research, we applied fuzzy C-means (FCM) and subtractive clustering algorithms to our data.
Fuzzy C-Means Clustering
Fuzzy clustering algorithms can be defined as a type of cluster analysis in which the portion of data points to clusters is fuzzy in the same sense as fuzzy sets. Fuzzy clustering can be considered a soft computing technique. In real-world problems, there is usually an imprecise boundary between clusters, so fuzzy clustering can be applied for this kind of data set. Similar to FIS, membership functions are used in fuzzy clustering to represent imprecise terms. For instance, a point can belong to cluster 1 and cluster 2 with the same degree of membership (μ = 0.5). The most prominent fuzzy clustering algorithm is the FCM proposed by Dunn (Citation1973) and improved by Bezdek (Citation1981), a fuzzification of k-means. It is based on minimization of the following objective function (Eq. (1)):
where m is any real number larger than 1, is the degree of membership of
in the cluster j,
is the ith element of d-dimensional measured data,
is the d-dimension center of the cluster, and * is any norm expressing the similarity between any measured data and the center.
Fuzzy partitioning is carried out through an iterative optimization of the objective function shown above, with the update of membership and the cluster centers
. The algorithm can be summarized as the following sequence of steps:
Step 1: Initialize U = [Uij] matrix, U(0).
Step 2: At k-step: calculate the centers vectors C(k) = [cj] with U(k).
Step 3: Update U(k), U(k+1).
Step 4: If
then STOP; otherwise, go to Step 2.
Subtractive Clustering
Subtractive clustering was introduced by Chiu (Citation1994). It is a rapid and one-pass algorithm to determine the number of clusters and their centers in a given data set. The subtractive clustering algorithm can be summarized as follows (Eq. (4)):
where is a density measure at data point
, and
is a positive constant that represents neighborhood radius. A data point has a high density value if its neighboring data points are too much.
is selected as a point that has the highest density
. Then the density measure for each data point
is updated as follows (Eq. (5)):
where is a positive constant. Thus, the data points close to the initial cluster center
will have a significantly reduced density measure. These data points will therefore have a low probability of being selected again. After the density function is updated, the next cluster center is chosen as a point that has the highest density value. This process continues until an adequate number of cluster centers have been generated.
Performance Metrics
Performance metrics have been used for calculating the error (difference between actual and predicted values) in the model. There are several performance metrics, including mean square error (MSE), root mean square error (RMSE), mean absolute error (MAE), and mean absolute percentage error. RMSE and MAE are dimensioned measures of average model prediction error. Willmott and Matsuura (Citation2005) stated that RMSE is not appropriate as an indicator of average error. In other words, the interpretation of RMSE is unclear because there is no persistent functional relationship between RMSE and average error. They concluded that MAE must be used as the most natural measure of average error.
In this research, and in order to calculate the performance of FIS models, model accuracy was evaluated based on the MAE between the predicted and actual values. The following equations (Eqs. (6) and (7)) are used for this calculation:
Moreover, prediction accuracy was tested within ±1 (difference between actual and predicted value). The following equation (Eq.(8)) is used for calculation of this percentage value:
where Pi and Ai are predicted and actual values, respectively; ei is the prediction error for each record; and N is the total number of testing records.
RESULTS AND DISCUSSION
FIS Model Development
For development of the models, we generated FIS using FCM and subtractive clustering algorithms. Divided sets of dependent and independent variables were categorized according to the training and testing data (85.71% for constructing FIS and 14.29% for testing). To generate FIS models from data using a FCM algorithm, the MATLAB function “genfis3” was used. The parameters of the “genfis3” function (input data, output data, and type of FIS) generate a Mamdani or Sugeno FIS structure. In this research, we selected the Mamdani type, which gives lower MAE values than the Sugeno type. The number of clusters identifies the quantity of rules and membership functions in the created FIS. In this research, the number of clusters varies from one to 300. FIS experimental results of all configurations based on dependent variables and regions were represented in the following sections. All membership functions were selected as Gaussian-type membership functions. For instance, the number of clusters for the dependent variable number of people killed for the central region was calculated as six, based on the minimum MAE value. Therefore, the number of membership functions and rules for all of the independent and dependent variables is equal to six for this model.
For some cases, the FCM algorithm did not perform very well; therefore, the subtractive clustering algorithm was applied for the southwestern region for two dependent variables: the number of people killed and wounded. To create an FIS model from the data set using subtractive clustering, the MATLAB function “genfis2” was used. This function needs a cluster radius to be specified. A small cluster radius results in many small clusters and many rules. In contrast, a large cluster radius results in few large clusters and few rules. We assigned a cluster radius of 0.1, which gives the minimum MAE value.
Experimental results of configurations based on the number of clusters for dependent variables and each region are shown in . For the number of people killed, the MAE values vary between 0 and 2, except for the southwestern region and the entire country. Corresponding percentage values of prediction performance vary around 90%. All regions except the southwestern region had a better prediction performance percentage values than did Afghanistan as a whole. The northwestern region had the best prediction performance accuracy among the seven regions, where the MAE value was 0.44 and the percentage value of prediction performance was 94.09%. In contrast, the southwestern region had the worst prediction performance accuracy, with a calculated MAE value of 2.0278 and prediction performance of 76.94%.
TABLE 4 FIS best model configuration for dependent variables in each region
For the number of people wounded, the MAE values vary between zero and three except for the central region and the entire country. Corresponding percentage values of prediction performance vary around 80%. The northeastern, southwestern, and northwestern regions showed better prediction performance percentage values than did Afghanistan as a whole. The northwestern region had the best prediction performance accuracy among the seven regions, with an MAE value of 0.569 and prediction performance of 92.87%. In contrast, the central region had the worst prediction performance accuracy; the MAE value was calculated to be 4.93 and the percentage value of prediction performance was 71.06%.
For the number of people hijacked, the MAE values vary between 0 and 1 for all regions and the entire country. The corresponding prediction performance varies around 92%. The northeastern and northwestern regions had better prediction performance percentage values than Afghanistan as a whole. The northeastern region had the best prediction performance accuracy among the seven regions, with an MAE value of 0.235 and prediction performance of 96.26%. In contrast, the southeastern region had the worst prediction performance accuracy; the MAE value was calculated as 0.64 and the prediction performance was 92.07%.
For the total number of adverse events, the MAE values vary between 0 and 1 for all regions except for the southeastern and southwestern regions. The corresponding prediction performance varies around 85%. The central, eastern, northeastern, southeastern, and northwestern regions had better prediction performance percentage values than Afghanistan as a whole. The northeastern region had the best prediction performance accuracy among the seven regions; the MAE value was 0.4827 and the prediction performance was 89.17%. In contrast, the southwestern region had the worst prediction performance accuracy, with an MAE value of 1.294 and prediction performance of 77.08%.
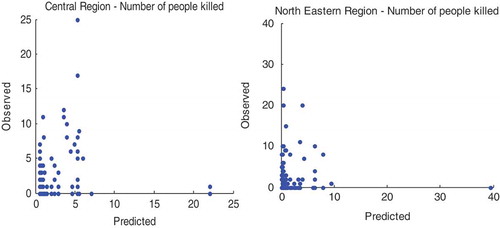
provides information about FIS-predicted and observed values of number of people killed for central and northeastern regions.
FIGURE 4 FIS-predicted and observed values of number of people killed for central and northeastern regions.
CONCLUSION
In this study, an FIS with the help of fuzzy clustering was applied to estimate the occurrence of adverse events for Afghanistan and its seven regions. FIS has been employed to relate population density and developmental or economic project type, categorized by the amount of funds allocated to the number of adverse events in that region taking place in the same time period. According to the the results obtained, it was concluded that FIS is a useful modeling technique to predict the number of adverse events based on historical development or economic projects data. Such modeling approaches can be considered to support decision makers who analyze historical economic data on how a regional budget or funds allocation can best help reduce or minimize adverse events. In summary, these techniques examined the relationship between adverse events and infrastructure development in an active theater of war. These models may be considered as general types that used data from Afghanistan for validation and verification. The model has applicability for other countries looking to build up their infrastructure while terrorist and military activities are continuing.
ACKNOWLEDGMENTS
The authors acknowledge the helpful guidance of the ONR Program Management and contributions of the technical team.
FUNDING
This study was supported in part by Grant No. 1052339, Complex Systems Engineering for Rapid Computational Socio-Cultural Network Analysis, from the Office of Naval Research.
Additional information
Funding
References
- Ammar, S., and R. Wright. 2000. Applying fuzzy-set theory to performance evaluation. Socio-Economic Planning Sciences 34:285–302. doi:10.1016/S0038-0121(00)00004-5.
- Bezdek, J. C. 1981. Pattern recognition with fuzzy objective function algorithms. New York: Plenum Press.
- Bhattacharjee, Y. 2007. Cross-cultural research: Pentagon asks academics for help in understanding its enemies. Science 316 (5824):534–35. doi:10.1126/science.316.5824.534.
- Brown, D., J. Dalton, and H. Hoyle. 2004. Spatial forecast methods for terrorist events in urban environments. Lecture Notes in Computer Science, 3073: 426–435.
- Cakit, E., and W. Karwowski. 2015. Assessing the relationship between economic factors and adverse events in an active war theater using fuzzy inference system approach. International Journal of Machine Learning and Computing 5 (3):252–57. doi:10.7763/IJMLC.2015.V5.516.
- Çakıt, E., W. Karwowski, H. Bozkurt, T. Ahram, W. Thompson, P. Mikusinski, and G. Lee. 2014. Investigating the relationship between adverse events and infrastructure development in an active war theater using soft computing techniques. Applied Soft Computing 25:204–14. doi:10.1016/j.asoc.2014.09.028.
- Chiu, S. L. 1994. Fuzzy model identification based on cluster estimation. Journal of Intelligent and Fuzzy Systems 2 (3):267–78.
- Clancy, J., and C. Crossett. 2007. Measuring effectiveness in irregular warfare. Parameters 37 (2):88.
- Drapeau, M. D., and B. K. Mignone. 2007. Culture, conflict, and … climate? Science 316 (5831):1564. doi:10.1126/science.316.5831.1564b.
- Dunn, J. C. 1973. A fuzzy relative of the ISODATA process and its use in detecting compact well-separated clusters. Journal of Cybernetics 3:32–57. doi:10.1080/01969727308546046.
- Federation of American Scientists. 2009, May 5. A GEOINT analysis of terrorism in Afghanistan. Secrecy News. http://www.fas.org/blog/secrecy/2009/05/05 ( accessed May 3, 2012).
- Fullér, R. 1999. Introduction to Neuro-Fuzzy Systems. Wurzburg: Physica-Verlag.
- HSCB Modeling Program. 2009. Human Social Culture Behavior Modeling Newsletter. http://www.dtic.mil/biosys/docs/HSCB-news-spring-2009.pdf (accessed March 19, 2012).
- Inyaem, U., P. Meesad, C. Haruechaiyasak, and D. Tran. 2010. Terrorism event classification using fuzzy inference systems. International Journal of Computer Science and Information Security 7 (3): 247–256.
- Johnson, S. D., and E. Braithwaite. 2009. Spatio-temporal modeling of insurgency in Iraq. In Reducing terrorism through situational crime prevention: Crime prevention studies, ed J. D. Freilich, and G. R. Newman, vol. 25, 9–32. Monsey, NY: Criminal Justice Press.
- LaFree, G., L. Dugan, M. Xie, and P. Piyusha Singh. 2012. Spatial and temporal patterns of terrorist attacks by ETA 1970 to 2007. Journal of Quantitative Criminology 28 (1):7–29. doi:10.1007/s10940-011-9133-y.
- Łukasiewicz J., 1920. O logice trójwartościowej (in Polish). Ruch filozoficzny 5:170–171. English translation: On three-valued logic, in L. Borkowski (ed.), Selected works by Jan Łukasiewicz, North–Holland, Amsterdam, 1970, pp. 87–88.
- Numrich, S. K., and A. Tolk 2010. Challenges for human, social, cultural, and behavioral modeling. SCS M&S Magazine ( January): 1–9.
- Open Source Center. 2009. Afghanistan—Geospatial analysis reveal patterns in terrorist incidents 2004–2008. http://www.fas.org/irp/dni/osc/afghan-geospat.pdf ( accessed May 3, 2012).
- Reed, G. S., W. N. Colley, and S. M. Aviles. 2013. Analyzing behavior signatures for terrorist attack forecasting. The Journal of Defense Modeling and Simulation: Applications, Methodology, Technology, 10 (2) 203–213.
- Schmorrow, D., G. L. Klein, R. Foster, J. Boiney, S. Biggerstaff, P. R. Garvey, M. Koehler, and Costa, B. 2009. Applied use of socio-cultural behavior modeling and simulation: An emerging challenge for C2. Ft. Belvoir: Defense Technical Information Center, Rosslyn, VA.
- Schmorrow, D., and D. Nicholson. 2011. Advances in cross-cultural decision making. Boca Raton, FL: CRC Press.
- Siebeneck., L. K., R. M. Medina., I. Yamada., and G. F. Hepner. 2009. Spatial and temporal analyses of terrorist incidents in Iraq, 2004–2006. Studies in Conflict & Terrorism 32:591–610. doi:10.1080/10576100902961789.
- Sivanandam, S. N., S. Sumathi, and S. N. Deepa. 2007. Introduction to fuzzy logic using MATLAB. New York: Springer.
- Stanton., J. 2007. Evolutionary cognitive neuroscience: Dual use discipline for understanding & managing complexity and altering warfare. Paper presented at the International Studies Association Conference, Portugal, June 20, 2007. Available at http://ssrn.com/abstract=1946864 (accessed May 18, 2012).
- United States Department of Defense. 2010. Irregular Warfare: Countering Irregular Threats. Joint Operating Concept Version 2.0 17 May 2010 (Irregular Warfare Joint Operations Command, 2010), p. 9.
- Webb, J., and S. L. Cutter. 2009. The geography of U.S. terrorist incidents, 1970–2004. Terrorism & Political Violence 21:428–49. doi:10.1080/09546550902950308.
- Willmott, C. J., and K. Matsuura. 2005. Advantages of the mean absolute error (MAE) over the root mean square error (RMSE) in assessing average model performance. Climate Research 30 (1):79–82. doi:10.3354/cr030079.
- Zacharias, G. L., J. MacMillan, and S. B. Van Hemel, eds. 2008. Behavioral modeling and simulation: From individuals to societies. National Research Council, Washington, DC: National Academies Press.
- Zadeh, L. A. 1965. Fuzzy sets. Information and Control 8:338–53. doi:10.1016/S0019-9958(65)90241-X.
- Zadeh, L. A. 1968. Fuzzy algorithms. Information and Control 12:94–102. doi:10.1016/S0019-9958(68)90211-8.
- Zadeh, L. A. 1973. Outline of a new approach to the analysis of complex systems and decision processes. IEEE Transactions on Systems, Man and Cybernetics 3:28–44. doi:10.1109/TSMC.1973.5408575.