
ABSTRACT
Electric vehicles (EVs) have become increasingly popular all over the world in recent years. Many countries have been offering reward policies and facilitating the establishment of EV charging stations and battery exchange stations to encourage use of these vehicles by the public. However, in terms of electricity demand, the rapid establishment of EV charging stations and battery exchange stations may lead to significant increases in peak loads, the contracted capacities, and basic electricity charges. In this work, an intelligent EV energy management mechanism is proposed to make use of scheduling systems for the charging stations in order to determine when to store electricity in batteries according to the real-time electricity price and the recharging requirements of EVs. Meanwhile, a recharging suggestion module is presented in this work for locating the most suitable charging station or battery exchange station for an EV according to the available information on hand. When an EV cannot reach any charging station because it is running out of electric power, a mobile CV management module is used to assist the EV to find a suitable mobile CV for recharging. Notably, a well-known machine learning technique, multiobjective particle swarm optimization, was employed in this work to assist in solving the multiobjective optimization problems during the design of an energy management mechanism. The experimental results show that the proposed mechanism can balance the loading of battery charging and exchange stations, and lower the load peak to keep electricity cost down. Meanwhile, the recharging suggestion module can decrease the driving distance of EVs for finding the charging stations, as well as decreasing the waiting time wasted while charging. The mobile CV management module, for its part, can effectively prevent EVs from becoming stranded on the road because they have run out of electricity.
Introduction
Due to global warming effects and depletion of oil resources, many countries have turned their attention to the carbon reduction issue and are striving to accelerate the development of green energy industries and low-carbon economies. Although each country has developed standards and specifications for the carbon emissions of vehicles, the demand for fossil fuels is still increasing around the world. Thus, the question of how to adopt alternative energy resources, instead of using fossil fuels, has emerged as one of the major research topics in recent years. Most governments have adopted policies to promote the electric vehicle industry, and this is generally regarded as one of the most significant developing industries from the perspective of lowering carbon emissions.
Although electric vehicles (EVs) have the potential to reduce carbon emissions and local air pollution, the cost of EVs and batteries, their relatively short driving range, long charging times, and the inconvenient deployment of charging stations are the reasons why EVs cannot be widely adopted for transportation at present. There are two types of charging methods for EVs: one is to charge at the charging station, and the other is to replace the battery at a battery exchange station. Therefore, if we want to popularize the use of EVs, extensive development of an infrastructure in the form of charging stations and battery exchange stations is necessary. However, establishing more charging and battery exchange stations might result in the instability and overloading of power systems. Especially in areas with concentrated charging equipment, if there is no strategy in place by which to manage the power load for EVs and charging installations, power systems could possibly collapse in the future.
The driving range for EVs can be over 200 km based on reports in Clement-Nyns, Haesen, and Driesen (Citation2010), but this driving range might decrease with the increase of driving speed. Hence, there is a need for a recharging recommendation system that takes several factors into consideration, including the driving distance, the remaining electricity, the waiting time for completing the charging process, and the price for charging. Especially in rural areas where there are fewer charging and battery exchange stations, such a well-developed recharging recommendation system will assist in the convenience of recharging of EVs. Besides, mobile charging vehicles (CVs) can be used to provide recharging for EVs situated in areas with no charging and battery exchange stations, to make up for the lack of charging and battery exchange stations in those areas.
With the increasing number of EVs, the timing and the location for recharging EVs cannot be determined beforehand and a sudden high demand for electricity might happen. The irregularity of recharging requests could cause power cuts due to excessive electrical consumption, and might even result in damage to the circuit system or electrical components in a given local area. Therefore, a resource known as a distributed energy resource (DER), such as solar power or wind energy, can be well utilized to supply the load in terms of electrical consumption. In this work, we integrate the DER of the charging station to avoid the power grid system from overloading, and we dispatch the electricity generated from the DER to the appropriate charging stations, assuming some kind of conventional backup system exists.
In this work, an intelligent energy management mechanism for electric vehicles is proposed for tackling the aforementioned challenges. A well-known machine learning technique, multiobjective particle swarm optimization (MOPSO; Pham, Zhang, and Koh Citation2012), is employed in this work to assist in realizing several major functions of an energy management mechanism, such as recharging recommendations, recharging reservations, power shortage warnings, and seamless recharging services via mobile CVs, etc. The motivation for choosing MOPSO to implement the core modules in this work stems from the fact that swarm intelligence has been successfully applied in many areas, such as decentralized-based routing (Mavromoustakis and Karatza Citation2004), cell assignment in personal communication services networks (Shyu, Lin, and Hsiao Citation2004), earning prediction in investment decisions (Ko and Lin Citation2004), and TEAM workshop problem 22,Footnote1 which involves determination of the optimal design of a superconducting magnetic energy storage (SMES) device (Pham, Zhang, and Koh Citation2012). Notably, TEAM workshop problem 22 is a multiobjective optimization problem with many design variables and nonlinear constraints addressed by an open international working group named Testing Electromagnetic Analysis Methods (TEAM). The distinguishing feature of swarm intelligence is that it performs comparably with other advanced machine learning algorithms such as neural networks, and its computation overhead is quite low. A series of experiments were performed and the experimental results exhibit the feasibility and practicality of our proposed mechanism.
The remainder of this article is organized as follows. A survey of related work is presented in the next section. “The Proposed Energy Management Mechanism for Electric Vehicles” presents the proposed mechanisms. The simulation results are given in “Simulation Results.” Conclusions and future work are presented in the final section.
Related work
As mentioned in the “Introduction,” the driving range of EVs has already reached more than 200 km, but the electrical consumption per kilometer will be influenced by the driving speed, whether the same driving speed is maintained, and the road conditions. If an EV runs out of electricity while driving, and there are no charging stations nearby, mobile CVs can be deployed to meet the electrical charging demand. In the United States, the mobile charging trucks are currently employed by the American Automobile Association (AAA) for the mobile charging of EVs on the roadside (Ohnsman Citation2011). This kind of mobile charging truck is equipped with a quick charger to shorten the waiting time while charging. In the meantime, the Nissan motor company in Japan has been investigating various approaches to using mobile charging EVs for roadside assistance (Ohnsman Citation2011).
The deployment of charging facilities can affect the popularization of EVs. If charging is not convenient, consumers’ willingness to buy EVs will decrease. A range of products related to charging stations, such as Elektrobay (produced by Elektromotive) and Charge Point (produced by eTec and Coulomb Technologies), can provide the geographic locations of charging stations via GPS installed in the vehicle, and can indicate the route to the appropriate charging station. However, mobile charging services are still needed if no charging stations are nearby. Currently, both the charging station recommendations and the mobile charging services provided by these companies are not effective, because they cannot predict where a vehicle will be located when it runs out of power.
Nowadays, a number of researchers are working on the design of vehicle monitoring systems, and the technology is quite mature. Liu, Wu, and Chu (Citation2011) presented a wireless remote monitoring and fault diagnosis system for EVs. The system transfers vehicular data via a controller area network (CAN) bus to a monitoring center via GPRS and networks. This system can transmit real-time information, including GPS signals, current speed, RPM of a motor, the remaining electricity, the driving distance, and messages indicating malfunctions. However, this driving information has not been used to issue a required charging warning or nearby charging station recommendation. Moreover, the habits of the driver, such as fixed times for driving to work and fixed routes to work, are not considered in this system. Once the route and time information for driving can be obtained from the system, this information can be further used to construct a recharging recommendation system and make time predictions for electrical consumption in the future.
In the near future, if the market share of EVs keeps increasing, the loading of power systems might be affected, and the influence of some charging stations providing quick recharging service on the overall power system in the future has been discussed in the literature (Etezadi-Amoli, Choma, and Stefani Citation2010). Cao et al. (Citation2012). addressed three kinds of methods for minimizing the influence of recharging EVs on the power grid, including vehicle to grid (V2G), the utilization of energy management equipment (EME), and the mechanism of electricity pricing (Cao et al. Citation2012). Among these approaches, V2G means that an EV discharges the remaining energy stored in the battery into the grid if necessary. Masoum et al. (Citation2011) presented a smart load management system for plug-in EVs to tackle the problems that happen with charging stations in distribution and residential networks, and to allow for peak demand shaving and power loss minimization. A good energy management scheme properly implemented can boost the adoption and utilization of EVs by maintaining the balance between demand and supply. A smart energy control strategy based on quadratic programming for charging pluggable hybrid electrical vehicles (PHEVs) was presented by Mets et al. (Citation2010)to minimize the peak load and smooth the overall electrical load. A good electricity pricing policy is helpful in terms of allowing customers to make decisions about charging or discharging, depending on flexible electricity prices, and such policies can effectively change customers’ behaviors in terms of using electricity in their daily lives. For example, Markel, Kuss, and Denholm (Citation2009) introduced a model for recharging EVs according to real-time price information, in order to minimize charging costs and maximize discharging profits. However, other issues, such as those discussed above, need to be resolved in order to make this charging model feasible and effective.
With the possible exhaustion of oil resources in the future and the emergent demand for reducing carbon emissions and improving energy efficiency, the value of DERs such as wind power, solar power, tidal power, and geothermal power has been recognized in recent years. Also, some countries, such as France, which still remains largely dependent on nuclear energy, also want to develop DERs in order to avoid the associated nuclear risks. Ipakchi presented a distributed management system that reflects the demand side to integrate renewable resources (Ipakchi Citation2011). With the help of demand-side management applications, the generating capacity of renewable resources can be adjusted based on the flexibly of demand response feedback. Lasseter demonstrated the advantages of microgrid concepts on the management of DERs (Lasseter Citation2011). However, the intermittent characteristic of power generation for DERs makes it necessary that the generating capacity of DERs be coordinated, in order to balance the power distribution. In addition, questions of how to schedule the charging times for storage facilities, decrease the influence on the system, and fully utilize DERs are important issues that need to be addressed.
Some research has discussed the issue of load forecasting, but most studies have relied on rather complicated ways to carry out the forecasting work. Alamaniotis, Ikonomopoulos, and Tsoukalas (Citation2012) proposed an evolutionary multiobjective optimization algorithm to predict a five-minute load, but the predicted time is too short to meet the need. Some studies have used wavelet neural networks to predict a short-term load (Guan et al. Citation2013; Daneshi and Daneshi Citation2008), but this method introduces too much computation overhead and, thus, undermines its feasibility.
The proposed energy management mechanism for electric vehicles
and show the schematic and the architecture, respectively, of the proposed mechanism. The proposed intelligent energy management mechanism is composed of seven modules located at regional servers, upper-level regional servers, charging and battery exchange (C&BE) stations, and cell phones/On-Board Units (OBUs), as illustrated in . The C&BE energy management module resides at each regional server and can arrange the power preload schedules to achieve load balancing among C&BE stations. That is, the C&BE energy management module administers the power management and the calculation of electricity price for all C&BE stations. This C&BE energy management module also collects the real-time driving information via OBUs or handheld GPS devices.
Figure 1. Schematic of the proposed intelligent energy management mechanism.
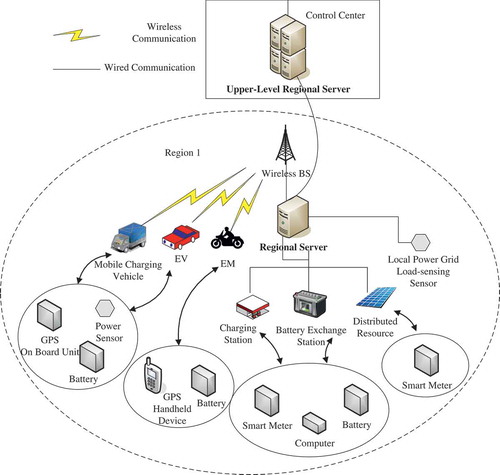
Figure 2. Architecture of the proposed intelligent energy management mechanism.
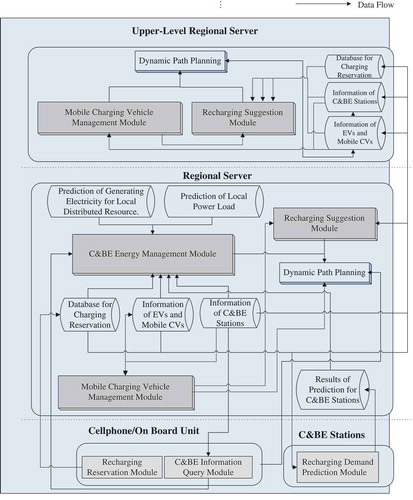
Based on the power preloading schedules, the up-to-date driving information, and the location information with regard to available mobile CVs and C&BE stations, the recharging suggestion module located at each regional server can inform drivers in advance if an EV needs recharging. Notably, if the available mobile CVs and C&BE stations are not located in the same region where the EV currently resides, a regional server at the upper level will take over to plan an overall recharging suggestion to decrease the loading of local servers in each region. The recharging suggestion module can assist in determining if the remaining electricity of an EV is sufficient to allow it to arrive at the planned destination. Once the remaining electricity is determined to be insufficient, the system will locate the most suitable C&BE station for the EV.
After determining the most suitable C&BE station for the EV, dynamic path-planning modules located at regional servers can be employed to determine the shortest path to the C&BE station. Notably, the dynamic path planning presented in this work utilizes the A* algorithm to assist the deployment of a mobile CV and to plan an optimal path while executing the EV recharging rescue task (Zhan and Noon Citation1998). In the literature, the A* algorithm has been shown to be the most effective one, by virtue of its ability to obtain the optimal path by computing the minimum path length from every node to the destination. The C&BE energy management module transfers each user’s current condition and estimations of her/his requirements to the governing local regional servers, and this achieves power load balancing and integrates the DERs. The functionality of the mobile CV management module includes the ability to identify the optimal deployment strategies for mobile CVs and direct the mobile CVs to move to the location where an EV might be likely to run out of power on the road. Seeing as mobile CVs represent a scarce resource, the dispatching of mobile CVs for EVs is limited to emergency situations, and the number of backup mobile CVs available to rescue stranded EVs requires manual adjustment. More-detailed descriptions of the aforementioned modules are provided in the following subsections.
As will be seen, the C&BE energy management module and the mobile CV management module involve solving multiobjective optimization problems. A well-known computational method, MOPSO, is utilized to simultaneously optimize more than one objective function. Complementarily, traditional particle swarm optimization (PSO) is employed to solve single-objective optimization problems occurring in the recharging suggestion module. In this work, the optimization problems include the lowest charging cost, the shortest charging waiting time, and the shortest distance between an EV and the optimal charging location. A more detailed description of MOPSO is provided in Appendix A.
C&BE energy management module
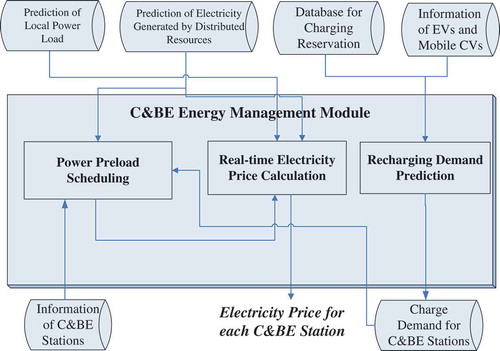
As shown in , the C&BE energy management module consists of three components: power preload scheduling, real-time electricity price calculation, and recharging demand prediction. The function of the power preload scheduling submodule is to achieve power load balancing and integrate the DERs according to the prediction results relating to the recharging demands of C&BE stations. The real-time electricity price calculation submodule utilizes the power load prediction for C&BE stations and the recharging demands of EVs to calculate the up-to-date electricity price. That is, when there is a higher electricity load or higher recharging demands from EVs, the electricity price will be higher. Accordingly, some EV drivers might select C&BE stations with lower power loads to avoid paying higher electricity prices, although these drivers might need to take a longer route to get to the recharging service.
Figure 3. The proposed C&BE energy management module.
Power preload scheduling
In order to minimize the operation cost and balance the loading of each C&BE station, we use the following objective function to derive the electricity cost, , paid by each C&BE station,
where M(t) and P(t) represent the real-time electricity price and the total electricity the C&BE station receives from the power company at time t, respectively, N denotes the number of time slices for each day, which is determined by the power company; and t0 and tN represent the beginning and the end of the time slices each day, respectively.
The power used by each C&BE station cannot surpass the contracted capacity signed with the power company, otherwise the extra power used by the C&BE station will be charged at two to three times the regular electricity price. To minimize the electricity cost given by Equation (1), we first divide a day into N time sections. Due to the limitations of charging speed and capacity of a battery at a C&BE station, the capacity that can be charged into a battery can be expressed by
where Ecv,i denotes the contracted capacity that a C&BE station signed with the power company at the ith time section during a day, P(ti) stands for the total electricity that the station receives from the power company at the ith time section, Pbattery(ti) denotes the total capacity of the batteries at a C&BE station at the ith time section, and PDER,i(ti) represents the power generated by DERs governed by the C&BE station at the ith time section. Notably, Equation (2) is a constraint that limits the summation of the contracted capacity and the power generated by DERs from exceeding the capacity charged into a battery.
Then the electricity cost, , paid by each C&BE station can be rewritten as
where the second term on the right-hand side of this assignment is a constant; dm indicates the number of days in each different month, M() represents total energy costs per kW for a C&BE station at the jth time section, and the term P(
) multiplied by
represents the total energy cost for the C&BE station at the ith time section; Pcv and Ecv denote the contracted price per kW for each month and the hourly contracted capacity signed between the C&BE station and the power company, respectively. Therefore, the term Pcv multiplied by Ecv is the fee for the contracted power paid by the C&BE station each month.
In this work, daily loading information of a C&BE station, , is obtained by
where and
represent the predicted load information of a C&BE station at the ith time section during a day and the power generated at that hour by the DERs attached to the C&BE station, respectively. Notably,
can be obtained by using the recharging demand prediction module, as illustrated in , and the approach taken in Liang and Liao (Citation2007) is utilized in this work to estimate the electricity generated by local DERs,
. Next, we calculate the amount of energy available for transfer at the ith time section during a day as follows:
where ci represents and a set C = {c1,…,ci,…,cN} is used to record the values of ci. Cmean is the average of the values recorded in set C. Notably, if Ti is larger than zero, it implies that the battery of the C&BE station must discharge at the ith section during a day. We then obtain the total energy available for transfer for a day by adding all nonnegative Tis as follows:
We refer to the sequence in set C to distribute the energy available for charging. The requirement for charging is examined for each individual time section. If or Ti
0, a charging operation for the battery will not be executed at the ith time section. However, the charging can be initiated while
or Ti
0; and the amount that the battery can be charged at the ith time section is expressed by
Notably, the loading is expected to be close to 100%, whereas the power being charged into the battery does not exceed
in Equation (7). Meanwhile, the loading is expected to be transferred from high-peak periods to off-peak periods as designated by the energy supplier companies with our proposed C&BE energy management module. Also, the reason why we transferred the loading from high-peak periods to off-peak periods is to minimize the operation cost and to balance the loading of each C&BE station. If the power used by each C&BE station surpasses the contracted capacity signed with the power company, the extra power used by the C&BE station will be charged at two to three times the regular electricity price. For example, assume that an EV will be driven for a vacation, and it will be parked at a hotel. We can arrange for the EV to be charged during off-peak periods, usually at night and/or weekends; therefore, the charging cost can be lowered via our proposed C&BE energy management module by shifting electricity use to off-peak times.
As mentioned earlier, if Ti is larger than zero, the battery of the C&BE station must discharge at the ith section. The power discharged from the C&BE station at time section i, named , can be expressed by
where is the maximal electricity discharge of the battery at time section i, and the range of index i is from 0 to 23.
After the charging schedule for the batteries at each C&BE station is derived, we next attempt to optimize the operation of the DERs. That is, we will allocate the power generated from the DERs to each C&BE station by considering a proportional distribution approach, which means that C&BE stations with larger demand will receive more power from DERs, and thereby will achieve the load balancing of a regional power system. The power that the jth C&BE station obtains from the distributed energy source by can be expressed by
where represents the required power of the jth C&BE station at time section i and n represents the number of C&BE stations.
denotes the total energy generated by every DER at time section i.
We next allocate the power from suitable DERs to each C&BE station by considering the distance between the DERs and each C&BE station, as follows:
where and
denote the ith C&BE station that demands power and the jth DER, respectively. Here, we expect to calculate the minimal distance between the C&BE station and the DER. Each C&BE station will demand power from the nearest distributed energy source; if the power of the requested source is not sufficient to meet the demands of the C&BE station, the C&BE station will search for the next nearest distributed power source to provide power until the demand of the C&BE station has been met or until all distributed power sources have been checked.
In the event that DERs are unable to meet all the demands of C&BE stations, the power needed from power companies can be determined by
Real-time electricity price calculation for C&BE stations
This module takes into consideration the cost of electricity and the cost of batteries to produce dynamic prices, in order to allow C&BE stations to earn higher profits and lower the electricity price paid by customers. Meanwhile, the strategy of dynamic pricing can guide customers to use C&BE stations with lower load by keeping the electricity price positively correlated with power load.
The sources of the power of a given C&BE station include its own power resources, other C&BE stations, and power companies. Thus, the cost of distribution of energy resources will be reflected in the electricity price that the customers pay. If the power is received from a power company, the electricity price will be affected by the regional power load. Accordingly, the dynamic electricity price computed in this work can be expressed by
subject to
where denotes the electricity price of the hth time section and
is the predicted charge demand of a C&BE station;
represents the power expected to be discharged from the batteries at the C&BE station,
is the predicted generated power from the DERs owned by the C&BE station;
is the cost for every kWh generated by the DERs, ;
is the cost for every kWh consumed by a battery;
is the maximal regional power load during a day, multiplied by the hourly contracted capacity of the C&BE station with the power company, while
represents the predicted regional load multiplied by the predicted charge demand during a given time section, and r is the preset upper limit of the electricity price per kW. Notably, the goal of Equation (12) is to keep the electricity price within a reasonable range that consumers can accept.
Recharging demand prediction
This module predicts how much power a C&BE station discharges during a period of time. We first obtain some information about a vehicle from the EV’s data and the mobile CV’s database as shown in the upper part of , such as current position, remaining power, speed, and route plans, etc. We then predict the charge demand of an EV by
subject to
where denotes the charge demand of the EV and
is the total capacity of the EV;
stands for the remaining electricity of the EV;
denotes the distance from the EV to the ith C&BE station,
represents the speed of the EV, and
is the electricity that the EV consumes per hour. Notably,
and
are strongly correlated. That is, the electricity that the EV consumes increases as the EV drives faster.
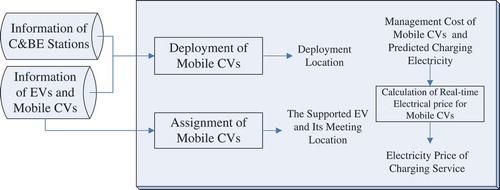
Recharging suggestion module
This module mainly assists an EV to determine the location at which to charge or exchange the battery. Based on the remaining electricity and the driving speed of an EV, the recharging suggestion module will search for the C&BE station or mobile CV that is closest to the user’s planned navigation path, with the lowest electricity price. However, if the user’s objective is to minimize the waiting time for charging service, this module will determine the suitable C&BE station or mobile CV where the EV can get charged immediately or exchange its depleted battery for a battery that has been fully charged, to minimize the waiting time. Notably, our proposed hierarchical architecture can deal with the case when the suggested charging station is located in another region. In other words, the local regional server where the EV is located will request the upper-level regional server to give the recharging suggestion if no C&BE stations and mobile CVs are available in the same region where the EV is located.
The inputs and the outputs for the proposed recharging suggestion for EVs are illustrated in . We first compute the electricity that an EV consumes before arriving at the ith C&BE station as follows:
Figure 4. The proposed recharging suggestion module.
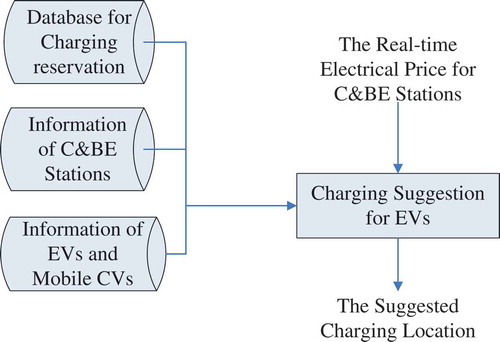
where denotes the distance from the EV to the ith C&BE station,
represents the speed of the EV, and
is the electricity that the EV consumes per hour.
The most suitable C&BE station that meets the need of the EV can be identified by,
subject to
where denotes the real-time electricity price of the ith C&BE station,
represents the battery capacity of the EV,
stands for the remaining electricity of the EV,
is the estimated time that the EV arrives at the ith C&BE station, and
represents the time before the ith C&BE station serves the EV.
Mobile charging vehicle management module
To avoid the situation in which an EV becomes stranded on the road due to the exhaustion of the battery power, this module deploys mobile CVs in the areas where there is no charging station nearby or where there are much higher demands for charging EVs. Meanwhile, we present a charging mechanism to make the deployment of mobile CVs more feasible for real-world applications. The flowchart for this module is presented in .
Deployment of mobile charging vehicles
In this study, the deployment of mobile CVs must be at locations where no charging stations are nearby or where the demands for charging rescues for EVs are higher. Therefore, the purpose of the deployment of mobile CVs is to determine the locations of mobile CVs that can support the regions that lack C&BE stations, or to determine the regions in which rescue requests made by EVs are frequent. Thanks to the fact that mobile base stations have already been operated for many years, the deployment techniques for mobile base stations are sufficiently mature. The mobile base stations need to know in advance the number of users at each deployment location, and the mobile base station must assign channels to each customer once she/he enters the communication range of the base station. However, the situation is different in terms of dealing with the deployment optimization problem for mobile CVs. It can be observed that not every EV will request the charging service from mobile CVs. Also, a mobile base station does not need to worry about the adequacy of power, whereas the mobile CV does. This situation leads us to the method of optimizing the deployment of the mobile CVs proposed in this work.
The deployed location of a mobile CV must be a place identified as being badly in need of mobile support for EVs. The following Equation (19) aims to find the optimal location k to make good use of a mobile CV’s power when each deployment decision for the CV is made. In other words, no matter where the mobile CV goes, it can make good use of the electricity, , needed for the EV requesting charging at the location k. If the location indexed by k can satisfy the constraint in Equation (20), it can be selected as the optimal deployed location of a mobile CV.
subject to
where P0 denotes the remaining electricity of mobile CVs, Pk is the required electricity for mobile CVs to arrive at the location indexed by k, Ph,k stands for the total electricity needed for the EVs requesting charging at the location k, and c represents the required reserved electricity for mobile CVs to prevent the mobile CV from running out of electricity before it returns to the C&BE station for recharging. Notably, Equation (20) is used to determine if a mobile CV has enough power to travel to the location k, and if it can meet its historical charging needs while arriving at the location k. Meanwhile, the location selected from Equations (19) and (20) can allow the mobile CV to support the greatest number of EVs requesting charging service, and the location selected is definitely the best deployment location of a mobile CV.
Figure 5. The proposed mobile CV management module.
Assignment of mobile CVs
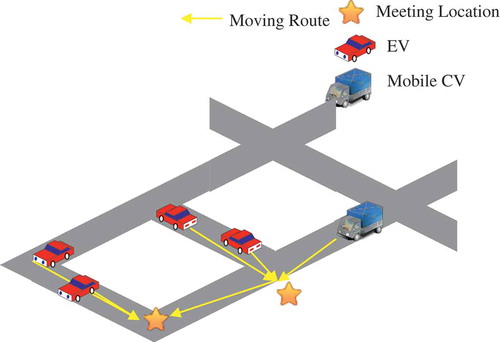
This module is used to assign mobile CVs to locations to meet the EVs requesting charging, in order to achieve the goal of seamless charging support. Kiam (Seow, Dang, and Lee Citation2010) proposed a taxi dispatch system that optimizes the taxi resources in order to reduce the waiting time for customers and to increase the efficiency of the taxi dispatch task. We refer to this method of distribution in order to make the assignment decision for mobile CVs. However, we modified Kiam’s algorithm in accordance with the characteristics of mobile CVs and EVs. For example, once EVs face a shortage of electricity, the location where mobile CVs and EVs will meet should be at a place where the EVs can arrive.
When assigning a mobile CV to the EV that requests charging service, we consider the locations of the mobile CVs, the available electricity of the mobile CVs, and the demanded electricity of the EV in order to decide whether a mobile CV is suited to providing the charging rescue service or not. Mobile CVs are deployed at different locations, and a mobile CV may simultaneously provide services to more than one EV, such as the mobile CV illustrated in . We thus employ the following equation to determine a suitable mobile CV to support multiple EVs requesting charging service:
Figure 6. An example of a mobile CV simultaneously serving multiple EVs.
subject to
where represents the available electricity of the jth mobile CV,
represents the constant of power consumption of the jth mobile CV as it moves to the location of the EV indexed by i,
denotes the total electricity requirement of the jth mobile CV incurred in reaching the EV indexed by i,
stands for the total power consumption of EV i, and
represents the power consumption of the jth mobile CV returning to the C&BE station for recharging. Notably,
denotes the total power consumption of the jth mobile CV after serving n EVs.
Next we determine the order that n EVs should be served by the jth mobile CV by
where the distance denotes the position of the jth mobile CV,
is the position of the ith EV that requests charging, and d represents the distance between the jth mobile CV and the ith EV. Therefore, we have to calculate the minimum d to search for the first EV served by the jth mobile CV, and with Equation (26), we can determine the order of each EV to be served by each mobile CV.
Calculation of real-time electricity price for mobile CVs
Mobile CVs not only offer service at fixed locations, but also need to move to other areas to provide service, such as the situation when an EV requests the charging service and has no electricity to move on the road. However, the charge for this kind of service would be higher than that for both the service of mobile CVs at fixed locations and C&BE stations. We thus consider the operation costs of mobile CVs, such as electricity cost and moving cost of mobile CVs, and derive the real-time electricity price for a mobile CV as follows,
where d is the total distance between a mobile CV and the EVs needing to be rescued, V is the average speed of the mobile CV while driving to the EVs requesting charging service, is the power consumption of the mobile CV per unit time,
is the required electricity for offering charging service,
denotes a profit coefficient that can be adjusted by the EV charging company, r is the cumulative operating cost per unit distance, i is the index for the closest C&BE station for the mobile CV to recharge,
and
denote the distance and average speed of the mobile CV while driving to the ith C&BE station, and
stands for the electricity that the mobile CV consumes per hour while driving to the ith C&BE station.
Simulation results
We ran a series of simulations to verify the feasibility and effectiveness of our proposed EV energy management mechanism. The simulation time lasted for one day, and each region had its own local server, which was governed by an upper-level regional server. The battery power consumption of EVs under constant speed is listed in , and the charging speed with reference to the relationship between the charging power and the charging time for a lithium battery used by EVs is illustrated in (Zhang et al. Citation2012). Each C&BE station has its own backup battery, which can store excess electricity or preload the electricity needed in the next time period. We examine EV charging and discharging during a day (24 h) starting from 12:00 midnight. The day is evenly divided into 24 intervals. Each interval has a length of 1 h. The traffic condition is set up in the urban environment with planned routes and does not include any highways. The battery energy is required to reach at least 90% of the battery capacity at the end of the charging period. The battery capacity at each C&BE station was set as 200 kW, and the charging cost was set at $ 0.07 US per kWh during nonsummer months according to Taiwan Power CompanyFootnote2 rates. In addition, the execution time of MOPSO is based on the number of EVs, and the average time per 1000 EVs is 600 seconds.
Table 1. Battery power consumption of EVs under constant speed.
Figure 7. Relationship between charging power and charging time for a lithium battery used by an EV.
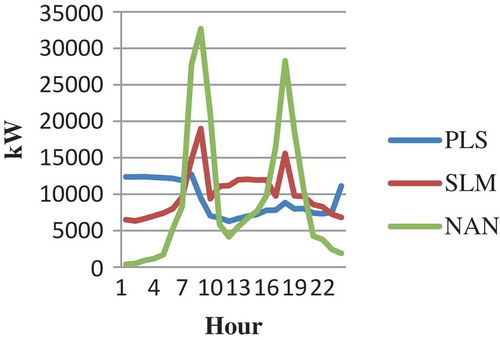
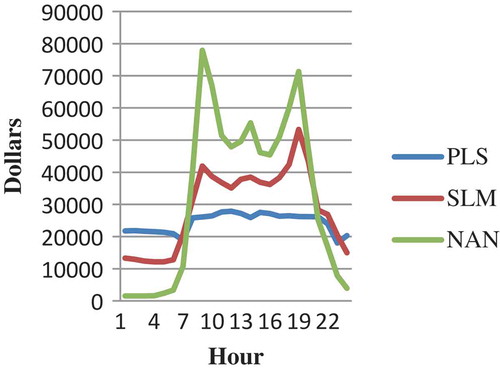
The first part of the simulations was designed to examine the performance of the proposed preload scheduling algorithm (PLS), the main purpose of which is to balance the loading among C&BE stations. The PLS was compared to the method that does not involve using any preloaded schedule (NAN) and a recently presented smart load management (SLM) algorithm found in the literature (Masoum et al. Citation2011). The number of C&BE stations was set at 450, and the performance metrics included load-balancing outcome and electricity cost.
represents the comparison of the load of C&BE stations among PLS, SLM, and NAN. We can observe that the curve of NAN had obvious peak loads at 9:00 and 19:00. These peaks made contracted electricity bills rise and increased the risk of electricity consumption exceeding the contracted capacity. Our proposed PLS not only included a charging-demand forecasting mechanism, but also considered the schedule of the contracted capacity and time-of-use tariff. At the same time, PLS can control the amount of charged and discharged electricity during each period of time, and make timely use of DERs for battery charging at C&BE stations in order to meet charging requirements of EVs. Accordingly, the highest peak load of PLS was found to be lower than the peak loads of SLM and NAN. Besides lowering the peak load, our proposed PLS can reduce electricity cost and achieve load balancing as well. In the simulations, we assumed that electricity during the period between 8:00 and 23:00 is more expensive than the rest of the time periods during a day. Thus, our PLS method avoided the situation of C&BE stations charging during the period of 8:00 and 23:00, in order to lower the electricity cost. That is why the loading of PLS from 8:00 to 23:00 is much lower than that of the other two compared algorithms, as shown in Figure 8. Notably, if the load is still too high during a given time period, PLS will release battery power to avoid drawing too much power from the power company in that period because the associated electricity price of the power company is higher.
Figure 8. Power load comparison of PLS, SLM, and NAN.
presents the comparison of electricity cost for C&BE stations for the three approaches. We can observe that the curve of the electricity cost for PLS is smoother than those of the curves for SLM and NAN. This is because the proposed PLS method allowed the batteries of C&BE stations to discharge in the time period from 08:00 to 22:00 in order to reduce electricity consumption during the high price period. However, the curve of the proposed PLS from 08:00 to 22:00 still rises slightly. The reasons for this phenomenon are that the charging demands of EVs from 08:00 to 22:00 and the battery capacity of C&BE stations are limited.
Figure 9. Electricity cost comparison of PLS, SLM, and NAN.
The second part of the simulations was conducted to confirm the performance of the proposed recharging suggestion module. The proposed EV energy management mechanism using the recharging suggestion module was compared with the same EV energy management mechanism without using the recharging suggestion module. The simulation environment was as follows. When the battery electricity of an EV was less than 30%, the EV would search for the nearest C&BE station for charging. If the EV could not arrive at any C&BE station due to the lack of electricity, the recharging suggestion module would assign a mobile CV to rescue the EV. The number of electric cars and electric motorcycles were 81,429 and 114,286, respectively, and the number of C&BE stations was set at 450.
lists the independent sample t-test results for the charging price with/without using the proposed recharging suggestion module, assuming α = 0.05 as the significance level. It can be observed that the mean and the standard deviation using the recharging suggestion module were both less than the mean and the standard deviation without using the recharging suggestion module, and the one-tailed significance (p-value) was smaller than as well. This experimental result revealed that our proposed method can effectively lower the electricity price.
Table 2. Comparison of the charging price with/without the recharging suggestion module.
We next analyze whether the EVs can decrease the driving distance in order for EVs to charge at C&BE stations after using the proposed recharging suggestion module. The independent sample t-test result, assuming α = 0.05 as the significance level, is given in . It can be seen that the p-value is smaller than α, and the means for those simulations using and without using the proposed recharging suggestion module are 3.51% and 10.04%, respectively, while the standard deviations for those simulations using and without using the proposed recharging suggestion module are 7.82% and 14.56%, respectively. Thus, it can be inferred that the proposed recharging suggestion method is effective in decreasing the unnecessary driving distance in order for EVs to charge at C&BE stations.
Table 3. Comparison of incremental change in driving distance in order for EVs to charge at C&BE stations with/without the recharging suggestion module.
After accepting the recharging suggestion, an EV may wait for a while at the C&BE station because the C&BE station is filled with EVs that need to be charged. We thus examined whether the proposed recharging suggestion module could effectively decrease the waiting time for charging through the independent sample t-test. As illustrated in , the p-value was smaller than α, and the mean and standard deviation for the simulations without using the proposed recharging suggestion module were 10.7425 and 11.6709, respectively, whereas those for the simulations using the proposed recharging suggestion module were 7.938 and 5.688, respectively. Hence, the proposed recharging suggestion module was proved to be able to effectively decrease the waiting time for EVs awaiting charging at C&BE stations.
Table 4. Comparison of charging waiting time for EVs with/without the recharging suggestion module.
The last part of the simulations was carried out to examine the effectiveness of the proposed mobile CV management module. We assumed that the number of EVs and mobile CVs were 264,286 and 36 per day, respectively. Four settings of different numbers of C&BE stations, including 400, 900, 1400, and 2600, were simulated to compare the successful ratio of rescues accomplished via the deployment of mobile CVs. The equation for calculating the successful ratio of rescues is given as follows:
shows the comparison between the successful ratio of rescues using the proposed mobile CV management module and the ratio using the compared target, random deployment, corresponding to different numbers of C&BE stations. When the number of C&BE stations was 400 or 900, which indicates that the C&BE stations were distributed sparsely, we can observe that the proposed mobile CV management module could effectively improve the ratio of successful rescues. It can be inferred that a greater number of EVs had a lower possibility of becoming stranded on the road as a result of running out of electricity, and therefore it would increase users’ satisfaction with the mobile charging service. However, when the number of C&BE stations was over 1400, which means the C&BE stations were intensively distributed, the successful ratio of rescues for the proposed mobile CV management module is similar with that of the comparable ratio for the random deployment of mobile CVs. This is because when C&BE stations were distributed more intensively, the EVs could easily reach the nearby C&BE stations. Therefore, the ratios of successful rescues for these two approaches have no significant difference in the dense deployment of mobile CVs.
Table 5. Comparison of successful rescue ratios.
Conclusion
The rapid establishment of the C&BE stations for EVs could lead to the significant increase of the peak loads, the contracted capacities, and basic electricity charges. In our work, the proposed EV energy management mechanism not only provides a seamless charging service for EVs, it also enhances the quality of the electricity supply of the charging stations, maintains the regional power grid stability, and achieves load-balancing. This work also integrates and optimizes the use of distributed energy, and thus lowers the operation costs and maximizes the profits of C&BE stations. There are three core modules in this work: (1) A C&BE charging management module is used to manage the power preload scheduling and predict charging demand effectively, thus lowering the peak load successfully and decreasing the cost of electricity for the C&BE stations. (2) An EV recharging recommendation module is employed to find the most suitable C&BE stations for EVs. (3) A mobile CV management module is used to search for the C&BE station or mobile CV that is closest to the planned navigation path of the EV, with the lowest electricity price. Multiobjective particle swarm optimization was employed in this work to assist in solving the multiobjective optimization problems during the design of the three core modules of the proposed energy management mechanism. Comparing our proposed work with the latest frameworks discussed in the literature, the simulation results show that our mechanism achieves better performance, not only in terms of relieving the peak load of C&BE stations, but also in lowering the electricity cost. In future work, the number of the mobile CVs can be determined according to the daily traffic flow. In addition, we will consider the energy consumption in relation to velocity of the EVs and road slope in order to account for different kinds of road situations, and the reuse of unused energy remaining in the EV batteries during long stopping periods will be considered as a possible method of enhancing energy management.
Funding
The authors would like to thank the National Science Council of the Republic of China, Taiwan for financially supporting this research under contract numbers 101-2622-E-259-001-CC3 and 102-2511-S-259-010-MY3.
Additional information
Funding
Notes
References
- Alamaniotis, M., A. Ikonomopoulos, and L. H. Tsoukalas. 2012. Evolutionary multiobjective optimization of kernel-based very-short-term load forecasting. IEEE Transactions on Power Systems 27 (3):1477–84. doi:10.1109/TPWRS.2012.2184308.
- Cao, Y., S. Tang, C. Li, P. Zhang, Y. Tan, Z. Zhang, and J. Li. 2012. An optimized EV charging model considering TOU price and SOC curve. IEEE Transactions on Smart Grid 3 (1):388–93. doi:10.1109/TSG.2011.2159630.
- Clement-Nyns, K., E. Haesen, and J. Driesen. 2010. The impact of charging plug-in hybrid electric vehicles on a residential distribution grid. IEEE Transactions on Power Systems 25 (1):371–80. doi:10.1109/TPWRS.2009.2036481.
- Coelho, L. S., H. V. Ayala, and P. Alotto. 2010. “A multiobjective Gaussian particle swarm approach applied to electromagnetic optimization. IEEE Transactions Magnetic 46 (8):3289–92. doi:10.1109/TMAG.2010.2047250.
- Daneshi, H., and A. Daneshi. 2008. Real time load forecast in power system. Paper presented at the Third International Conference on Electric Utility Deregulation and Restructuring and Power Technologies, 689–95, Nanjing, China, April 6–9.
- Del Valle, Y., G. K. Venayagamoorthy, S. Mohagheghi, J.-C. Hernandez, and R. G. Harley. 2008. Particle swarm optimization: Basic concepts, variants and applications in power systems. IEEE Transactions on Evolutionary Computation 12 ( April):171–95. doi:10.1109/TEVC.2007.896686.
- Etezadi-Amoli, M., K. Choma, and J. Stefani. 2010. Rapid-charge electric-vehicle stations. IEEE Transactions on Power Delivery 25 (3):1883–87. doi:10.1109/TPWRD.2010.2047874.
- Guan, C., P. B. Luh, L. D. Michel, Y. Wang, and P. B. Friedland. 2013. Very short-term load forecasting: Wavelet neural networks with data pre-filtering. IEEE Transactions on Power Systems 28 (1): 30–41.
- Ipakchi, A. 2011. Demand side and distributed resource management—A transactive solution. Paper presented at the 2011 IEEE Power and Energy Society General Meeting, Detroit, Michigan, July 24–29.
- Ko, P. C., and P. C. Lin. 2004. A hybrid swarm intelligence based mechanism for earning forecast. In 2nd international conference on information technology for application 193–198. Harbin, China, IEEE.
- Lasseter, R. H. 2011. Smart distribution: Coupled microgrids. Proceedings of the IEEE 99 (6):1074–1082. doi:10.1109/JPROC.2011.2114630.
- Liang, R.-H., and J.-H. Liao. 2007. A fuzzy-optimization approach for generation scheduling with wind and solar energy systems. IEEE Transactions on Power Systems 22 (4):1665–1674. doi:10.1109/TPWRS.2007.907527.
- Liu, H., J. Wu, and L. Chu. 2011. Design of remote monitoring and fault diagnosis system for electric vehicle. 2011 International Conference on Electronic and Mechanical Engineering and Information Technology (EMEIT) 2:1079–1082.
- Markel, T., M. Kuss, and P. Denholm 2009. Communication and control of electric drive vehicles supporting renewables. Paper presented at the IEEE Vehicle Power and Propulsion Conference, 2009. VPPC ‘09. Dearborn, Michigan, September 7–10.
- Masoum, A. S., S. Deilami, P. S. Moses, M. A. S., and A. Abu-Siada. 2011. Smart load management of plug-in electric vehicles in distribution and residential networks with charging stations for peak shaving and loss minimisation considering voltage regulation. IET Generation, Transmission & Distribution 5 (8):877–888. doi:10.1049/iet-gtd.2010.0574.
- Mavromoustakis, C. X., and H. D. Karatza. 2004. Agent-based throughput response in presence of node and/or link failure (on demand) for circuit switched telecommunication networks. Computer Communications 27 (3):230–238. doi:10.1016/j.comcom.2003.08.013.
- Mets, K., T. Verschueren, W. Haerick, C. Develder, and F. De Turck. 2010. Optimizing smart energy control strategies for plug-in hybrid electric vehicle charging. Paper presented at the Network Operations and Management Symposium Workshops (NOMS Wksps), 2010 IEEE/IFIP, Osaka, Japan, April 19–23.
- Ohnsman, A. 2011. AAA Plans Charging Trucks to Aid Stranded Electric-Car Drivers. Retrieved from http://www.bloomberg.com/news/articles/2011-06-21/aaa-plans-electric-vehicle-charger-trucks.
- Pham, M.-T., D. Zhang, and C. S. Koh. 2012. Multi-guider and cross-searching approach in multi-objective particle swarm optimization for electromagnetic problems. IEEE Transactions on Magnetics 48 (2):539–542. doi:10.1109/TMAG.2011.2173559.
- Seow, K. T., N. H. Dang, and D.-H. Lee. 2010. A collaborative multiagent taxi-dispatch system. IEEE Transactions on Automation Science and Engineering 7 (3):607–616. doi:10.1109/TASE.2009.2028577.
- Shyu, S. J., B. M. T. Lin, and T. S. Hsiao. 2004. An ant algorithm for cell assignment in PCS networks. IEEE International Conference on Sensing and Control Networking 2:1081–1086.
- Zhan, F. B., and C. E. Noon. 1998. Shortest path algorithms: An evaluation using real road networks. Transportation Science 32 (1):65–73. doi:10.1287/trsc.32.1.65.
- Zhang, P., K. Qian, C. Zhou, B. G. Stewart, and D. M. Hepburn. 2012. A methodology for optimization of power systems demand due to electric vehicle charging load. IEEE Transactions on Power Systems 27 (3):1628–1636.
Appendix A: Multiobject particle swarm optimization
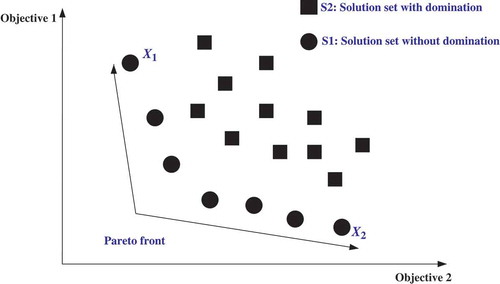
Particle swarm optimization (PSO) (Del Valle et al. Citation2008) is a computational intelligence approach for solving optimization problems based on the behavior of swarming or flocking animals such as birds or fishes. The difference between single and multiobjective optimizations using particle swarm optimization involves how the “guider,” (a term which refers to a particle having the global best position that is used to locate the global optimal and Pareto optimal solutions), is defined in corresponding optimization problems. As shown in , X1 has achieved a minimum for the first object function, and X2 has achieved a minimum for the second object function. Therefore, we refer to these solutions, X1 and X2, as “extreme solutions.” For a nontrivial multiobjective optimization problem, a single solution that simultaneously optimizes each objective will not exist. Each member of a Pareto set is possibly the optimal solution to the problem, as shown in . All the best nondominated solutions are stored in the external archive. Only crowding distance in objective space is considered, in order to reduce the nondominated solution for more diversity in the external archive. In traditional multiobjective particle swarm optimization, only one guider is selected. Two guiders instead of just one guider are used in the MOPSO (Pham, Zhang, and Koh Citation2012), and the influence of the second guider is controlled by introducing the cross-searching factor to provide a good distribution of the solutions over the entire Pareto front with regard to all objectives. In this work, we applied the MOPSO model that involves selecting multiple guiders to lead a swarm toward a Pareto front, as presented by Pham, Zhang, and Koh (Citation2012) and based on the G-MOPSO (Coelho, Ayala, and Alotto Citation2010). Notably, a mutation operator is applied for not only particles, but also for members in an external archive, in order to overcome the local Pareto front. Meanwhile, aside from considering the crowding distance of solutions in objective space to maintain the diversity of solutions, the crowding distance in variable space is also addressed in this approach.
Figure 10. Diagram of a Pareto set.
In order to maintain the diversity of the solutions, two crowding distances are taken into account in the removal process of the nondominated solutions. The algorithm used in this work functions as follows.
Step 1: Initialize a swarm of particles.
Generate N particles with random velocities and positions, and set the iteration counter to t = 0.
Evaluate all objective function and constraint values, and find nondominated solutions and store them into the external archive A.
Calculate the crowding distance in objective space (objective crowding distance) for all members in A.
Step 2: Update the personal best position of the particles.
For every particle, calculate the fitness value at the current position, and compare it with the previous personal best position. If the fitness value of the current position is better than the best fitness value in history, set current value as the new personal best position.
Step 3: Update the guiders.
Randomly select the first guider
from the top 10% of solutions in the external archive with the objective crowding distance of A.
The second guider
Step 4: Update the velocity and position of the particles.
For every particle, velocity and position are updated as in (26) and (27), respectively.
where denotes the best previous position of the ith particle, ud is a uniform random number in the range of [0, 1],
is a Gaussian-distributed random number,
is an extreme factor that has a value of zero if the first guider
is an extreme solution and one otherwise,
is the cross-searching factor that controls the influence of the second guider, and xi(t-1) represents the position of the particle at the time step t-1. In general, at the beginning of the searching process, only the first guider is used to drive the particles to extreme solutions. As the iteration increases, two guiders are preferred in order to find more nondominated solutions nearby the two guiders. The factor is, therefore, controlled as
where c is cross-searching rate set to 0.3 by experience.
Step 5: Mutate the position of the particles.
A mutation operator is adopted to prevent a premature convergence to a local Pareto front.
Randomly select
where is, in this study, set to 0.5, and the function round (
) takes the nearest integer as its argument.
Randomly mutate a random component,
particle in the following range:
[max(, k,
), min(
, k,
)]
(30)
The mutation operator is restricted to randomly selected N nondominated solutions at each iteration.
Evaluate all objective function and constraint values for all particles or members in the external archive.
Step 6: Update nondominated solutions.
External archive A absorbs superior current nondominated solutions and eliminates inferior ones using constrained domination.
Reduce the number of solutions in A, if there are more members than predetermined, by repeating the following:
Calculate the objective crowding distance for all members in A and select the lowest 10% of solutions.
(ii) For each selected RS solution xi, calculate the othervariable xj crowding distance as follows:
Calculate the threshold distance as follows:
Remove the nondominated solutions that have a smaller variable crowding distance than the threshold distance.
Step 7: Termination check.
Increase the iteration counter, and if t reaches , or the spacing metric defined in Equation (33) is kept unchanged for 50 consecutive iterations, the algorithm is terminated.
where is the number of members in A. Otherwise, go to Step 2.