
ABSTRACT
Smart Grid (SG) incorporates various data communication networks to cover the complicated power systems in an intelligent and efficient way. This network utilizes the mutual flows of the data and electricity to facilitate the relations among the network components. One of the most attractive areas in the SG is the routing optimization, by which the data transmission is accompanied by Quality of Service (QoS) assurance. In this article, we tune the suggested parameters of the genetic-algorithm-inspired QoS-aware routing protocol, namely Genetic Algorithm Stable Optimization Multiconstrained Routing (GASOMCR) protocol. The QoS requirements are extracted to monitor the degree of user satisfaction of the services as well as ensure the QoS existence in the routing approach. Different sets of parameters, i.e., packet loss, path loss, effective throughput, network criticality, network availability, packet transmission delay, and connection outage probability are used to assess the QoS of the SG. These parameters are analyzed and the behavior of the network cost function is determined for each of these parameters. Appropriate parameterization of the proposed GA is very effective in the performance convergence of the network. The results obtained by GASOMCR protocol show that the performance improvement, which is obtained from minimizing the network cost function as well as having the trade-off among the various proposed parameters, is obviously achieved.
Introduction
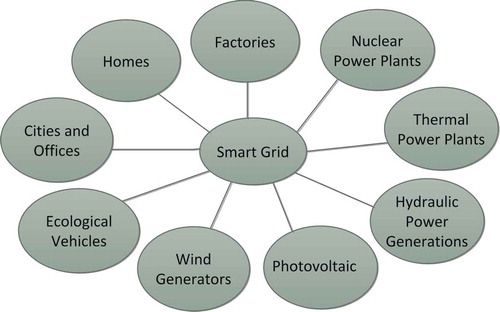
Today’s electric power systems are based on the fossil fuels that are consumed quickly and used for several decades (Wang, Xu, and Khanna Citation2011). Due to both economic and environmental challenges, replacement and change are necessary in these systems (Gao et al. Citation2012), which need a distribution control center that is decentralized, collected, flexible, and open (Wu, Moslehi, and Bose Citation2005). These modernized power systems have been named Smart Grids (SG) (Temel, Gungor, and Koçak Citation2014). The word “Grid” implies an electricity system that comprises four functions of electricity: generation, transmission, distribution, and control (Fang et al. Citation2012). Because of the heavy amount of gathered information in the SG, traditional processing tools might not be efficientfor the network delays (Ancillotti, Bruno, and Conti Citation2013). Hence, the SG utilizes the mutual flows of the data and electricity, which is a very effective approach in communication relations in this network (Ferrari et al. Citation2014). Reliable and real-time exchanges of information are an important factor for reliable delivery of power from production to end-users (Gungor et al. Citation2011). The network perspective of the SG is shown in .
Figure 1. The network perspective of an SG, which shows different components that are used in SG.
Because different network applications necessitate different Quality of Service (QoS) requirements that might not be achieved by QoS-unaware routing, the QoS routing protocols have received more attention in recent years (Masip Bruin et al. Citation2006). Various QoS metrics can be studied in the QoS assessment of SG. Li and Zhang (Citation2010) utilized the delay metric to analyze the QoS routing in the SG. Taft and Ahmed introduced four directions to determine the QoS requirements in the SG: move from concentrated to point-to-point control, move from concentrated generation to distributed energy resources, move from few end points with low intelligence to numerous end points with high intelligence, and move from low data capacities to high data capacities (in Jeon Citation2011). Al-Anbagi et al. have studied an adaptive QoS design for wireless sensor networks (WSNs) that supplies discrimination of the services by decreasing the crucial data delay of the various applications in the SG (Al-Anbagi, Erol-Kantarci, and Mouftah Citation2013). Saputro et al. believed that for supporting the QoS in the SG, all QoS requirements for various applications should be applied (Saputro, Akkaya, and Uludag Citation2012). Zaballos et al. have designed a routing protocol for SG, namely GATAS, which is a combination of the genetic algorithm (GA) and ticket-based routing (TBR). The network efficiency is improved by decreasing the routing packets’ overhead as well as minimizing the communication delay of the network (Zaballos, Vernet, and Selga Citation2013). Jahromi and Radhave proposed an optimization model (PC/ISO) and used the GA to solve this model (Eshraghniaye Jahromi and Besharati Rad Citation2013).
Although some of the studies on the routing in the SG provide solid and valuable foundations in the SG communications, none of them focuses on the employment of the routing protocol that consider the routing, energy consumption, and network QoS simultaneously. In other words, these requirements have not been used in one cost function along with trying to both minimize the network cost and maximize the stability in the network. Considering the network parameters such as packet loss, path loss, criticality, effective throughput, and the others, it is necessary to evaluate the network behavior. Although, in some of the studies, only one of these requirements is studied (Jeon Citation2011; Yi, Iwayemi, and Zhou Citation2011; Qiumin, Niyato, and Wang Citation2012); but in none of them, have all the requirements been gathered and studied. In this work, we tune the suggested parameters of the QoS-aware routing protocol and collect them, as the QoS requirements, in one cost function and minimize the network cost. The proposed cost function of the protocol considers many aspects and conditions that the network could experience. We used a novelty of the GA in routing optimization, which has been redounded to a considerable result in the SG. Appropriate parameterization of the GA is very effective for convergence speed of the cost function.
The rest of this article is organized as follows. In “Problem Formulation,” we present the problem formulation that includes the system model and QoS parameters. Following that, we suggest some parameters that show the QoS requirements in the network. “Optimizing the Network Performance Using GA” describe details of the GA used to optimize the routing protocol. In “Experimental Results,” we report the experimental results of the proposed protocol. We end the work with “Conclusions and Future Work.”
Problem formulation
In this section, the system model, used for SG, is elaborated. Also, we suggest some parameters to monitor the QoS requirements in the SG. Details of the proposed model and QoS parameters are described following.
System model
The modern Grid cannot exist without an effective integrated communications infrastructure, which collects many devices in the SG. To save energy, decrease costs, and increase transparency and reliability, SG delivers electricity from suppliers to consumers using mutual digital communications. Many SG solutions, such as distribution automation, outage alarming, and load-control signaling, concluding with a very low latency, should be envisioned. It should be noted that, the SG needs to support end-to-end and device-to-device latencies in units of milliseconds and seconds (Kuzlu, Pipattanasomporn, and Rahman Citation2014).
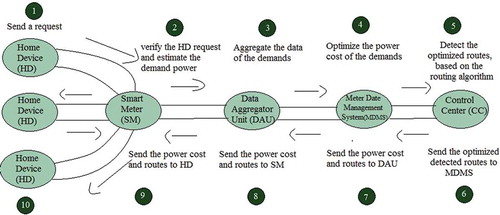
In the proposed model, it is assumed that smart meters are installed into each house. When the user sends a QoS requirement to the smart meter, the packets containing the estimated power consumption are transmitted to the Data Aggregator Unit (DAU). The DAU forwards this measured data to the Meter Data Management System (MDMS). The MDMS optimizes the power cost of the received demands and sends this measured data to the Control Center (CC). Then, the CC, based on the routing algorithm, puts one or more routes to the Home Device (HD) through three intermediate nodes. The optimized routing protocol, enhanced with these requirements, is called a Genetic-Algorithm Stable Optimization Multi-Constrained Routing (GASOMCR). The proposed model is shown in .
Figure 2. The proposed model of SG, which includes Home Device (HD), Smart Meter (SM), Data Aggregator Unit (DAU), Meter Data Management System (MDMS), and Control Center (CC).
QoS parameters
Seven parameters are suggested and tuned to be the QoS requirements of the routing protocol for the SG, by which the network cost function is minimized. In the following, the effectiveness of these suggested parameters in the network cost and routing protocol optimization are shown. The seven proposed parameters are listed as the following:
Packet loss,
, which is the percentage of the total number of the transmitted packets that is lost in the network.
Path loss,
Effective throughput,
Network criticality,
Network availability,
Packet transmission delay,
Connection outage probability,
QoS requirements in the proposed model
Details of the seven suggested parameters discussed in the previous section are investigated in the following subsections.
Packet loss impact
Packets are, basically, the units of the information transmission in all the modern computer networks, and increasingly in SGs as well. Queuing theory is used for buffer simulation in each node of the network. The M/M/1/N queue is used for this goal in which the value of N is given. When a router or other network device is overloaded and cannot accept additional packets at a given time, a packet maybe discarded and the packet loss is incurred. The losses occur commonly due to the congestion on the network as well as buffer overflows on the end-systems. Therefore, we need to check the packet loss probability in each node of the network, which is given by
where is the probability of the packet loss,
is the rate that a packet is entered to a node,
is the rate that a packet is exited from a node,
is the capacity of the queue in each node of the network.
Path loss
Path loss is the most variable quantity in the link budget, and it depends on the different factors such as antenna height, frequency, and link distance. Commonly, a statistical path loss model or prediction program is applied to estimate the median propagation loss in dB. The basic formula for Hata path loss is accepted in this work, given by (Debus Citation2006; Ekka Citation2012):
where is the Hata path loss,
is the frequency,
is the antenna height,
is the link distance.
Effective throughput
In data transmission, throughput is the amount of data forwarded successfully from a link in a given time period. Because each link is terminated at a network device such as a router or gateway, the processing is performed within the device to determine how to forward the packet with a minimum number of hops. To show the multihop nature of the traffic in the network, the effective throughput, which is the scaled throughput by the average hop count, is considered. The throughput on link is defined as (Zhao et al. Citation2011):
where is the transmission rate of the link,
is the collision probability of the link
,
is the normalized channel airtime allocated to link
that could be used by a new flow (which includes the successful and collided transmission time). The end-to-end throughput capacity on the given route is shown by the bottleneck link:
The effective throughput is computed by:
where is the hop count between source and destination nodes in the network.
Network criticality
Network criticality is a graph-theoretic metric to monitor the effect of the environmental changes such as traffic variation and topology changes in the networks. Network criticality is defined as the average random-walk betweenness of a link (node) normalized by its weight. This quantity is independent of link (node) location and is a decreasing and strictly convex function of link weights. Network criticality is defined as (Movahhedinia, Tizghadam, and Leon-Garcia Citation2010):
where ,
,
, and
denote the set of links, the number of links, the betweenness of link
, and the weight of link
, respectively. Equation (8) states that minimization of network criticality results in minimizing the average sensitivity of link betweennesses with respect to the changes in link weights (which in turn capture environmental changes). The definition of betweenness is as follows (Newman Citation2005):
where is the current flow transmitted through the ith vertex and is given by
and is an element of the adjacency matrix; thus,
is the voltage at vertex
in the network,
is the number of the edges in the network.
Network availability
The availability of the component in the network can be calculated using the following formula (N-TRON Corp, Citation2012):
where is the mean time between failure (MTBF) and
is the mean time to repair (MTTR).
Packet transmission delay
The packet transmission delay includes two types of delays, which are defined as:
where is the queuing delay in the considered queue in each node, defined as
where is the average number of packets in the queue and is given by
is the probability that there are
packets in the queue of each node in the network, which is given by
is the size of the queue and
is the effective arrival rate, which is calculated by
And is the transmission delay defined by
where is the packet length and
is the link bandwidth. Note that two types of delays, including nodal processing and propagation delays, are ignored in calculating the packet transmission delay parameter, due to their very small values.
Connection outage probability
When the signal to interference plus noise ratio (SINR) is less than a certain threshold, there is significant performance degradation of a wireless link, which results in outage equal to the aggregate interference power
exceeding the threshold
.The desired signal power is
;
is the interference signal power coming from the ith node;
is the noise power. So, the outage probability is (Coon, Wang, and Huang Citation2012; Wen, Loyka, and Yongacoglu Citation2012):
The interference plus noise ratio (INR) is defined as
where is the number of the nodes in the network. The threshold value is
, so that the outage probability is:
Overall network cost function
The overall network cost is the cost of the power consumption in the network, which is measured in $/MWh. The network cost, for each parameter, is the cost of the power that has been consumed in the network at the time of the network performance evaluation. The overall network cost function is defined such that the network costs of all the suggested parameters are considered. Hence, some functions are defined to show the costs that are caused by each parameter. Details of these functions are as follows.
Parameters graph
The relation of the suggested parameters are illustrated by a graph called a parameters graph, which is shown in . One can see that in the parameters graph, three parameters, ,
,
might lead to the
occurrence in two cases, as follows:
First case: In this case, occurrence is due to
occurrence. An
incidence might be caused by parameters
and
, or caused by the factors that are not included in the suggested parameters displayed by symbol
. The cost of these factors is shown by
.
Second case: Here, occurrence is the result of the other factors that are not considered among the suggested parameters. These factors and their cost functions have been shown with symbols
and
.
Loss functions for parameters
In a situation that the network is ready for evaluation, each of the proposed parameters has a loss for the network, which is proportional to the values of the parameters. We define the loss caused by each parameter as follows:
where is a utility function, which is used to show the network cost behavior of each unit of the suggested parameters during the time interval of the network evaluation;
is the time that is spent from the start time of the network evaluation. Although parameters
and
have a direct effect on the network cost in the Equations 28, 30, the inverse of parameters
,
,
,
,
,
, and
is proportional to the network cost in Equations 24–27 and Equation 29. In other words, having a high number of parameters
,
and a low number of parameters
,
,
,
,
,
,
is expensive to the network. Because the
is dependent on the time the behavioral changes of the network cost as a result of the proposed parameters being available in real time, any changes in the network, at any time, are visible.
The overall network cost function definition
The overall network cost function is defined such that the effects of the suggested parameters, as well as the loss caused by them, are applied to it. According to the parameters graph, the network cost is studied in two cases:
First case: the mode that occurs in the network. In this case, the network cost is defined by:
where is the loss caused by
, due to parameters
,
, and
occurrence;
is the loss caused by
, due to parameter
occurrence.
Second case: the state that does not occur in the network. In this case, the network cost is the sum of the costs of all the parameters considered in the network, which is calculated as follows:
According to the description provided, the overall network cost function is defined as follows:
where is the
occurrence probability, and
is the
nonoccurrence probability in the network, which are calculated by:
According to the defined overall network cost function, the optimal values of the proposed parameters are computed by
where ,
,
,
,
,
,
are the considered taxes for parameters
,
,
,
,
,
,
, which are defined as the functions that depend on these parameters and can be chosen arbitrarily.
Optimizing the network performance using GA
GASOMCR is a QoS-aware routing protocol that, by using GA, optimizes the performance of a SG. The following subsections discuss the proposed solution.
Chromosome coding
Sequences of positive integers that represent the identifications (IDs) of nodes through which a route path passes are used to encode the GA chromosome. In this situation, each chromosome is an existing path between the source node and the destination node. There are as many genes as intermediate nodes in the complete path. Therefore, the size of the chromosome depends on the number of intermediate nodes.
Fitness function
Minimizing the fitness function has concluded from the trade-off among the five parameters. In the point that this function is minimized, trade-off among these parameters is maximized and the best fitness value is achieved. This function is computed by Equation 33.
Stopping condition of the algorithm
The end-condition is used for deciding when to stop the search for a better solution. Application of the GA is run either for a fixed number of iterations or until the search has not been able to find better solutions for a number of iterations, typically. Several end-conditions have been used in the parameterization of the GA algorithm. Finding the best feasible successor or several conforming paths from the source node to the destination node, which satisfies a set of constraints, is pursued in the QoS-aware routing problem. This is a suitable end-condition for real operation, because a QoS-aware routing protocol must search for routes that satisfy the QoS requirements.
Initial population
While a chromosome provides a possible routing solution, the population is formed by individuals representing all the evaluated paths. The initial population should be equipped with a sufficient variety of individuals, so that the genetic algorithm can lead the population toward better individuals. Instead of a random generation, GASOMCR protocol relies on the underlying QoS routing protocol to obtain suitable paths for the initial population and to avoid a mismatch between actual topology and new individuals.
Mutation operator (Pm)
The value of Pm is very effective in convergence of the fitness function and is applied gene by gene. The Gaussian mutation can be effective in the proposed protocol.
Crossover operator (Pc)
With the aim of creating better solutions, the crossover operator is responsible for the identification and reassembly of subsolutions. The crossover operator starts with the individuals of the initial population, and then selects the individuals with the crossover probability. The value of is very important and effective in convergence of the fitness function.
GA Parameterization of GASOMCR
The initial population size, necessary for its correct operation, is considered. The roulette wheel selection method with an appropriate crossover and mutation probability is used. Elitism is applied by copying the best individual to the next generation in the GA iterations.
Experimental results
The optimal requirements of the suggested parameters are plotted in the figure of the network cost behavior versus suggested parameters. The suggested parameters refer to one of the seven parameters that are packet loss, path loss, effective throughput, network criticality, network availability, packet transmission delay, and connection outage probability. In the plots of the network cost behavior versus suggested parameters, we have five points: start point, end point, and three other points at which the slope of the curve has been changed, respectively. These are called first, second, and third break points. So, we have three break points in all of the plots of the network cost behavior versus suggested parameters, which have critical roles in the behavior of the network cost. The pieces of the curve between each two sequent points are called, respectively, first, second, third, and fourth modes. In the first mode, the network behavior is approximately fixed and the parameters of the network are initialized so that the network is ready to be evaluated. In the second mode, the network cost is increased monotonically. The third mode is an important mode because it shows the efficiency of the routing mechanism along with all the parameters that are proposed for the network. Optimizing the network cost is an essential goal that is achieved in this mode. Whenever the network cost is minimized, the optimization problem that is the trade-off among all the parameters is achieved in the network; therefore, the network performance is improved considerably. The network cost is decreased monotonically in the third mode. The behavior and cost of the network are approximately fixed in the fourth mode. Moreover, the stability in the network behavior is achieved.
In the performance evaluation of the proposed model of SG, the following metrics are considered:
Packet transmission delay,
Connection outage probability,
Path loss,
Packet loss,
Effective throughput,
Network criticality,
Network availability, and
Overall network cost, which collects the effects of all the proposed parameters in the network. By using this metric, it is possible to achieve a trade-off point for the network performance.
Note that the achieved results in the following figures are based on the five relations between locational margin price (LMP) and load, from (PJM, Citation2009). shows these relations. The values of the parameters are scaled in the following figures, for simplicity.
Table 1. Relation between LMP ($/MWh) and load (MW) (PJM, Citation2009).
Selection of these functions is arbitrary and each suitable function can be substituted. These functions and optimal requirements of the parameters are shown in and .
Table 2. Details of the fitness function in the GASOMCR protocol.
Table 3. The optimal requirements of the proposed parameters and cost function in the network.
In our experimental results, the considered functions for network cost are defined as follows:
Parameters and network cost discussions
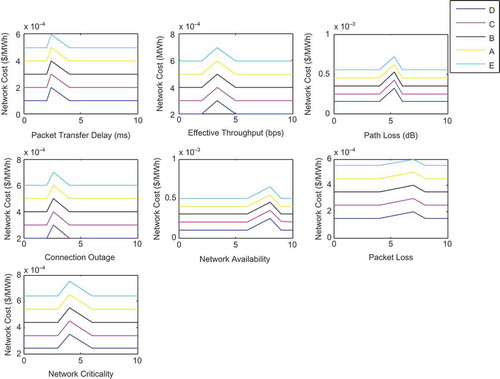
shows the curves of the network cost versus different values of ,
,
,
,
,
, and
. According to these figures, the network cost is changed in four modes. In the fourth mode, the network cost behavior reaches to the stable behavior, and the network cost is maximized in this mode. We can see in that the minimal cost is not obtained by the minimal delay. In this figure, the curve of E has the lowest cost sensitivity to the communication delay parameter. The order of the cost sensitivity to these parameters, in these figures, is D, C, B, A, E.
Figure 3. Parameters graph that shows the dependency among the parameters in the network.
Figure 4. The network cost versus different values of the ,
,
,
,
,
, and
.
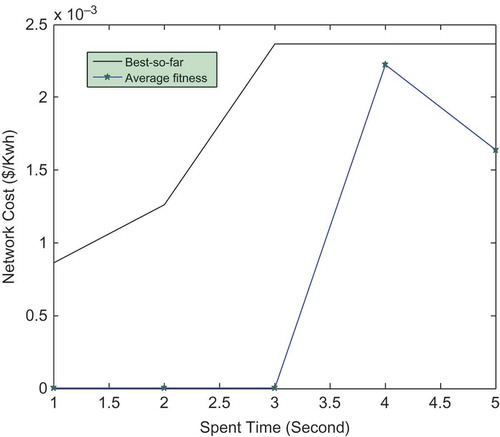
The network cost versus the time interval, which is the interval between the starting time of the evaluation and the quantitative time that is spent from the start time, is shown in . As this figure indicates, the network cost has an approximately fixed value at the beginning time of the evaluation. From the first break point, the network cost is increased up to the second break point. Decreasing changes in the network cost start from the second break point, which is an acceptable behavior for the network.
Figure 5. The network cost behavior in the time interval from the beginning time of the evaluation.
Comparison with other protocols
The proposed protocol, namely GASOMCR, is compared to OMCR (Li and Zhang Citation2010), GATAS (Zaballos, Vernet, and Selga Citation2013), and fully polynomial time approximation schemes (FPTAS) protocols (Xue et al. Citation2008); the latter one is the best estimate result of the OMCR problem (Li and Zhang Citation2010). To compare the routing performance, the number of the best found paths of these protocols, energy consumption, and delay of the best path of the protocols are compared. Details of these comparisons follow in the next subsection.
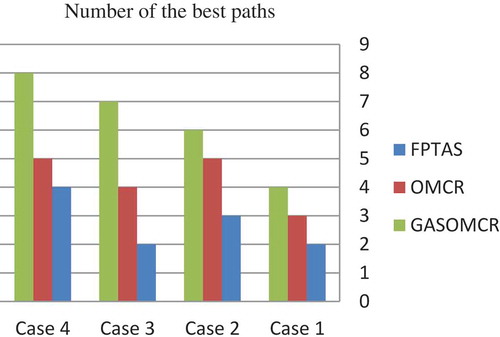
Number of the best paths comparison
shows the qualitative comparison of the performance of GASOMCR, OMCR, and FPTAS, based on the number of the best paths. A randomly generated network topology is used to represent the SG, and 500 source-destination pairs are generated in every test case. Results that are achieved from four test cases of the routing in the network are shown in this figure. This figure indicates that the number of the best paths in GASOMCR is more than are found in the other protocols.
Figure 6. Qualitative comparison of the performance of GASOMCR, OMCR, and FPTAS protocols using path length.
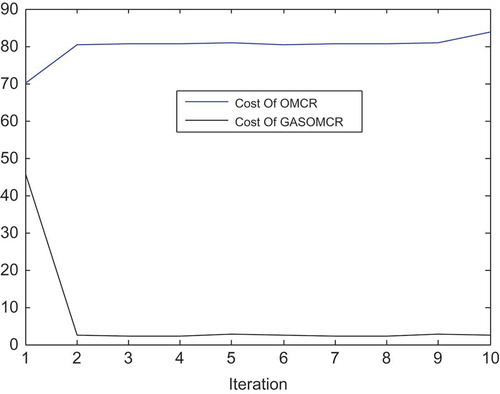
Energy consumption comparison
shows the comparison between the cost of GASOMCR and OMCR protocols. Comparison is based on the energy consumption of these protocols. One can see that the cost of the OMCR protocol is increased monotonically in the first mode, whereas the cost of the GASOMCR protocol is decreased monotonically. In the second mode, both costs are nearly fixed. As indicates, the GASOMCR protocol has only two modes; but the OMCR protocol experiences the third mode with a smoothly incremental behavior. Comparison of the cost of these two protocols shows that the effectiveness of the GASOMCR protocol is higher than that of the OMCR one. The network behavior, under GASOMCR protocol, is suitable and acceptable because of the decreasing changes in the network cost as well as the reaching to achieve the stable behavior. Here, we can conclude that the network performance is improved with the GASOMCR protocol.
Figure 7. Comparing the cost of the energy consumption of GASOMCR and OMCR.
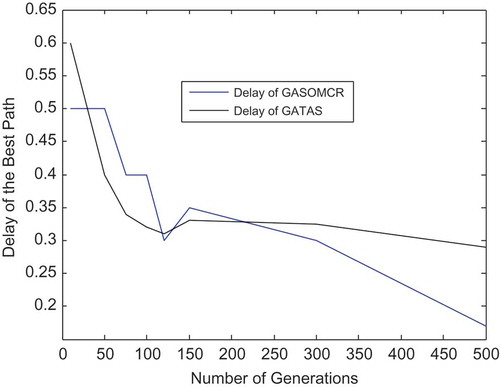
Delay comparison
shows the delay comparisons of the best selected paths obtained by GASOMCR and GATAS protocols; the latter one is a genetic QoS-aware routing protocol for the smart electricity networks. To compare these two protocols, for each ticket used in the GATAS protocol, we consider one individual in the population of the GA in the GASOMCR protocol. The overall behavior of these two protocols is similar; however, but in generations lower than 50, the curve of the GASOMCR protocol is approximately fixed. In addition, at the end of the curve, in generations of more than 300, the negative slope of the GASOMCR protocol is more than that of the GATAS protocol. Comparison of these two protocols shows that the capability of GASOMCR in finding the best path with lowest routing delay is higher than that of the GATAS protocol. Consequently, the network performance and routing delay are improved with GASOMCR as well as GATAS, but improvement achieved with GASOMCR protocol is higher than the GATAS one.
Figure 8. Comparison of the routing delay for finding the best selected path obtained by GASOMCR and GATAS protocols.
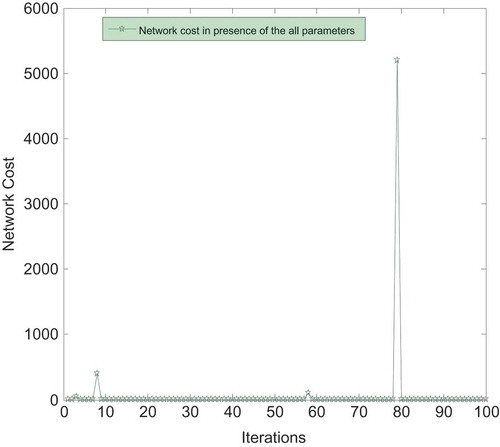
Necessities of the parameters
Optimization of the network cost has concluded from the trade-off among all the proposed parameters. Presence of each of these suggested parameters is very effective in the cost function convergence. These parameters facilitate the network behavior to reach the stable behavior. – show the network costs in the absence of each of these parameters. In these figures, the oscillations are obviously observable, which represents that the network behavior does not reache to the stable and balanced behaviors. In contrast, when all of these parameters are considered in the cost function, shown in , the network behavior reaches to the stable behavior after the maximum point.
Figure 9. Network cost in absence of the packet loss parameter.
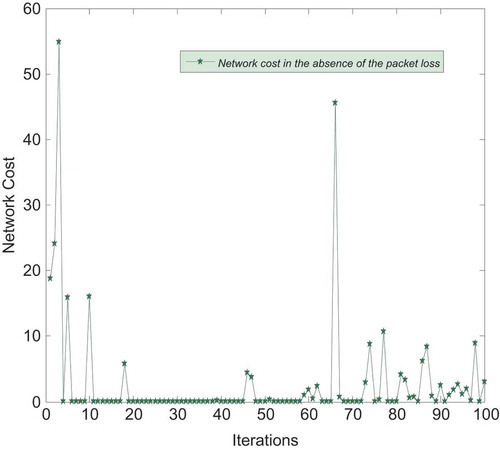
Figure 10. Network cost in absence of the path loss parameter.
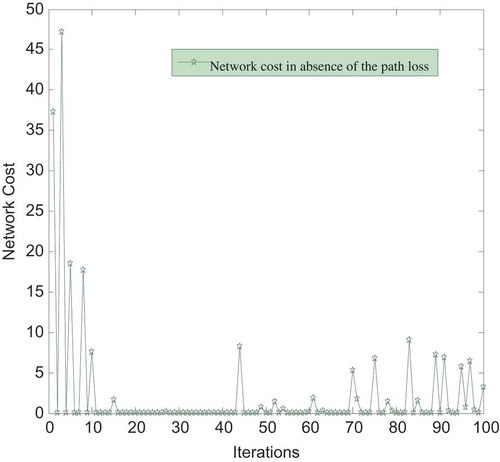
Figure 11. Network cost in absence of the effective throughput parameter.
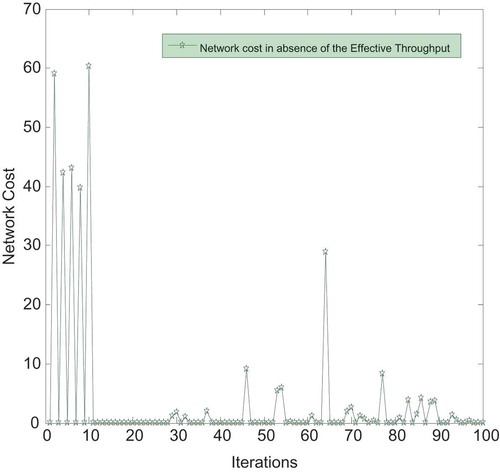
Figure 12. Network cost in absence of the network criticality parameter.
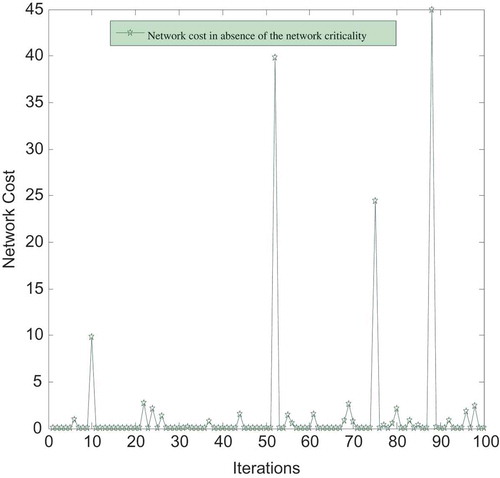
Figure 13. Network cost in absence of the network availability parameter.
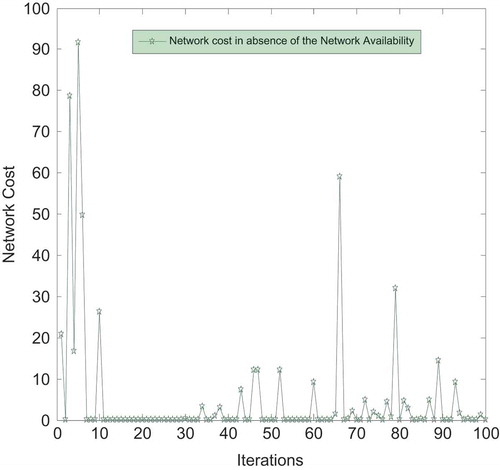
Figure 14. Network cost in absence of the packet transmission delay parameter.
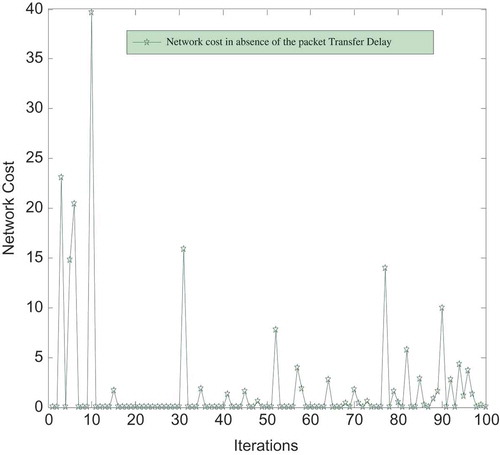
Figure 15. Network cost in absence of the connection outage parameter.
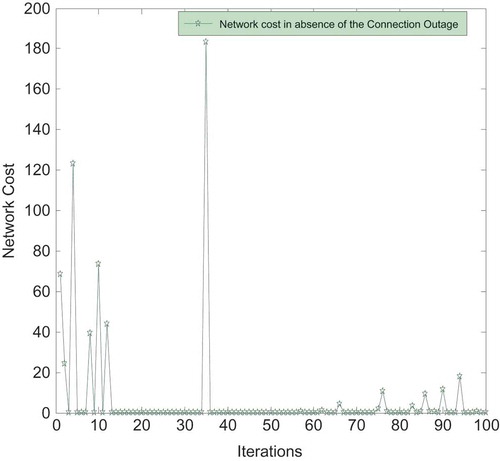
Figure 16. Network cost in presence of all parameters.
Conclusion and future works
SG gathers various communication networks to provide an intelligent and automated network, which utilizes the mutual flows of the electricity and the information among the network components. The study of the routing protocol concerning QoS assurance shows that the proposed routing protocol, GASOMCR, improves many aspects of a communication network. The main advantage of this protocol is improvement of the network performance by minimizing the cost of the energy consumption and routing algorithm. To evaluate the network performance, some parameters are considered, which the minimizing of the cost function has concluded from the trade-off among these parameters, which are packet transmission delay, connection outage probability, path loss, packet loss, effective throughput, network criticality, and network availability. GASOMCR protocol, collects the effect of the energy consumption problem as well as the routing problem in a single cost function, in which the network performance is improved by comparison with other protocols in this case. Five relations between LMP and load are considered for simulation. Study of the GASOMCR protocol will continue in future works, so that the routing mechanism of the GASOMCR can be more optimized and the level of the network cost can be more decreased. However, having the seven parameters in routing protocol is costly for a network; but the network behavior is adequately suitable with the cost function of these parameters.

References
- Al-Anbagi, I., M. Erol-Kantarci, and H. Mouftah. 2013. An adaptive QoS scheme for WSN-based smart grid monitoring. In IEEE international conference on communications 2013: IEEE ICC’13 - 3rd IEEE international workshop on smart communication protocols and algorithms (SCPA 2013) 1046–1051. IEEE. doi:10.1109/ICCW.2013.6649391.
- Ancillotti, E., R. Bruno, and M. Conti. 2013. The role of communication systems in smart grids: Architectures, technical solutions and research challenges. Computer Communications 36:1665–1697. doi:10.1016/j.comcom.2013.09.004.
- Coon, J., Y. Wang, and G. Huang. 2012. Asymptotic outage probability analysis for general fixed-gain amplify-and-forward multi-hop relay systems. Computer Science, Information Theory 1–29. http://arxiv.org/abs/1206.3029
- Debus, W. 2006. RF path loss & transmission distance calculations. Technical Memorandum 2006:1–13.
- Ekka, A. 2012. Path loss determination using Okumura-Hata model for Rourkela. BTech thesis. National Institute of Technology Rourkela.
- Eshraghniaye Jahromi, A., and Z. Besharati Rad. 2013. Optimal topological design of power communication networks using genetic algorithm. Sciatica Iranian E 20 (3):945–957.
- Fang, X., S. Misra, G. Xue, and D. Yang. 2012. Smart grid — The new and improved power grid: A Ssurvey. IEEE Communications Surveys & Tutorials 14 (4):944–980. doi:10.1109/SURV.2011.101911.00087.
- Ferrari, P., E. Sisinni, A. Flammini, and A. Depari. 2014. Adding accurate timestamping capability to wireless networks for smart grids. Computer Networks 67:1–13. doi:10.1016/j.comnet.2014.03.005.
- Gao, J., Y. Xiao, J. Liu, W. Liang, and C. L. Chen. 2012. A survey of communication/networking in smart grids. Future Generation Computer Systems 28:391–404. doi:10.1016/j.future.2011.04.014.
- Gungor, V. C., D. Sahin, T. Kocak, S. Ergüt, C. Buccella, C. Cecati, and G. P. Hancke. 2011. Smart grid technologies: Communication technologies and standards. IEEE Transactions on Industrial Informatics, 7 (4):529–539. doi:10.1109/TII.2011.2166794.
- Jeon, Y. 2011. QoS requirements for the smart grid communications system. International Journal of Computer Science and Network Security 3 (11):86–94.
- Kuzlu, M., M. Pipattanasomporn, and S. Rahman. 2014. Communication network requirements for major smart grid applications in HAN, NAN and WAN. Computer Networks 67:74–88. doi:10.1016/j.comnet.2014.03.029.
- Li, H., and W. Zhang. 2010. QoS routing in smart grid. IEEE Globecom 2010 Proceeding 2010:1–6. doi:10.1109/GLOCOM.2010.5683884.
- Masip Bruin, X., M. Yannuzzi, J. Domingo Pascual, A. Fonte, M. Curado, E. Monteiro, F. Kuipers, et al. 2006. Research challenges in QoS routing. Computer Communications 29 (5):563–581. doi:10.1016/j.comcom.2005.06.008.
- Movahhedinia, N., A. Tizghadam, and A. Leon-Garcia. 2010. A robust power control method for cognitive radio networks. GLOBECOM Workshops (GC Wkshps.) 773–777. doi:10.1109/GLOCOMW.2010.5700428.
- Newman, M. E. J. 2005. A measure of betweenness centrality based on random walks. Social Networks 27:39–54. doi:10.1016/j.socnet.2004.11.009.
- N-TRON Corp. 2012. Network Availability Industrial Network Company. 1–3. York, PA.
- PJM. 2009. PJM training materials (LMP101). [Online]. http://www.pjm.com/services/training/train-materials.html.
- Qiumin, D., D. Niyato, and P. Wang. 2012. Dynamic spectrum access for meter data transmission in smart grid: Analysis of packet loss. Wireless Communications and Networking Conference (WCNC) 1817–1822. doi:10.1109/WCNC.2012.6214080.
- Saputro, N., K. Akkaya, and S. Uludag. 2012. A survey of routing protocols for smart grid communications. Computer Networks 56:2742–2771. doi:10.1016/j.comnet.2012.03.027.
- Temel, S., V. Gungor, and T. Koçak. 2014. Routing protocol design guidelines for smart grid environments. Computer Networks 60:160–170. doi:10.1016/j.bjp.2013.11.009.
- Wang, W., Y. Xu, and M. Khanna. 2011. A survey on the communication architectures in smart grid. Computer Networks 55:3604–3629. doi:10.1016/j.comnet.2011.07.010.
- Wen, Y., S. Loyka, and A. Yongacoglu. 2012. Asymptotic analysis of outage probability in cognitive radio networks. In IEEE International Conference Communications (ICC), 2012, 6426–6431. IEEE. doi:10.1109/ICC.2012.6364048.
- Wu, F., K. Moslehi, and A. Bose. 2005. Power system control centers: Past, present, and future. Proceedings of the IEEE 93 (11):1890–908. doi:10.1109/JPROC.2005.857499.
- Xue, G., W. Zhang, J. Tang, and K. Thulasiraman. 2008. Polynomial time approximation algorithms for multi constrained QoS routing. IEEE/ACM Transactions on Networking 16 (3):656–669.
- Yi, P., A. Iwayemi, and C. Zhou. 2011. Developing zigbee deployment guideline under wi-fi interference for smart grid applications. IEEE Transactions on Smart Grid 2 (1):110–120. doi:10.1109/TSG.2010.2091655.
- Zaballos, A., D. Vernet, and J. M. Selga. 2013. A genetic QoS-aware routing protocol for the smart electricity networks. International Journal of Distributed Sensor Networks 2013:1–12. doi:10.1155/2013/135056.
- Zhao, H., E. Garcia-Palacios, A. Song, and J. Wei. 2011. Calculating end-to-end throughput capacity in wireless networks with consideration of hidden nodes and multi-rate terminals. IEEE 73rd Vehicular Technology Conference (VTC Spring), 2011 1–5. doi:10.1109/VETECS.2011.5956285.