
ABSTRACT
The web resources in the World Wide Web are rising, to large extent due to the services and applications provided by it. Because web traffic is large, gaining access to these resources incurs user-perceived latency. Although the latency can never be avoided, it can be minimized to a larger extent. Web prefetching is identified as a technique that anticipates the user’s future requests and fetches them into the cache prior to an explicit request made. Because web objects are of various types, a new algorithm is proposed that concentrates on prefetching embedded objects, including audio and video files. Further, clustering is employed using adaptive resonance theory (ART)2 in order to prefetch embedded objects as clusters. For comparative study, the web objects are clustered using ART2, ART1, and other statistical techniques. The clustering results confirm the supremacy of ART2 and, thereby, prefetching web objects in clusters is observed to produce a high hit rate.
Introduction
The advance in Internet technologies has increased the number of web resources to a greater extent. To utilize the web resources effectively, quick web search in addition to response for user request is decisive. User-perceived latency occurs due to overloading of individual servers and network congestion. Much research has been done in this area to minimize the user-perceived delay. Domenech et al. (Citation2010) says web prefetching is a technique that enables faster web search by proactively fetching content before users actually request it. It predicts the user’s future requests for web objects by using various methods and brings them into the cache prior to an explicit request for them. From the perspective of a server, web access patterns frequently exhibit strong temporal locality.
Various web prefetching methods are proposed and reported in the literature. Web prefetching can be client based (Balamash, Krunz, and Nain Citation2007), server based (Marquez, Domenech, and Pont Citation2008) or proxy-server based (Wu and Kshemkalyani Citation2006). Prefetching based on semantics, Markov models, dynamic web pages, and graphs have been suggested. Gracia and Sudha (Citation2013) suggest storage models that rely on Markov- model-based approaches for effective prediction. However, they cannot include new patterns because the predictions are solely based on the history accessed during the last time period. Lam and Ngan (Citation2006) studied the effectiveness of using prefetching to resolve problems in handling dynamic web pages; however, only the temporal properties of the dynamic web pages are explored.
Dependency-graph-based prefetching (Padmanabhan and Mogul Citation1996) suggest the construction of a dependency graph for predicting the next page. This approach predicts and prefetches the nodes whose arcs connect to the currently accessed node and with weights higher than a threshold. However, the prediction accuracy is low because only pair dependencies between two web pages are examined. Gu, Wang, and Jiang (Citation2010) present metadata prefetching based on relationship graphs with a significantly lower hit rate of 70%. Venketesh, Venkatesan, and Arunprakash (Citation2010) investigate semantic-based prefetching that relies on predicting the future requests based on semantics. The semantic preferences are exploited by analyzing the keywords in the URL anchor text or the documents that were previously accessed.
Clustering, an unsupervised learning task, is effective when there is a large similarity in the dataset. The data is organized into clusters such that intradata instances within a cluster are similar to each other and the interdata instances between clusters are much dissimilar. Clustering is effective because related instances can be grouped so that the retrieval of data is faster. As pointed out (Vakali, Pokorny, and Dalamagas Citation2004), a wide range of web-data clustering schemes is present in the literature. These focus mainly on clustering of intersite and intrasite web pages. Safronov and Parashar (Citation2003) used the page ranking concept to determine the pages to be prefetched. Here, the high-rank pages are prefetched, replacing pages of low ranks in cache. Clustering can be based on statistical and evolutionary algorithms. Kumar et al. (Citation2014) says that the convergence of hierarchical clustering is based on the inconsistency criteria. Variant of the k-means algorithm and the fuzzy c-means are discussed by Sueli A. Mingoti et al. (Citation2006). The variant k-means is applied with a prior knowledge of the number of clusters and the initial cluster centroids. Further, the fuzzy c-means is similar to k-means but has poorer boundaries separating the clusters, because the observations are classified in such way that some clusters are very close together.
Researchers are presently exploring clustering with evolutionary or soft computing methods such as artificial neural networks (ANN). Self-organizing map (SOM) and adaptive resonance theory (ART) networks are two well-known networks for clustering. The SOM competitive network self-organizes and provides a topology-preserving mapping from the input space to the clusters. Phoha, Iyengar, and Kannan (Citation2002) studied and report that the competitive neural network learning approach maps the self-similar nature of web traffic to the self-organizing property of the neural network model to schedule the requests for a cluster of servers. Grossberg (Citation2013) reports unlike neural nets such as backpropagation and multilayer perceptron (MLP); ART models exhibit plasticity in addition to stability. They are cognitive and are able to grow additional neurons if a new input cannot be categorized appropriately with the existing neurons. Vieira and Lee (Citation2007) say that ART is developed to solve the learning instability problem suffered by standard feed forward networks. Thomas, Karl-Friedrich, and Torsten (Citation1998) state that ART networks do not have the difficulty in determining the number of clusters.
According to Toufiq Hossain (Kazi, Feng, and Gongzhu Citation2010), clustering-based prefetching is classified into four categories: graph-based clustering, prefetching candidate mining, Support Vector Machine, and neural network.Pallis, Vakali, and Pokorny (Citation2008) propose an algorithm called ClustWeb that generates clusters by partitioning the web navigational graph, using an association-rule mining technique, but it results in overaggressive prefetching when the cluster contains a large number of objects. Moreover, grouping of IPs according to their domains might fail when the IP changes dynamically. Rangarajan et al. (Citation2004) uses the ART1 network to group users and then prefetches the users’ requests based on the prototype vector of each group. Yet, the hit rate is observed to be close to 82% and further, clustering is based on the users rather than their URLs. Gopalakrishnan and Jayarekha (Citation2011) concentrate on clustering Video on Demand (VoD) files by ART2 and prefetching them in clusters and reported a hit rate of 97%. Moreover, clustering is specific to VoD files rather than generalized. On the Internet, actually prefetching based on a specific type of file is impractical.
Hence, with an intention to prefetch all types of web objects that account for actual Internet traffic, clustering of web objects is proposed. Clustering web objects based on users’/clients’ URLs through ART2 is proposed here. The stability and plasticity nature of the ART2 network has forced us to go for implementation of clustering using ART2. A code for locating the clusters based on the request and prefetching them after filtering the least popular web objects of the clusters (groups) is proposed in order to minimize latency.
Architecture of ART2 Network
Laurence (Citation2004) describes the architecture of the ART2 neural network as in . Hourali, M. and Montazer, G. A (Citation2012) explains the ART2 network has two layers, F1 and F2. The F1 and F2 layers form the attentional subsystem and the reset and vigilance (ρ) parameters form the orienting subsystem. In the attentional subsystem, an input pattern is presented to the F1 layer with six units or nodes: w, x, u, v, p, and q. In F1 there exists a supplemental unit that receives the signal from its respective nodes, calculates its norm, and sends it to its corresponding next node. All the units in F1 are calculated using Equations (2)–(7) of Appendix B. The calculation of “w” and “p,” “x,” and “q” is, rather, performed in parallel. The “u” and “p” units form the input and the interface unit, respectively. The “p” unit of the F1 layer is connected to the F2 layer through top-down and bottom-up weights. When the processed signal in p unit reaches equilibrium, the signal is passed to the F2 layer for subsequent processing. The nodes of the F2 layer compete with each other to produce a winning unit.
Figure 1. Architecture of ART2 network.
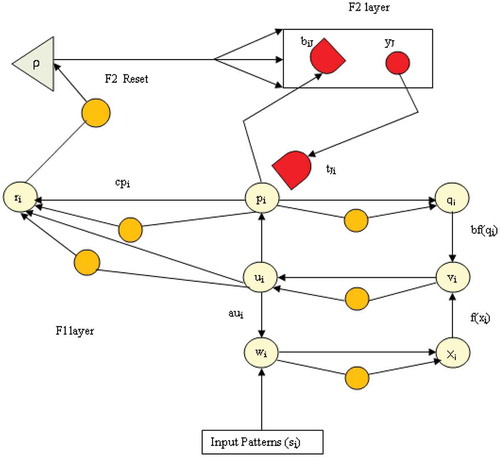
The units of F2 compete in a winner-take-all mode and choose the unit that matches the input. The similarity between the unit from the F2 layer and the input (original pattern) from F1 is computed by the ρ value. If the matching value “r” is greater than the vigilance value, then the corresponding bottom-up and top-down weights, respectively, of the present input are updated. Otherwise, the reset signal is sent to the F2 layer and the winning unit is inhibited. After inhibition, the other winning unit will be selected from the F2 layer and the process repeats. Once all F2 layer nodes are inhibited, the F2 layer produces a new node and generates the initial corresponding weights to the new node. The Appendix A gives the description of units used in ART2 network.
Proposed System
The main components of the proposed system are the clustering and prefetching block, as shown in . The overall implementation of the proposed system is divided into five phases as follows.
Figure 2. Proposed system.
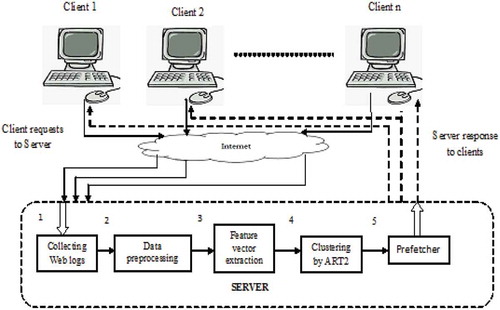
Collection of Access Patterns
The accesses made by several clients are collected from the server access log file.
Data Preprocessing and Preparation
The log file is subjected to preprocessing for clustering. The steps carried out in preprocessing are as follows:
Parsing: Involves identification of the boundaries between the successive records in logs as well as the distinct fields within each record.
Filtering: Involves the elimination of irrelevant entries (i.e., incomplete requests) and unsuccessful HTTP status codes entries. That is, only the successful entries with status code 200 are considered for study.
Finalizing: Finally, the IP addresses of the clients and their URL requests are extracted for subsequent processing.
Extraction of Feature Vectors
The reduced log obtained after preprocessing is fed to the feature extractor in order to obtain the feature vectors corresponding to the clients. The feature vector of a client corresponds to the access counts of its requested URLs. Because the ART2 network supports continuous in Equation (1).
where Nij is the normalized access count corresponding to the jth URL of the ith client, Vali,j is the original access count of the ith client for the jth URL, dmin(i) and dmax(i) are the minimum and maximum access counts corresponding to the ith client.
A sample of a feature vector with the actual and normalized access counts for 7 URLs is shown below in .
Table 1. Representation of sample feature vectors.
Cluster Block
The feature vector thus obtained forms the input pattern (training data) of the cluster block. The input patterns corresponding to different clients are fed as input to this block, which clusters them. The clustering algorithm for ART2 is presented in Appendix B. The output of this block is the clusters of different web objects.
Prefetcher
Depending on the input pattern of the test data, this block identifies the corresponding cluster (candidate cluster) and prefetches all the URLs of this cluster. Prefetching is initiated whenever the system is idle. The algorithm for identifying the cluster and prefetching the URLs of the identified cluster is presented in Appendix C. In this algorithm, the candidate cluster selection is based on the highest bottom-up weight. The average of the minimum and the maximum weight of the candidate cluster is used as a selection index for the web objects to be prefetched from the candidate cluster. By doing this, prefetching of all the web objects corresponding to the candidate cluster is avoided. This reduces the number of web objects prefetched because this extracted set belongs to the frequently accessed web objects within the selected cluster. Therefore, higher hit rates are achievable.
Evaluation Metrics
Evaluation metrics tests the efficacy of the techniques. The metric used for evaluating the performance of clustering is as follows.
Silhouette Index (SP)
For each data point p in a cluster, it is the ratio of the differences between the measure of separation and the measure of cohesion to the maximum of separation or cohesion. The average distance between p and all other points in the same cluster is the measure of cohesion, and let it be A. The average distance between p and all points in the nearest cluster is a measure of separation, and let it be B.
The metrics used for evaluating the prefetching performance are as follows.
Hit Rate (HR)
The hit rate is the ratio of the total cache hits to the total client requests made. The greater the hit rate, the greater is the efficiency of the system.
Precision (PC)
Precision is the positive predictive value that gives the ratio of the good prefetch hits to the total number of prefetches or predictions made. This measure gives the exactness or the quality. It is the fraction of retrieved instances that are relevant.
Recall (RC)
This measure gives the percentage of requested objects that were previously prefetched. This is almost similar to the hit rate obtained by the system. This measure gives the completeness or the quantity. It is the fraction of relevant instances that are retrieved.
F-measure (F)
The weighted average of precision and recall, referred to as F-measure, is given as follows. A higher value of F indicates higher accuracy of the system and vice versa.
Simulation Results
In the server, a webpage with multiple web objects (images, video, audio, and text documents) is designed to carry out the simulation. The neural network models ART2 and ART1 are implemented using MATLAB R2013a version and supported by Internet Information Server (IIS). The experiment is carried out by creating a test bed comprising the server with multiple clients. All the clients are connected with a bandwidth connectivity of 1 Gbps under a standard Gigabit Ethernet environment. The dataset is of 102 MB in size comprising 50 clients and 100 URLs. The size of cache memory used is 512 MB. The client’s request (dataset) over for a long span (roughly around 10,000 requests) was collected from the web server access logs. The log file is preprocessed and the feature vector for 50 clients is obtained.
Clustering
The input patterns thus obtained are fed to the input layer of ART1 and ART2 with ρ = 0.9 for clustering. The number of clusters and the top-down weights of the URLs in each cluster obtained through ART2 and ART1 are displayed in and , respectively.
Figure 3. Cluster formation through ART2 network.
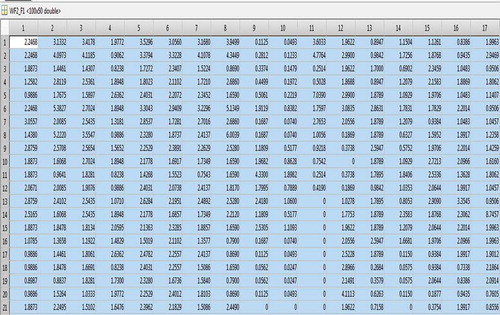
Figure 4. Cluster formation through ART1 network.
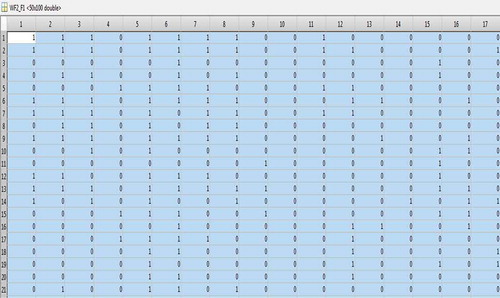
The rows and the columns of the tables in and represent the URLs and the resulting clusters correspondingly. ART2 clustered these input patterns into 45 clusters and ART1 clustered into 50. However, due to space complexity, only 17 clusters corresponding to 21 URLs are displayed. The cluster results prove that clustering through ART2 is superior to that of ART1. This is because the discrete input to ART1 trains the network and clusters them almost equal to the number of clients (input patterns). However, in the case of ART2, because the normalized continuous values are fed as input, the network is trained to cluster them based on the client’s access count rather than the number of clients.
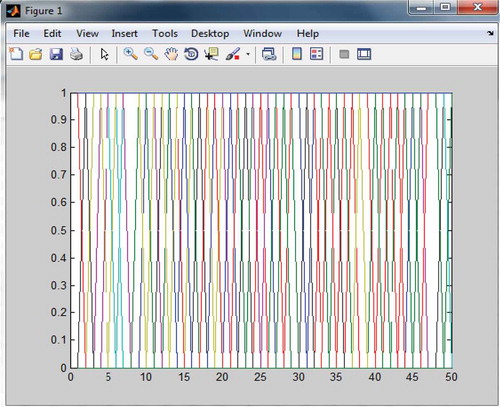
and depict the data points of the various clusters with their weights for ART2 and ART1, respectively. The x-axis represents the input pattern and the y-axis represents the top-down weights. The different colors refer to various clusters. In and , the different colors correspond to different clusters. In , the variation in top-down weights is obvious, but in the case of , there is no variation in the top-down weights because of the discrete weights. This leads to inefficient clustering in comparison with that of ART2. This helps us to conclude the superiority of ART2 over that of ART1.
Figure 5. Plot of the top-down weights vs. clusters using ART2.
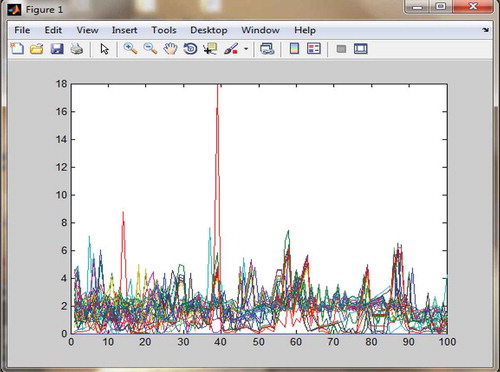
Figure 6. Plot of the top-down weights vs. clusters using ART1.
Validation of ART2
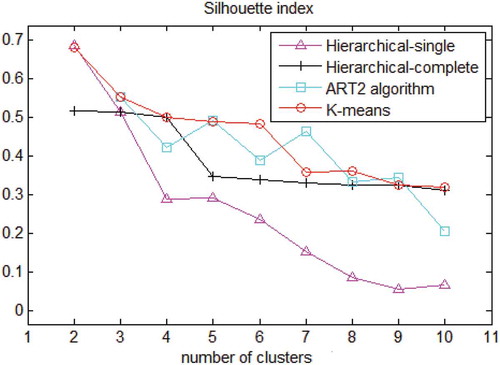
To substantiate the selection of ART2 for clustering, validation of the various clustering techniques is carried out. The standard Fishers iris dataset from the UCI repository is used for validating ART2. It consists of three species of iris: Iris Setosa, Iris Virginica and Iris Versicolor with 50 specimens of each. The Silhouette Index is used to study and compare the clustering performance of ART2 and other statistical algorithms such as k-means, hierarchical single and hierarchical complete. depicts the optimal number of clusters formed by various algorithms such as k-means, hierarchical single and hierarchical complete, and ART2 algorithms. The Silhouette Index is highest at two clusters for hierarchical single and hierarchical complete, but for k-means and ART2 it is three clusters. Because iris data consist of three well-identified labels, three clusters should be formed. K-means and ART2 were able to produce the same three clusters. Further, from , it is clear that the Silhouette Index of ART2 is higher than other techniques always, confirming the supremacy of ART2. The stability and plasticity of all the data are maintained during experimentation.
Figure 7. Plot of the optimal number of clusters by various algorithms.
Prefetching
For effective prefetching, prefetching in clusters is the aim, and the following cases are studied.
Scenario 1
To study the performance of prefetching, training and testing for different ratios of the dataset (input pattern) using k-fold validation with ρ = 0.9 for ART2 and ART1 is carried out. Their corresponding results are tabulated in .
Table 2. Training 3: for ρ = 0.9 and number of epochs = 100.
From the , the hit rate obtained through ART2 is higher than that of ART1. This further confirms the supremacy of clustered prefetching using ART2. Further, the number of clusters formed through ART2 is fewer than ART1. ART1 roughly clusters the input pattern into approximately 50 clusters, almost equal to the number of clients. From this, it is inferred that ART2 clustering is dominant over ART1.
Further, to study the impact of the vigilance parameter (ρ), clustering for different values of ρ (ρ = 0.4 and 0.7) is carried out, and their corresponding hit rate due to prefetching is depicted in and . The hit rate and the number of clusters formed for various ρ values are plotted in –, respectively. From the and , the hit rate through ART2 is observed to be higher than ART1. Thus, it is concluded that ART2 is well suited for clustering the unsupervised data and thereby supports efficient prefetching.
Table 3. Training 1: for ρ = 0.4 and number of epochs = 100.
Table 4. Training 2: for ρ = 0.7 and number of epochs = 100.
Figure 8. Plot of the hit rate vs. vigilance value.
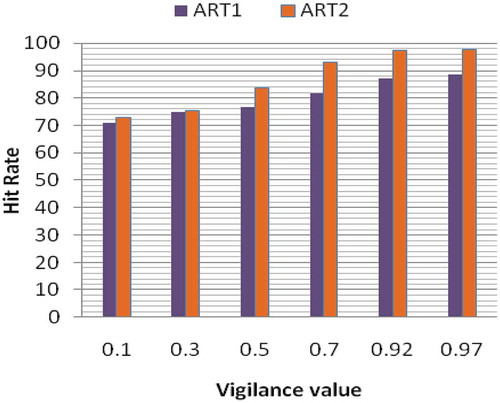
Figure 9. Plot of number of clusters vs. vigilance value.
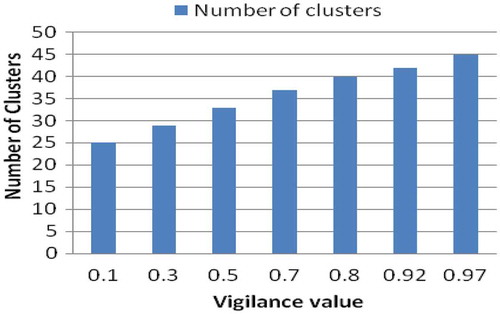
From , the hit rate is found to increase with increase in the vigilance parameter ρ. Moreover, from , the number of clusters formed is also observed to increase as ρ increases. When the vigilance parameter is lower, fewer clusters are found to be formed. Hence, for effective prefetching, the vigilance parameter should be set high.
Also, from the –, hit rate of 98% to 100% in case of ART2 is observed when the page requested has links to only text files. However, a hit rate of 91%–97% is observed when the page requested contains all types of files (i.e., audio, video, and text). This is because the sizes of audio and video files are larger, and cache memory occupation is high, leading to a slight reduction in hit rate. A hit rate of less than 90% is observed at lower percentages of training data and low vigilance values. Hence, for effectual prefetching, the percentage of training data should be large in addition to a high vigilance parameter. A large training dataset helps in adapting the network to better cluster formation.
Scenario 2
To examine the prefetching performance, tests for various volumes of cache and the corresponding results are plotted in .
Figure 10. Plot of the hit rate vs. cache size.
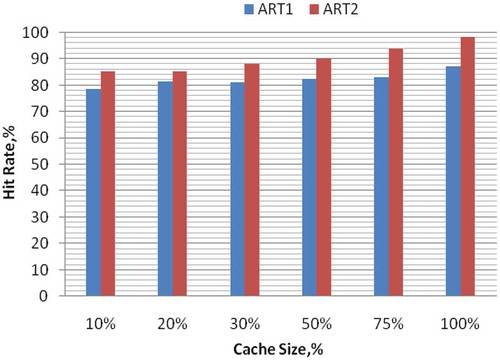
From the plot, the hit rates by ART2 are found to be higher than those of ART1. Thus, prefetching using ART2 clustering is superior to prefetching using ART1.
Scenario 3
The recall, precision and F-measure obtained for the different requests made by clients is depicted in .
Figure 11. Plot of the number of requests vs. performance measures.
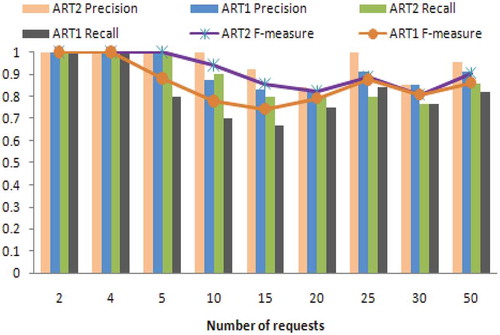
From , the recall, precision and F-measure of ART2 are higher than those of ART1. This is because of the achievement of higher hit rates by ART2 than ART1. This proves that prefetching through ART2 is more efficient than prefetching through ART1.
Thus, from all the test cases, it is evident that prefetching in clusters using ART2 outperforms that of ART1. This elucidates the fact that clustering is enhanced using the ART2 network and, thereby, prefetching is also enhanced.
Conclusion
Clustering is grouping data into clusters such that the intradata instances are similar to each other and the interdata instances are very much dissimilar. Clustering is performed by ART2 for comparison with ART1 and other statistical techniques. On comparison, the Silhouette Index of ART2 clustering is found to be higher than that of other techniques, confirming its supremacy. Exploiting the concept of ART2 clustering, prefetching of web objects in clusters is proposed. Because ART1 neural networks support only discrete values, exact clustering and further prediction is not found to be accurate. Because ART2 supports continuous values, clustering and, subsequently, prefetching are found to be enhanced. The clustering algorithms and prefetching codes are implemented in MATLAB and their results are presented. The experimental results prove clustered prefetch using ART2 to be superior to ART1. Further, attempts are being planned to boost the cache performance through improved cache replacement strategies to augment the system performance. Prefetching web objects with machine learning algorithms is the aim of the future scope this work.
References
- Balamash, A., M. Krunz, and P. Nain. 2007. Performance analysis of a client side caching/prefetching system for web traffic. Computer Networks 51 (13):3673–92. doi:10.1016/j.comnet.2007.03.004.
- Domenech, J., A. Pont-Sanju’an, J. Sahuquillo, and J. A. Gil. 2010. Evaluation analysis and adaptation of web prefetching techniques in current web, 239–71. Web-Based Support Systems. London: Springer, 239–271.
- Gopalakrishnan Nair, T. R., and P. Jayarekha. 2011. Strategic prefetching of VoD programs based on ART2 driven request clustering. International Journal of Information Sciences and Techniques (IJIST) 1 (2):13–21.
- Gracia, C. D., and S. Sudha 2013. MePPM– Memory efficient prediction by partial match model for web prefetching. Paper presented at IACC 2013: Proceedings of the 3rd IEEE International Advance Computing, Conference (IACC), February 2013, Ghaziabad, UP, 736–740.
- Grossberg, S. 2013. Adaptive resonance theory: How a brain learns to consciously attend, learn and recognize a changing world. Neural Networks 37:1–47. doi:10.1016/j.neunet.2012.09.017.
- Gu, P., J. Wang, and H. Jiang. 2010. A novel weighted-graph based grouping algorithm for metadata prefetching. IEEE Transactions on Computers 59 (1):1–15. doi:10.1109/TC.2009.115.
- Hourali, M. and Montazer, G. A.. 2012. Using ART2 neural network and Bayesian network for automating the ontology constructing process. Procedia Engineering 29, 3914–3923. pp. 3914–3923.
- Kazi, T. H., W. Feng, and H. Gsongzhu 2010. Web object prefetching: Approaches and a new algorithm. In Proceedings of IEEE 11th ACIS international conference on software engineering, artificial intelligence, networking and parallel /distributed computing. SNPD, June 2010, London, 115–120.
- Kumar, G., H. Mehra, A. R. Seth, P. Radhakrishnan, N. Hemavathi, and S. Sudha 2014. An hybrid clustering algorithm for optimal clusters in wireless sensor networks. Paper presented at the Electrical, Electronics and Computer Science (SCEECS) IEEE Students’ Conference on Electrical, Electronics and Computer Science (SCEECS), March 2014, Bhopal, 1–6.
- Lam, K.-Y., and C. H. Ngan. 2006. Temporal pre-fetching of dynamic web pages. Information Systems Journal, Elsevier 31:149–69. doi:10.1016/j.is.2004.11.007.
- Laurence, F. 2004. Adaptive resonance theory. In Fundamentals of neural network, architectures, algorithms and applications USA. Pearson Education, Addison-Wesley, USA.
- Marquez, J., J. A. G. J. Domenech, and A. Pont. 2008. An intelligent technique for controlling web prefetching costs at the server side. Paper presented at the Proceedings of IEEE/WIC/ACM International Conference on Web Intelligence and Intelligent Agent Technology (WI-IAT’08), December 2008, Sydney, NSW, 669–675.
- Mingoti, S. A., and J. O. Lima. 2006. Comparing SOM neural network with fuzzy c-means, k-means and traditional hierarchical clustering algorithms. European Journal of Operational Research, November 2006, 174 (3):1742–59. doi:10.1016/j.ejor.2005.03.039.
- Padmanabhan, V. N., and J. C. Mogul. 1996. Using predictive prefetching to improve World Wide Web latency. ACM SIGCOMM Computer Communication Review 26 (3):22–36. doi:10.1145/235160.
- Pallis, G., A. Vakali, and J. Pokorny. 2008. A clustering based prefetching scheme on a web cache environment. Computers & Electrical Engineering 34 (4):309–23. doi:10.1016/j.compeleceng.2007.04.002.
- Phoha, V. V., S. S. Iyengar, and R. Kannan. 2002. Faster web page allocation with neural networks. IEEE Internet Computing 6 (6):18–26. doi:10.1109/MIC.2002.1067732.
- Rangarajan, S. K., V. V. Phoha, K. Balagani, R. R. Selmic, and S. S. Iyengar. 2004. Adaptive neural network clustering of web users. IEEE Computer 37:34–40. doi:10.1109/MC.2004.1297299.
- Safronov, V., and M. Parashar. 2003. Optimizing web servers using page rank prefetching for clustered accesses. Information Sciences 150 (3–4):165–76. doi:10.1016/S0020-0255(02)00375-4.
- Thomas, F., K. Karl-Friedrich, and K. Torsten. 1998. Comparative analysis of fuzzy ART and ART-2A network clustering performance. IEEE Transactions on Neural Networks 9 (3):544–59. doi:10.1109/72.668896.
- Vakali, A., J. Pokorny, and T. Dalamagas 2004. An overview of web data clustering practices. Proceedings of the EDBT Workshops, Heraklion, Crete,
- Venketesh, P., R. Venkatesan, and L. Arunprakash. 2010. Semantic web prefetching scheme using naïve Bayes classifier. International Journal of Computer Science and Applications 7 (1):66–78.
- Vieira, F. H. T., and L. L. Lee. 2007. A neural architecture based on the adaptive resonant theory and recurrent neural networks. International Journal of Computer Science & Applications, Techno Mathematics Research Foundation 4:345–56.
- Wu, B., and A. D. Kshemkalyani. 2006. Objective optimal algorithms for long-term web prefetching. IEEE Transactions on Computers 55 (1):2–17. doi:10.1109/TC.2006.12.
Appendix A
Nomenclature for Appendices B and C
Appendix B
Algorithm for clustering, using ART2
The step-by-step procedure for adaptation of the network to the input for clustering is illustrated following.
Step 1: Initialize the parameters (a, b, c, d, e, ρ, θ, α), the top-down weights (tiJ) and the bottom-up weights (bJi).
(Initially a = b = 10, c = 0.1 and d = 0.9 in order to satisfy the equation).
Let e = 0, , α = ρ = 0.1, t0i = 0 and
.
Step 2: For each input pattern, do Steps 3–10.
Step 3: Update the F1 layer activation. Calculate wi, xi, and vi as follows while others are set to zero.
Table
Step 4: Update the F1 layer activation again and calculate the following parameters using Equations (B.1)–(B.6).
Here,
Step 5: Calculate the F2 layer activation.
Find if reset condition ≥ ρ-e is true, perform Steps 6 and 7 where
Step 6: Find the maximum activation unit J in the second layer (F2).
Step 7: Check for reset. Perform Equations (B.1) and (B.3) and,
if < ρ-e, then yJ = −1 and inhibit the unit J. Then return to Step 5.
Else,
if ≥ ρ-e, then calculate Equations (B.2), (B.4), (B.5), (B.6) and go to Step 8.
Step 8: Update the weight of winning unit J.
Step 9: Update the F1 layer activation. Perform Equations (B.1)–(B.6).
Step 10: Test stopping condition for weight updates.
Step 11: Test if the number of stop epochs is reached, if true, stop, else proceed to Step 2.
Now, the block has trained the network and finally clustered the input pattern into clusters with URLs as members.
Appendix C
Proposed Algorithm for Prefetching URLs
Input: x, a requested URL
Output: X, a set of prefetched URLs
CCk – is the kth cluster corresponding to the highest bottom-up weight.
begin
Initialize X as empty set
//selection of bottom-up weights
if x is in cache, then prefetching not required
else Find J such that bJi > v for all nodes j of URLi, where
Find CCk that is connected to x with bJi weights
For each uj є URL connected to CCk do
//selection of top-down weights
Get the cluster number (CCk) corresponding to the weight selected from bJi
Get the maximum and minimum values from tkj (clustmax and clustmin)
Find
if uj > C, then
if uj is not in cache, then X←X U uj
end
return X
end