
ABSTRACT
This paper evaluates the effect on the predictive accuracy of different models of two recently proposed imputation methods, namely missForest (MF) and Multiple Imputation based on Expectation-Maximization (MIEM), along with two other imputation methods: Sequential Hot-deck and Multiple Imputation based on Logistic Regression (MILR). Their effect is assessed over the classification accuracy of four different models, namely Tree Augmented Naive Bayes (TAN) which has received little attention, Naive Bayes (NB), Logistic Regression (LR), and Support Vector Machine (SVM) with Radial Basis Function (RBF) kernel. Experiments are conducted over fourteen binary datasets with large feature sets, and across a wide range of missing data rates (between 5 and 50%). The results from 10 fold cross-validations show that the performance of the imputation methods varies substantially between different classifiers and at different rates of missing values. The MIEM method is shown to generally give the best results for all the classifiers across all rates of missing data. While NB model does not benefit much from imputation compared to a no imputation baseline, LR and TAN are highly susceptible to gain from the imputation methods at higher rates of missing values. The results also show that MF works best with TAN, and Hot-deck degrades the predictive performance of SVM and NB models at high rates of missing values (over 30%). Detailed analysis of the imputation methods over the different datasets is reported. Implications of these findings on the choice of an imputation method are discussed.
Introduction
Three types of problems are associated with missing values in data mining (Luengo, Garca, and Herrera Citation2012): (1) loss of efficiency; (2) complications in handling and analyzing the data; and (3) bias resulting from differences between missing and complete data. Furthermore, for the specific task of classification, most algorithms cannot work directly with incomplete datasets (Garcia-Laencina, Sancho-Gómez, and Figueiras-Vidal Citation2010) and therefore reverting to imputation is often unavoidable. Missingness is particularly present for high-dimensionality problems where most, if not all, cases are incomplete. For example, users of a recommender system only rate a very small fraction of the available books, movies, or songs, leading to massive amounts of missing values.
Generally, imputation procedures are divided into two main categories (Farhangfar, Kurgan, and Jennifer Citation2008; Garcia-Laencina, Sancho-Gómez, and Figueiras-Vidal Citation2010; Little and Rubin Citation1987):
Imputation methods based on statistical analysis
These techniques can be subdivided into two subcategories: (i) model based and (ii) quasi-randomization inference based (data driven) (Farhangfar, Kurgan, and Jennifer Citation2008). Model-based methods assume that the population quantities of interests are outcomes of random attributes (variables), indexed by unknown population parameters. Quasi-randomization procedures, on the other hand, assume that the population values are fixed, i.e., they are not governed by unknown parameters, and therefore are not the outcomes of random attributes. Statistical methods range from simple data-driven methods such as mean imputation to complex model-based methods that perform parameter estimation such as likelihood-based algorithms.
Imputation methods based on machine learning
These methods are sophisticated procedures, which generally consist of creating a predictive model to estimate values that will substitute those missing. In contrast to statistical methods, these algorithms generate a data model from data that contain missing values; next, the model is used for classification that imputes the missing values. There are several options varying from imputation with K-nearest neighbor (K-nn) to imputation procedures based on auto-associative neural networks (AANN) (Garcia-Laencina, Sancho-Gómez, and Figueiras-Vidal Citation2010).
The goal of this paper is to present a comprehensive study of the impact of applying new imputation methods on classification accuracy of several leading classifiers [including Tree Augmented Naive Bayes (TAN) which has not been thoroughly studied in the literature]. Furthermore, most of the investigations on imputation of missing values for classification purposes focus on a very limited scope of relatively small amounts of missing values (i.e., between 1 and 20%), with the notable exception of one investigation (Farhangfar, Kurgan, and Jennifer Citation2008). This study investigates a wider range of consistent amounts of missing data, which allows for a wide range of evaluation of the quality of imputation with respect to the varying missing rates. To this end, this paper provides:
4 different classification models including 2 generative (Naive Bayes and Tree Augmented Naive Bayes) and 2 discriminative models [Logistic Regression (LR) and Support Vector Machine (SVM)]. The models belong to major families of machine learning algorithms: Naive Bayes (NB) and TAN are two probabilistic models, and SVM belongs to kernel-based classifiers.
4 imputation methods including 2 single (missForest and Hot-deck) and 2 multiple imputation methods [based on LR and Expectation-Maximization (EM) algorithms].
A wide range of missing data rates per record for all the datasets (5%, 10%, 20%, 30%, 40%, and 50%).
A number of binary test datasets: 14 datasets with a large number of features.
In the context of this study, we focus on fixed number of missing values per record. One important example of such incomplete records is Computerized Adaptive Testing. Student test data are used for training skill mastery models. In such models, test items (questions) represent variables that are used to estimate one or more latent factors (skills). For a number of practical reasons, the pool of test items often needs to be quite large, such as a few hundreds and even thousands of items. However, for model training, it is impractical to administer a test of hundreds of questions to examinees in order to gather the necessary data. We are thus forced to administer a subset of these test items to each examinee, leaving unanswered items as missing values. Another example can be found in the context of medical records where we also have a limited number of medical tests available per patient.
The rest of the paper is organized as follows. After reviewing the relevant previous work, Section 3 briefly explains the missing value mechanism assumed in this study and presents the basis of the imputation methods and gives a brief review of the classification models used in this paper. In Section 4, the experimental framework including the methodology and the benchmark datasets is introduced. In Section 5, the results obtained are analyzed. Finally, we make some concluding remarks.
Related work
Imputation methods have been widely studied. The first formal studies on missing values and initial imputation approaches were carried out several decades ago. The work of Little and Rubin (Citation1987) laid the foundation of further works in this topic, especially in statistics. The literature on imputation methods in data mining employs well-known machine learning methods as well for the studies, in which the authors show the convenience of imputing the missing values for the mentioned algorithms, particularly for classification. The vast majority of missing values studies in classification usually analyze and compare one imputation method against a few others under controlled amounts of missing values and induce them artificially with known mechanisms and probability distributions. Some recent studies that investigated the impact of imputation on the accuracy of the subsequently performed classification are briefly overviewed below.
Farhangfar, Kurgan, and Pedrycz (Citation2007) develop a unified framework supporting a host of imputation methods. Their framework integrates a number of imputations methods (NB and Hot-deck) and compares this with other basic methods (Mean, Linear Discriminant Analysis, etc.). Farhangfar, Kurgan, and Jennifer (Citation2008) extend the previous study using discrete data, comparing with more classical imputation methods including three other single imputation methods (Mean, Hot-deck, and Naive Bayes) and one multiple imputation method (a polytomous regression based method). This study investigates the performance of the classifiers Repeated Incremental Pruning to Produce Error Reduction (RIPPER), C4.5, K-nn, SVM with polynomial and RBF kernels, and Naive Bayes on imputed data. The missing values are produced artificially in a wide-ranging amount for each of the datasets. This study shows that the impact of the imputation varies among different classifiers, and imputation is advantageous for the most missing values proportions higher than 5%. The performed experimental study also shows that there is no universally best imputation method among the ones studied.
Song et al. (Citation2008) study the relationship between the use of the K-nn imputation method and the C4.5 performance (counting with its proper missing value technique) over 6 datasets of software projects. They emphasize the different missing value mechanisms and the amount of missing values introduced. From their analysis, they found results that agree with Batista and Monard (Citation2003): K-nn imputation can improve the C4.5 accuracy. They also show that the missingness mechanism and pattern affect the classifier and imputation method performance.
Twala (Citation2009) empirically analyzes 7 different procedures to treat artificial missing values for decision trees over 21 real datasets. From the study, it can be concluded that listwise deletion is the worst choice, while the multiple imputation strategy performs better than the rest of the imputation methods (particularly those with high amounts of missing values), although there is no outstanding procedure.
Garcia-Laencina, Sancho-Gómez, and Figueiras-Vidal (Citation2010) evaluate the influence of imputing missing values on the classification accuracy obtained by an artificial neural network (multilayer perceptron). Four imputation techniques are considered: K-nn, Self-organizing Maps (SOM), Multilayer Perceptron (MLP), and EM over one synthetic and two real datasets, varying the amount of missing values introduced. They conclude that in real-life scenarios, a detailed study is required in order to evaluate which missing values estimation can help to enhance the classification accuracy.
Luengo, Garca, and Herrera (Citation2010) study several imputation methods for Radial Basis Function Network (RBFN) classifiers, both for natural and artificial [Missing Completely at Random (MCAR)] missing values. From their results, it can be seen that the EC method has a good synergy with respect to the RBFN methods, as it provides better improvements in classification accuracy.
Gheyas and Smith (Citation2010) propose a single and a multiple imputation method (the terms single and multiple imputation are explained in the section “Imputation Methods”), both of them based on a generalized regression neural network (GRNN). Their proposal is compared with 25 imputation methods ranging from machine learning methods to several variants of GRNNs. Ninety-eight datasets are used with different missing value mechanisms. Using three models of classifiers namely, MLP, LR and a GRNN-based classifier, their results show the advantages of the GRNN-based proposal.
Luengo, Garca, and Herrera (Citation2012) study the performance of three different categories of classification models namely Rule Induction Learning, Approximate Models, and Lazy Learning categories under fourteen different single imputation methods. Their results show that the use of determined missing values imputation methods could improve the accuracy obtained for these models. So, in this study, the convenience of using imputation methods for preprocessing datasets with missing values is confirmed. They also suggest that the use of particular imputation methods conditioned to the groups is required.
Description of investigated approaches
The assumptions we make about the missingness mechanism and the pattern of missing values can affect which imputation method could be applied, if any. Therefore, in this section, we first take a brief look at the nature of missing data as the imputation methods generally rely on specific missingness mechanism assumption.
The nature of missing data
As mentioned, when addressing missing data, it is critical to know the mechanism (cause) of that missing data and any pattern to the missing data. Three general types of missing data based on the mechanism can be derived from the literature. Each type is characterized by a level of randomness and missingness, and the identification of the type of missing data ultimately leads to our ability to manage (or not manage) the missing values.
Missing completely at random (MCAR)
MCAR is the highest level of randomness. There is no dependency between missing attributes at all. In other words, data are MCAR when the probability of missing data on a variable X is unrelated to other measured variables and to the values of X itself. For this type of missingness, any piece of data is just as likely to be missing as any other piece of data.
Missing at random (MAR)
With MAR, the probability of missing data on any attribute does not depend on its own value, but rather relies on the values of other attributes (Liu and Lei Citation2006). The propensity for missing data is correlated with other study-related variables in an analysis. It could in fact be entirely determined by other variables. As an example, suppose that a school district administers a math aptitude exam, and students that score above a certain cut-off participate in an advanced math course. The math course grades are MAR because missingness is completely determined by scores on the aptitude test (students that score below the cut-off do not have a grade for the advanced math course) (Baraldi and Enders Citation2010).
Not missing at random (NMAR)
In this case, missing data depend on the values that are missing (Liu and Lei Citation2006). In other words, the NMAR mechanism describes data that are missing based on the would-be values of the missing scores. For example, consider a self-report alcohol assessment administered to high school students. NMAR data would result if heavy drinkers are more likely to skip questions out of fear of getting in trouble (Baraldi and Enders Citation2010).
Of the three missing data mechanisms, it is only possible to empirically test the MCAR mechanism (methodologists have proposed a number of MCAR tests) (Baraldi and Enders Citation2010). In contrast, the MAR and NMAR mechanisms are impossible to verify because they depend on the unobserved data. That is, demonstrating a relationship (or lack thereof) between the probability of missingness and the would-be values of the incomplete variable requires knowledge of the missing values. Since, in case of the MCAR, the assumption is that the distributions of missing and complete data are the same, Farhangfar, Kurgan, and Jennifer (Citation2008) and Matsubara et al. (Citation2008) state it is only in the MCAR mechanism case where the analysis of the remaining data could give a valid inference (classification in our case) due to the assumption of equal distributions. Both of the other mechanisms could potentially lead to information loss that would lead to the generation of a biased/incorrect classifier (i.e., a classifier based on a different distribution). So, MCAR mechanism is assumed in this paper.
Imputation methods
This study investigates two standard single and multiple imputation algorithms which are at the same time representatives from three imputation mainstreams: MILR and Multiple Imputation based on Expectation-Maximization (MIEM), two model-based imputation methods; Hot-deck, a statistical data driven (quasi-randomization) imputation; and missForest, a machine learning based method.
Single imputation algorithms
In single imputation methods, a missing value is imputed a single value. The single imputation methods used in this study are:
MissForest (MF)
The recently proposed missForest method is a nonparametric imputation method for basically any kind of data. It can cope with mixed type of variables, nonlinear relations, complex interactions, and high dimensionality (Stekhoven and Buhlmann Citation2012). The algorithm is based on random forest (Breiman Citation2001). For each variable, missForest fits a random forest on the observed part and then predicts the missing part. The algorithm continues to repeat these two steps until a stopping criterion is met or the user-specified maximum of iterations is reached. So, missForest runs iteratively, continuously updating the imputed matrix variable-wise, and assesses its performance between iterations. This assessment is done by considering the difference(s) between the previous imputation result and the new imputation result. As soon as this difference (in case of one type of variable) or differences (in case of mixed type of variables) increase, the algorithm stops. For further details see (Stekhoven and Buhlmann Citation2012).
Hot-deck (HD)
Generally, hot-deck imputation involves replacing missing values of one or more variables for a non-respondent record (called the recipient) with the observed values from a respondent record (the donor) that is similar to the non-respondent record with respect to characteristics observed by both cases. The term “hot deck” dates back to the storage of data on punched cards, and indicates that the information donors come from the same dataset as the recipients. The stack of cards was “hot” because it was currently being processed. By contrast, cold-deck imputation selects donors from another dataset. Several different versions of hot-deck imputation method are in use in the literature. Sequential hot-deck imputes the missing values in each variable by replicating the most recently observed value in that variable. This is by far one of the fastest imputation methods commonly used for item nonresponse in survey research. Only one pass of the data is needed. It requires the data to be MCAR (Sande Citation1983; Templ et al. Citation2011).
Multiple imputation algorithms
Instead of filling in a single value for each missing value, multiple imputation, as its name implies, replaces each missing value with a set of plausible values, which represent the uncertainty about the right value to impute. Multiple imputation creates m complete copies of the dataset, each containing different imputed values (i.e., across these completed datasets the observed values are the same, but the missing values are filled in with different imputations). Each of these m versions is then processed identically using standard complete-data methods, and the results from the m complete analyses are combined to produce inferential results. illustrates the three distinct steps to performing a multiple imputation which are: Imputation phase, Analysis phase, and Pooling phase. Based on Rubin’s study (Rubin Citation1987), unless the rate of missingness is exceptionally high, in most situations there is simply little advantage to producing and analyzing more than a few (3–10) imputed datasets. According to his conclusion in that study, we have used m=5 for the range of missing rates used in the current study.
Various multiple imputation methods have been proposed by different researchers. Kim-Hung (Citation1988) and Rubin and Schafer (Citation1990) used probabilistic Bayesian models that compute imputations from the posterior probabilities of the missing data based on the complete data. The Rubin-Schafer method assumes multivariate normal distribution of the data and the MAR mechanism. On the other hand, Alzola and Harrell (Citation1999) introduced a function that imputes each incomplete attribute by cubic spline regression given all the other attributes, without assuming that the data must be modeled by the multivariate distribution. A multiple imputation environment, called multivariate imputation by chained equations (MICE), was developed by Van Buuren and Oudshoorn (Citation1999). It provides a full spectrum of conditional distributions and related regression-based methods. A more recent program which was developed by Honaker, King, and Blackwell, is Amelia II. It creates multiple imputations based on the multivariate normal model (Honaker et al., Citation2011). The two multiple imputation approaches used in this study are further introduced below.
Multiple imputation based on logistic regression (MILR)
MICE incorporates LR, polytomous regression, and linear regression, and uses a Gibbs sampler (Casella and George Citation1992) to generate multiple imputation. It is furnished with a comprehensive state-of-the-art missing data imputation software package. For categorical attributes, MICE provides LR (for binary attributes), polytomous LR, Latent Dirichlet Allocation (LDA), and also a simple random imputation. Our experiment uses MICE’s MILR.
Multiple imputation based on expectation-maximization (MIEM)
Along with the multivariate normality mentioned earlier in this paper, Amelia II makes the usual assumption in multiple imputation that the data are MAR or the simpler special case of MCAR. It first bootstraps a sample dataset with the same dimensions as the original data, estimates the sufficient statistics by EM, and then imputes the missing values of sample. It repeats this process m times to produce the m complete datasets, where, as mentioned, the observed values are fixed and the unobserved values are drawn from their posterior distributions. In this study, we use Amelia II’s multiple imputation based on the EM algorithm.
Classifier models
As mentioned earlier, this study evaluates how the choice of different imputation methods affects the performance of classifiers, which are subsequently used with the imputed data. lists the 4 standard classifiers investigated in this study. We have used Weka’s (Hornik, Buchta, and Zeileis Citation2009; Witten and Frank Citation2005) implementation for all the classifiers in this study. As mentioned earlier, since most of the classifiers cannot work directly with data containing missing values, they need to have some internal mechanisms to handle the problem. In Weka’s implementation of the classifiers, an internal filter is used, which globally replaces the missing values with means/modes (for nominal and numeric attributes respectively).
Experimental methodology
Our experiments have been carried out using the mentioned classifier models and the imputation methods based on the procedure explained below. First, we describe the datasets used in the study.
Datasets
The experiments have been conducted over 14 sets of real binary data. reports general statistics on these datasets. The first dataset in the list, SPECT Heart, is from UCI Machine Learning Repository (Bache and Lichman Citation2013)and datasets D2 to D11 are from KEEL-dataset Repository (Alcalá et al. Citation2010). D12 to D14 come from the education domain. Except for the Poly 2005, they are publicly available to their respective references. This type of data corresponds to Student’s test results in which variables represent test items and records represent students. Since there is no class variable in such datasets, one of the variables in each dataset is randomly chosen to be the class variable. For all the datasets, missing values are assigned randomly into all attributes of each record (using the MCAR mechanism) in the following six amounts: 5, 10, 20, 30, 40, and 50%.
Table 1. Classifiers considered in the study.
Experimental setup
Our experiments have been carried out using the procedure illustrated in . Firstly, for each original dataset (Full version), a predefined ratio of missing values is assigned to a copy of the dataset forming Missing-value contained version, which is subsequently imputed using the mentioned four single and multiple imputation methods resulting in four Imputed versions of the dataset. Finally, in a 10-fold cross-validation process, the imputed datasets are used with the four classifiers: NB, LR, TAN, and SVM with RBF kernel. The classification accuracy of the classifiers is evaluated by applying the corresponding classification model on the test set, as shown in . The results of the above experiments are compared with two baselines in which the imputation is not performed, where (1) the classifiers are trained on data with missing values, and (2) the classification is performed on the complete data. The former experiment establishes a lower limit on accuracy, which should be improved by imputation. It should be mentioned that, in each fold, the same test dataset is used for all of the models over all the imputed and non-imputed datasets.
Figure 1. Main steps used in multiple imputation (here, m is assumed to be 3).
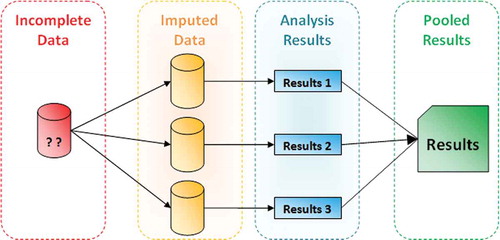
Figure 2. The general procedure of the experiments.
Therefore, using 14 datasets, six different amounts of missing values, four classifier models, and four imputation methods, the mentioned procedure gives us a total of 14 x 6 x 4 x 4 =1344 experiments in each run of a 10-fold cross-validation process. Additionally, 14 x 6 x 4 =336 and 14 x 4 =56 experiments are performed with the missing-value contained and complete datasets, respectively, in each fold.
Results
In this study, the performance of the classifiers has been assessed using a zero-one loss function, which is commonly used to evaluate the classification performance in machine learning. Although some datasets may assume different costs for their classification decisions, we assume a uniform cost for all the classes in order to be able to compare the results across different datasets.
Global classification accuracy as a function of missing rate
gives a comparison between different imputation methods, averaged over all classification models and datasets. It illustrates the percent reduction in classification residual error based on the average classification accuracy compared with the baseline. The improvements are reported for each imputation method against the different ratios of missing values. The baseline (level 0) belongs to the classification on data that contain missing values. As can be seen from , imputation improves the performance of the classification task in general. However, this is not the case for HD method when the missing rate is less than 20%. The largest and most consistent improvements are obtained from the MF and MIEM methods: their improvement substantially increases as the rate of missing values increases.
Classifier performance under different imputation methods
and and show a more detailed analysis of the results with respect to the different classifiers. They report the performance of each individual classifier under the different imputation methods as a function of the rate of missing values. shows the classification improvement with imputed data in terms of reduction in residual errors compared to the condition of directly applying the data with missing values for LR, NB, TAN, and SVM classifiers. contains notched box plots of each combination of imputation method and model for each of the 6 levels of imputation. It provides a more detailed understanding of the performance improvements and allows a general view of the statistical significance of these improvements. Individual points in these plots represent improvement for a single run and a single dataset, and each bar contains quartiles and the median, and individual data points are outliers. It should be noted that the level 0 in the plots represents the classification using the missing-value contained datasets, as a baseline for the comparisons. reports the performance of each imputation method from another perspective. It lists the percentage of the datasets on which applying a given imputation method improves the classification accuracy for each model at different missing rates. Insightful information can be learned from the table, for example, when it comes to deciding about choosing an imputation method the table can tell us which of the methods is more likely to be useful with a given classifier at a given amount of missing values.
Table 2. Datasets at a glance.
Figure 3. Comparison between different imputation methods (Average over the 4 classifiers on all the datasets).
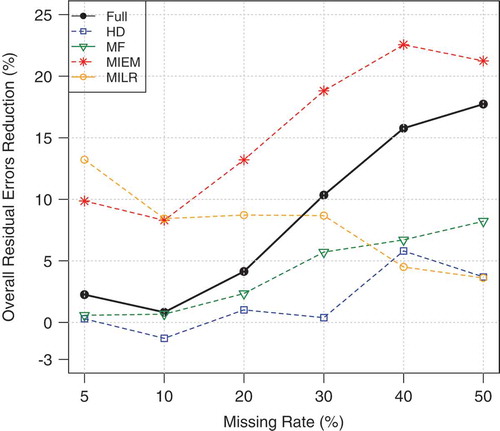
Figure 4. Classification improvement for the LR (top left), TAN (top right), NB (bottom left), and SVM with RBF Kernel (bottom right).
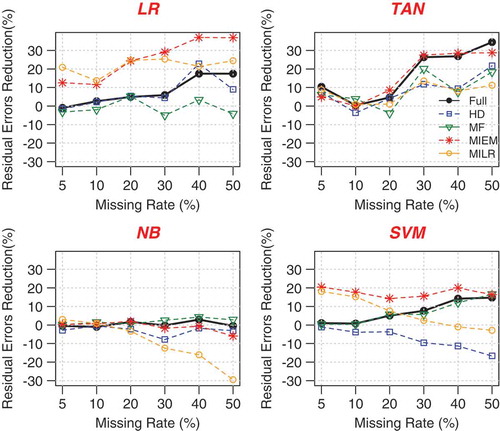
The results show that the impact of the imputation varies for different classifiers. As can be seen from the LR graph in , MIEM results in a substantial reduction of residual errors that increases with higher rates of missing values. Classification with imputed data at 40–50% missing rate using MIEM results in more than 36% reduction in residual errors compared to the classification on the data with missing values as the baseline. shows that in case of applying the MIEM imputation method, the improvement in classification accuracy for LR is statistically significant. and also show that MILR imputation provides significant improvements for LR too. Although the performance of MILR for the higher volumes of missing values decreases (in fact, this is the case for all the considered classifiers as the graphs show), it brings the highest reduction in residual errors to LR for smaller amounts of missing rate. For missing rates above 30%, the graphs also suggest that HD imputation method can provide significant improvements when LR is subsequently used, while using the other single imputation method, MF, results in statistically insignificant differences. The same pattern for LR can be found from , when it comes to count the number of cases (the datasets) on which applying a given imputation method improves the classification accuracy. Here again, we see for the low amount of missing rates (5-20%) MILR and for the higher rates (30–50%) MIEM are the most reliable imputation methods to be used with LR. (MILR at 85.7% of the datasets when missing rate is 30% and MIEM at 92.9% of cases when it is higher than 30% improves the accuracy of LR.) The last point with LR is that it is highly responsive to the considered imputation methods so that our results show when the amount of missingness in the data goes higher than 30%. For each dataset, there is at least one imputation method that brings a significant improvement to the LR classification accuracy.
Figure 5. The plots represent the distribution of paired differences between the classification accuracy using each of the imputation methods and directly applying the data with missing values for each classifier.
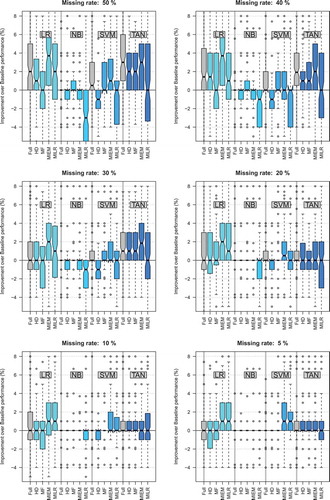
The graphs of illustrate that the average performance improvement of classification of the full datasets over the missing-value datasets increases as a function of missing rate. This is the case for all of the models except for NB for which we see almost the same performance of the model for both complete and incomplete datasets. It seems this leaves little room for imputation methods to help provide the classifier with an improvement in classification accuracy. One explanation for this result is that NB does well with small datasets and therefore imputation does not bring any additional improvement as the peak performance is already obtained with the observed, non-imputed cases. It can only decrease if imputation adds noise in the data, as seen to be the case for MILR. The results also show that MF method brings a little improvement in classification accuracy (2.9–4.3% reduction in residual errors) for larger amounts of missing values (when missing rate is above 30%). Another point to mention is that in case of NB classifier, at each of the considered amounts of missing rates we can find some datasets (at least 2) on which applying the imputation methods, no matter what method is chosen, does not make a positive difference to the classification accuracy (Refer to in Appendix A).
Table 3. Percent of all the datasets on which applying the method improves the classification accuracy of the classifiers.
Table 4. Datasets on which the mean accuracies of the classifiers (over 10 runs and 6 missing rates) on imputed and non-imputed data are significantly different at p < 0.05.
Table 5. Datasets on which the mean accuracies of the classifiers (over 10 runs) on imputed and non-imputed data are significantly different at p < 0.05.
The results for TAN classifier show a significant improvement in classification accuracy on imputed data using HD, MF, and MIEM methods for missing rates above 20%. For smaller rates of missing values, as can be seen from , imputation results are not statistically significant. Among the imputation methods while MIEM is shown to bring the highest improvement with TAN in tandem (on average, more than 27% reduction in residual errors), MF is the one that can be reliably applied on the highest percentage of the datasets (about 93% when MR is 50%) to improve the accuracy of TAN. shows that the improvements of TAN performance resulting from MILR imputation method are not statistically significant. Similar to LR, the TAN model is highly responsive to the considered imputation methods. Our results show that when the missing rate is above 20%, for each dataset we can find at least one imputation method to be used with TAN in order to make a significant improvement in the classification accuracy.
Finally, as illustrates, the SVM classifier with RBF kernel benefits from imputation too. As can also be seen from and , the large majority of the datasets (93%) show significant improvements at the 5% when MILR is applied prior to the subsequent classification. confirms that MIEM plays the same role at all other considered rates of missing values. Results also show that at all the considered missing rates, the highest amounts of average improvement due to imputation are observed from applying MIEM method and we see the improvements are statistically significant at 5%, 20%, and 50% of missing data ( and in Appendix A provide some more detailed information). These results suggest that MIEM is the best imputation method to be used with SVM (with RBF kernel). Although at some amounts of missing values, we can find 1 or 2 datasets on which using HD method helps improve the accuracy of the classifier, as it is clear from the and , on most of the datasets it results in deterioration in prediction performance of the classifier. Results also show that MF method for remarkable number of the datasets brings a better performance for the classifier. For SVM, we noticed that no matter what the missing rate is, applying the imputation methods does not bring any improvement to the performance of the classifier on the two specific datasets: D6 and D8 (Refer to in Appendix A).
Conclusion
Missing data is a common nuisance in many real-world applications of data mining and, in particular, in classification.
The main objective of this work is to evaluate the effect of missing data imputation on the accuracy of subsequent classification. To this end, we performed a comprehensive experimental study, which includes four single and multiple imputation methods that were used to impute missing values in 14 binary datasets. The imputed data were used to perform the classification with four different classifiers to investigate the effect of imputation on the classification performance. We also considered imputations for six different amounts of missing data (i.e., 5, 10, 20, 30, 40, and 50%) per record for each of the datasets, and compared the results obtained from the classification on imputed data with the ones on missing data.
This experimental study shows that the imputation with the tested methods on average improves classification accuracy when compared to classification without imputation. This agrees with the results presented by former studies (e.g., see (Farhangfar, Kurgan, and Jennifer Citation2008)). Analysis of the obtained results with respect to the classifier models used in this study shows that in case of:
LR
The best imputation methods to be used with the classifier in tandem are MILR (when missing rate is 5–20%) and MIEM (when missing rate is above 20%) resulting in statistically significant improvements in classification accuracy (more than 36% reduction in residual errors). HD can be helpful too for higher amounts of missing values (above 30%).
NB
The classifier shows almost the same performance on complete and incomplete data records for most of the imputation methods considered. This agrees with the conclusion made by Farhangfar, Kurgan, and Jennifer (Citation2008) which states that NB is missing data resistant. However, our results show the new imputation method, MF, can bring an improved prediction performance to the classifier when the missing rate is above 30%.
TAN
HD, MF, and MIEM provide the classifier with statistically significant improvements in classification accuracy when missing rate is above 20%. While MIEM results in the highest amount of improvement (more than 27% reduction in residual errors), MF is the most reliable imputation method for the classifier as it improves the prediction performance of the classifier in majority of the datasets at the different considered missing rates (e.g., in 93% of the datasets when missing rate is 50%).
SVM (with RBF kernel)
MIEM is the best imputation method as it results in the highest amounts of improvements in the accuracy of the classifier. These improvements are statistically significant at 5, 20, and 50% missing rates. For most trivial amounts of missing data (less than 10%), MILR is the most reliable imputation method.
LR and TAN are highly susceptible to the imputation methods at higher amounts of missing values (for TAN when missing rate is above 20% and for LR when it is more than 30%). This is not the case for NB and SVM as at each considered amount of missing rates, we can find a few datasets on which applying the imputation methods (no matter which one) does not improve the classifier’s accuracy. Based on the results, we can also conclude that:
MF seems to work best with TAN although; it can also bring an improved prediction performance to all of the other classifiers over remarkable number of datasets at different missing rates. HD can be helpful for TAN and LR (when MR>30%) but not for NB and SVM. The amount of improvement in classification accuracy resulting from applying MILR decreases as missing rate increases. Except for NB, MIEM is the best method to be used with all the classifiers as it results in higher amounts of improvement in classification accuracy. The improvements are also increasing against increasing amounts of missing values.
References
- Alcalá, J., A. Fernández, J. Luengo, J. Derrac, S. Garcia, L. Sánchez, and F. Herrera. 2010. Keel data-mining software tool: Data set repository, integration of algorithms and experimental analysis framework. Journal of Multiple-Valued Logic and Soft Computing 17 (2–3):255–287.
- Alzola, C., and F. E. Harrell. 1999. An introduction to s-plus and the hmisc and design libraries, Citeseer.
- Bache, K., and M. Lichman. 2013. UCI machine learning repository. http://archive.ics.uci.edu/ml.
- Baraldi, A. N., and C. K. Enders. 2010. An introduction to modern missing data analyses. Journal of School Psychology 480 (1):5–37. doi:10.1016/j.jsp.2009.10.001.
- Batista, G. E. A. P. A., and M. C. Monard. 2003. An analysis of four missing data treatment methods for supervised learning. Applied Artificial Intelligence 170 (5–6):519–533. doi:10.1080/713827181.
- Breiman, L. 2001. Random forests. Machine Learning 450 (1):5–32. doi:10.1023/A:1010933404324.
- Casella, G., and E. I. George. 1992. Explaining the gibbs sampler. The American Statistician 460 (3):167–174.
- Ding, Y., and J. S. Simonoff. 2010. An investigation of missing data methods for classification trees applied to binary response data. The Journal of Machine Learning Research 11:131–170.
- Farhangfar, A., L. Kurgan, and D. Jennifer. 2008. Impact of imputation of missing values on classification error for discrete data. Pattern Recognition 410 (12):3692–3705. ISSN 00313203. doi:10.1016/j.patcog.2008.05.019.
- Farhangfar, A., L. A. Kurgan, and W. Pedrycz. 2007. A novel framework for imputation of missing values in databases. Systems, Man and Cybernetics, Part A: Systems and Humans, IEEE Transactions 370 (5):692–709. doi:10.1109/TSMCA.2007.902631.
- Friedman, N., D. Geiger, and M. Goldszmidt. 1997. Bayesian network classifiers. Machine Learning 290 (2–3):131–163. doi:10.1023/A:1007465528199.
- Garcia-Laencina, P. J., J.-L. Sancho-Gómez, and A. R. Figueiras-Vidal. 2010. Pattern classification with missing data: A review. Neural Computing and Applications 190 (2):263–282. doi:10.1007/s00521-009-0295-6.
- Gheyas, I. A., and L. S. Smith. 2010. A neural network-based framework for the reconstruction of incomplete data sets. Neurocomputing 730 (16):3039–3065. doi:10.1016/j.neucom.2010.06.021.
- Honaker, J., G. King, M. Blackwell, et al. 2011. Amelia ii: A program for missing data. Journal of Statistical Software 450 (7):1–47.
- Hornik, K., C. Buchta, and A. Zeileis. 2009. Open-source machine learning: R meets Weka. Computational Statistics 240 (2):225–232. doi:10.1007/s00180-008-0119-7.
- Kim-Hung, L. 1988. Imputation using markov chains. Journal of Statistical Computation and Simulation 300 (1):57–79.
- Little, R. J. A., and D. B. Rubin. 1987. Statistical analysis with missing data. In Wiley series in probability and statistics – Applied probability and statistics section series. New York: John Wiley & Sons, Inc. ISBN 9780471802549. http://books.google.ca/books?id=w40QAQAAIAAJ.
- Liu, P., and L. Lei. 2006. Missing data treatment methods and nbi model. In Intelligent Systems Design and Applications, 2006. ISDA’06. Sixth International Conference on, vol. 1, 633–638. IEEE.
- Luengo, J., S. Garca, and F. Herrera. 2010. A study on the use of imputation methods for experimentation with radial basis function network classifiers handling missing attribute values: The good synergy between rbfns and eventcovering method. Neural Networks 230 (3):406–418. doi:10.1016/j.neunet.2009.11.014.
- Luengo, J., S. Garca, and F. Herrera. 2012. On the choice of the best imputation methods for missing values considering three groups of classification methods. Knowledge and Information Systems 320 (1):77–108. doi:10.1007/s10115-011-0424-2.
- Matsubara, E. T., R. C. Prati, G. E. A. P. A. Batista, and M. C. Monard. 2008. Missing value imputation using a semi-supervised rank aggregation approach. In Advances in artificial intelligence-SBIA, Brazilian Symposium on Artificial Intelligence, vol. 2008, 217–226. Berlin Heidelberg: Springer.
- Robitzsch, A., T. Kiefer, A. C. George, A. Uenlue, and M. A. Robitzsch. 2012. Package CDM. http://cran.r-project.org/web/packages/CDM/index.html.
- Rubin, D. B. 1987. Multiple Imputation for Nonresponse in Surveys (Wiley Series in Probability and Statistics), New York: John Wiley & Sons, Inc.
- Rubin, D. B., and J. L. Schafer. 1990. Efficiently creating multiple imputations for incomplete multivariate normal data. In Proceedings of the Statistical Computing Section of the American Statistical Association, vol. 83, 88.
- Sande, I. G. 1983. Hot-deck imputation procedures. Incomplete Data in Sample Surveys 3:334–350.
- Song, Q., M. Shepperd, X. Chen, and J. Liu. 2008. Can k-nn imputation improve the performance of c4. 5 with small software project data sets? a comparative evaluation. Journal of Systems and Software 810 (12):2361–2370. doi:10.1016/j.jss.2008.05.008.
- Stekhoven, D. J., and P. Buhlmann. 2012. Missforest-non-parametric missing value imputation for mixed-type data. Bioinformatics 280 (1):112–118. doi:10.1093/bioinformatics/btr597.
- Templ, M., A. Alfons, A. Kowarik, and B. Prantner. 2011. Vim: Visualization and imputation of missing values. R Package Version 20 (3).
- Twala, B. 2009. An empirical comparison of techniques for handling incomplete data using decision trees. Applied Artificial Intelligence 230 (5):373–405. doi:10.1080/08839510902872223.
- Van Buuren, S., and K. Oudshoorn. 1999. Flexible multivariate imputation by mice. Leiden, The Netherlands: TNO Prevention Center.
- Vapnik, V. N. 1996. Book review: The nature of statistical learning theory. Technometrics 380 (4):400–400. ISSN 00401706.
- Vomlel, J. 2002. Evidence propagation in Bayesian networks for computerized adaptive testing, Citeseer, vol. 12.
- Witten, I. H., and E. Frank. 2005. Data mining: Practical machine learning tools and techniques, In Morgan Kaufmann series in data management systems, 2nd ed. San Francisco, CA: Elsevier/Morgan Kaufmann.
Appendix A
Student’s t-test
In addition to the box plot representation illustrated in , we analyze the statistical significance of differences in prediction accuracy between using the imputation methods and directly applying the data with missing values based on paired t-tests at the 95% significance level. We use the paired t-test in which each member of one numerical set is assumed to have a unique relationship with a particular member of the other set. and report the results of two different t-test approaches.
On what datasets applying the imputation methods does not improve the accuracy?
lists the datasets on which none of the considered imputation methods can bring an improved prediction accuracy to the classifiers studied at each missing rate.
Table 6. Datasets on which none of the imputation methods improves the classification accuracy.