
ABSTRACT
Several studies have invested in machine learning classifiers to protect plants from diseases by processing leaf images. Most of the proposed classifiers are trained and evaluated with small datasets, focusing on the extraction of hand-crafted features from image to classify the leaves. In this study, we have used a large dataset compared to the state-of-the art. Here, the dataset contains 14,828 images of tomato leaves infected with nine diseases. To train our classifier, we have introduced the Convolutional Neural Network (CNN) as a learning algorithm. One of the biggest advantages of CNN is the automatic extraction of features by processing directly the raw images. To analyze the proposed deep model, we have used visualization methods to understand symptoms and to localize disease regions in leaf. The obtained results are encouraging, reaching 99.18% of accuracy, which ourperforms dramatically shallow models, and they can be used as a practical tool for farmers to protect tomato against disease.
Introduction
Tomato occupies a prominent place in the Algerian agricultural economy (Nechadi et al. Citation2002). In fact, tomato is planted on an area of 22,597 ha with a yearly production of 975,075 t (FAOSTAT Citation2016). As regards the production quantity, tomato is ranked seventh among Algerian crops after potatoes, wheat, watermelons, barley, and onions. Also, Algeria is ranked 19th among tomato-producing countries (FAOSTAT Citation2016). Despite this importance of tomato in Algerian agriculture, its production is limited to 433,424 quintals/ha (FAOSTAT Citation2016). This is very low compared to that of neighboring countries of Algeria like Morocco which has a yeild of 922.745 quintals/ha (FAOSTAT Citation2016). Diseases are often considered as one of the major limiting factors in the cultivation of tomato. Tomato crops are highly affected by diseases, which causes dramatic losses in agriculture economy (Hanssen and Lapidot Citation2012). For instance, early blight represents one of the most common diseases in the world and can cause a significant decrease in yields and many lesions in fruits (Blancard Citation2012). Likewise, late blight causes serious damages to crops, and it can be very destructive in areas with humid climate (Blancard Citation2012). Protecting tomato from diseases is crucial for improving the quantity and the quality of the crops. Thus, providing an early detection and identification of diseases is very helpful in choosing the correct treatment and stopping the disease from spreading (Al Hiary et al. Citation2011). To achieve this, the expert must have an academic training and extensive knowledge of various disciplines together, as well as experience in diseases symptoms (Blancard Citation2012), as well as a large number and diversity of the causes of diseases (Blancard Citation2012). Thus, a good practitioner needs to be informed about all symptoms and signs caused by the disease. Furthermore, farmers must monitor plants continuously, which is a tedious task. Hence, large efforts have been made to come up with a strategy that automates the classification of disease, using leaf images. The main objective of these approaches is to detect the disease in early stage in order to provide the appropriate treatment in time (Akhtar et al. Citation2013; Al Hiary et al. Citation2011; Mokhtar et al. Citation2015; Sannakki et al. Citation2013). Furthermore, these approaches are based on machine learning and computer vision to build a classifier of diseases using only images of leaves. In such classifiers, features are manually designed by experts to extract a relevant information from images (Hand-crafted features). Hence, the learning system is not fully automated because of the dependency on hand-crafted features (Breitenreiter et al. Citation2015). After the extraction of features, the classifier is trained using labeled images. Unfortunately, collecting these labeled data is very expensive, because the labeling is done manually by experts. Therefore, most of the previous reports include the use of small labeled datasets (10–800 images) to train and evaluate the accuracy of the proposed studies (Akhtar et al. Citation2013; Al Hiary et al. Citation2011; Dandawate and Kokare Citation2015; Mokhtar et al. Citation2015).
Deep learning is a new trend in machine learning and it achieves the state-of-the-art results in many research fields, such as computer vision, drug design and bioinformatics (Al Hiary et al. Citation2011). The advantage of deep learning is the ability to exploit directly raw data without using the hand-crafted features (Al Hiary et al. Citation2011; Mokhtar et al. Citation2015). Recently, the use of deep learning provided a good results in both academic and industrial fields, thanks to two main reasons (Al Hiary et al. Citation2011). Firstly, large amounts of data are generated everyday. Hence, these data can be used in order to train a deep model. Secondly, the power of computing provided by Graphics Processing Unit (GPU) and High-Performance Computing (HPC) makes possible the training of deep models and leveraging the parallelism of computing.
The aim of the present study is to introduce deep learning as an approach for classifying plant diseases, focusing on images of leaves. This study presents two main contributions in plant disease classification:
Improvement in classification pipeline using deep models: deep models have shown good results in classification and outperform the used models in machine learning. Besides, deep models have the ability to use raw data directly without feature engineering. Moreover, deep models offer the possibility of transfer learning from another task by using already trained models on larger datasets.
Detection of disease symptoms in the infected leaf: the localization of infected region in an infected leaf helps the users of the model by giving them information about the disease. Also, this biological information is extracted without the intervention of agriculture experts.
Related works
To analyze the works of the state-of-the-art, we need to give the general architecture of disease classification systems that are based on image processing. These systems contain three phases: image pre-processing, feature extraction, and classification (Akhtar et al. Citation2013).
Pre-processing
The image of a leaf is prepared using some operations. For instance, color space conversion from RGB (Red-Green-Blue) to another space is used for reducing the dependence on device(Al Hiary et al. Citation2011; Mokhtar et al. Citation2015; Prasad, Peddoju, and Ghosh Citation2016; Sannakki et al. Citation2013; Semary et al. Citation2015). Also, many works try to remove the background, focusing the analysis on the leaf (Dandawate and Kokare Citation2015; Le et al. Citation2015; Mokhtar et al. Citation2015; Sannakki et al. Citation2013; Semary et al. Citation2015). Unfortunately, removing background is difficult, and sometimes needs the intervention of the user, which decreases the automation of the system (Le et al. Citation2015).
Feature extraction
Features proposed by experts (hand-crafted features) are extracted from the image for constructing feature vectors. For example, color moments are used to extract color statistics (Semary et al. Citation2015), in which Gabor Transform (GT) and Wavelet Transform (WT) are combined (GWT) for the extraction of multiscale features (Prasad, Peddoju, and Ghosh Citation2016). Gray Level Co-occurrence Matrix (GLCM) is used in many previous works (Mokhtar et al. Citation2015; Prasad, Peddoju, and Ghosh Citation2016; Semary et al. Citation2015; Xie and He Citation2016; Xie et al. Citation2015) to extract texture features. GLCM is a 256*256 matrix where each position in the matrix counts the co-occurrences of line color and column color in the analyzed image (Dandawate and Kokare Citation2015), Scale Invariant Feature Transform (SIFT) is used to analyze the shape features of leaves.
Classification
The last phase determines which disease is present in the leaf using a classification model. This model should be trained using learning algorithms and examples with a known disease (labeled examples). The support vector machine (SVM) (Mokhtar et al. Citation2015; Semary et al. Citation2015; Dandawate and Kokare Citation2015; Raza et al. Citation2015; Schikora Citation2014), k-nearest neighbors (KNN) (Prasad, Peddoju, and Ghosh Citation2016; Xie and He Citation2016), and artificial neural network (ANN) (Al Hiary et al. Citation2011; Sannakki et al. Citation2013; Xie et al. Citation2015; Schikora Citation2014) represent the most commonly used learning algorithms in the literature. The SVM algorithm maximizes the margin between classes in linearly separable cases. Nevertheless, in the case where examples are not linearly separable, the kernel trick is used to transform examples to another space where they will be linearly separable. The KNN algorithm classifies an image by voting between the K closest examples in the features sapce. The ANN is a model organized in layers, in which each layer is connected to the next one starting from the input to output. ANN represents the old version of deep learning algorithms used in this paper.
shows the results of some recent studies in plant disease classification. These studies have two principal issues. The first one is the small number of examples in datasets (between 71 and 800). The second one is the accuracy results (), located between 89.93% and 93.79% in most cases, which is relatively low and needs to be improved. Although the accuracy of Mokhtar in (Mokhtar et al. Citation2015) is 99.83%, the used datasets contain only two classes (healthy and infected). In other words, the proposed system (Mokhtar et al. Citation2015) can detect the presence of disease in leaf, with no information about the type of this disease. In summary, the previous works are based on several pre-processing operations and hand-crafted features. The choice of pre-processing operations and features is difficult and time-consuming, which makes the classification system not fully automated. In the present paper, we propose the use of deep learning and specifically Convolutional Neural Network (CNN) as an alternative approach for building a model of disease classification. Thus, features are constructed in a fully automated way and learned from the data in the training phase. Moreover, we do not need a pre-processing phase to prepare the image and we use the raw image directly. To confirm the superiority of deep models against state-of-the-art methods, we have used a large dataset containing 14,828 images and nine diseases of tomato.
Table 1. Studies in plant disease classification.
In the rest of the paper, we present our methodology, followed by details and requirements of our approach. Finally, we give experimental results, showing the performance evaluation of our proposed approach that is based on deep models.
Methodology
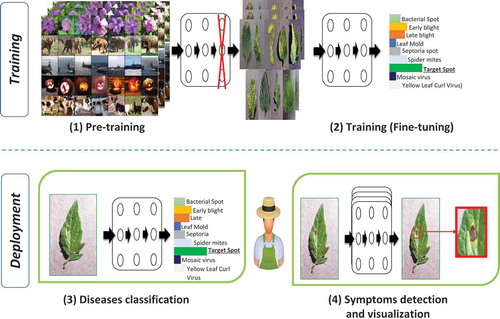
The proposed approach, illustrated in contains the four components given below:
Pre-taining phase: in this phase we train deep architectures on a large dataset like ImageNet using powerful machines. The objective of this phase is the initialization of network weights for the next phase.
Training (fine-tuning): we fine-tune the resulted network from the first phase. Also, we replace the output layer of the pre-tained networks (ImageNet contains 1000 classes) by a new output layer having nine classes (nine diseases of tomato).
Afterword, the developed deep model is deployed to users’ machines (Computers, mobiles). The deployed models can be used in two modes:
Disease classification: in this mode, the user takes a picture of a leaf and use the produced deep model to determine the disease that affects the tomato plant.
Symptom detection and visualization: after the disease classification, the user can visualize the regions of leaf image characterizing the disease (Symptoms of disease). This symptom visualization method helps the inexperienced user by giving them more information about the disease mechanism. Also, symptom visualization gives the user a tool to estimate the spread of disease in the other tomato plants.
To assess the effectiveness of these contributions, we compare the results of deep models with results of shallow models based on hand-crafted features. In this comparison, we have used two famous deep models in literature (AlexNet (Alex, Sutskever, and Hinton Citation2012) and GoogleNet (Szegedy et al. Citation2015)). Our choice of using existing deep architectures is motivated by their spectacular results in computer vision challenge ImageNet. Furthermore, these models allow us to fine-tune and transfer learning from a task where we have a large labeled dataset to plant diseases classification task. We compare our results with the ones defined by experts. To summarize, the present study includes the following three main points:
Deep models without feature extraction vs. shallow models with hand-crafted features: We compare between the performance of deep models and shallow models. This comparison is performed for validating the choice of deep models as an alternative to shallow models. Also, this comparison evaluates the impact of automated feature extraction embedded in the deep approach.
Deep models with pre-training vs. deep models without pre-training: We evaluate the performance of pre-trained models to compare them with those trained from scratch starting from a random values of network weights. This comparison aims to exhibit the influence of transfer learning from another task to disease classifications.
Symptom visualization: we use visualization methods after training stage to extract biological knowledge from models trained in a fully automatic way. This automatic knowledge extraction method can help users in understanding the plant disease and their symptoms. In other words, machine learning models of the hand-crafted features incorporate expert knowledge to facilitate classification. However, deep models can give biological knowledge extracted directly from raw data without expert help.
Figure 1. Overview of the proposed deep learning methodology.
Experiments
Pre-trained models
For building a classifier for plant diseases without hand-crafted features, we use deep learning approach, especially CNNs. CNNs are directly trained using raw images. As a result, the proposed system learns to extract features from data without the intervention of human in feature engineering. In other words, the training of the classifier includes automatic feature constructions.
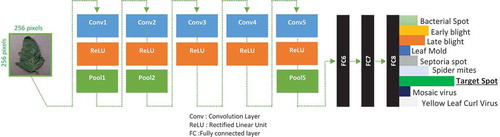
We have used two CNN models (AlexNet (Alex, Sutskever, and Hinton Citation2012) and GoogleNet (Szegedy et al. Citation2015)). These models were used previously with success in computer vision challenges like ImageNet. Our objective is to take advantage of these architectures to improve results in the diagnosis and detection of plant diseases. shows the architecture of AlexNet and the different stacked layers from the input image to the output probabilities of each disease. Input images of the network are resized to 256*256 pixels. Output results represent the probabilities of each disease. In our case, we have nine diseases (). To implement a CNN, we have used a dedicated hardware and software to accelerate the training.
Figure 2. AlexNet for tomato disease classification.
Workstation specifications and deep learning framework
We have used workstation having the specifications that are summarized in . Parallelizing deep learning is the key to accelerating the training. Therefore, GPU is crucial for minimizing the learning time to few hours. Also, if the memory of the GPU is small, we cannot use a large number of examples in each epoch of learning.
Table 2. Workstation specifications.
As a deep learning framework, we have used DIGITS proposed by NVidia. DIGITS is a friendly environment that can help researchers to test deep networks for computer vision problems. In DIGITS, many deep learning frameworks are presented to design and train networks. In our study, we use the framework Caffe proposed by Breckly. Caffe offers more options than other frameworks according to a comparative study (Bahrampour et al. Citation2015). The default learning hyperparameters of DIGITS are used in all our experiments on CNN models.
Dataset
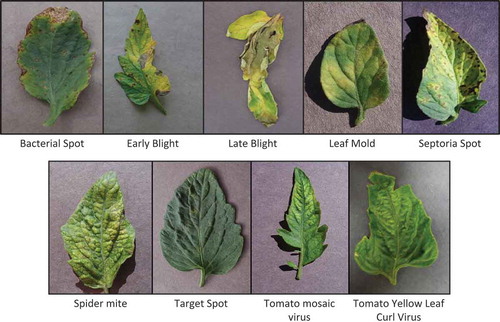
We have used a dataset recently published in (Goodfellow, Bengio, and Courville Citation2016). This dataset is an open access repository of images published online at website www.PlantVillage.org and contains more than 50,000 images of leaves. From this dataset, we extract only images of tomato leaves. and give a summary of our dataset. The total number of images in our dataset is 14,828 splitted into nine diseases.
Table 3. Dataset summary.
Figure 3. Extracted images from dataset.
Results
To measure the performance of models, we use cross-validation with five folds. We use four folds for training, and the remaining fold is used for the test. Furthermore, models like SVM and Random Forest need tuning of hyperparameters. For this reason, we have used grid search in hyperparameter spaces to find the combination of parameters that maximize the performance in validation fold (One fold selected from the training folds). gives formulas of all metrics used in our experimental tests where:
: represents the index of real (predicted) class of an image.
Table 4. Measures of classification performance.
Shallow models and hand-crafted features vs. deep models
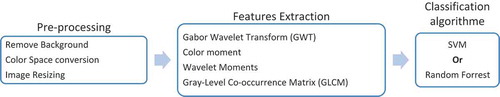
To show the effectiveness of deep learning approach, we compare the results of CNN with the state-of-the-art approach shown in . The different approaches used in the other works are based on hand-crafted features and precisely texture and color features (Al Hiary et al. Citation2011; Mokhtar et al. Citation2015; Prasad, Peddoju, and Ghosh Citation2016; Sannakki et al. Citation2013; Semary et al. Citation2015). To compare the deep model with these existing studies, we have developed a classification model according to the indicated approach in . Herein, the model uses three phases (1) Pre-processing, (2) Feature Extraction, and (3) Classification. In the pre-processing step, the background is replaced with black color to prevent the background influence on the disease detection. Also, we transform RGB color space to a device-independent color space in order to avoid the influence of camera type on images (Al Hiary et al. Citation2011; Mokhtar et al. Citation2015; Prasad, Peddoju, and Ghosh Citation2016; Sannakki et al. Citation2013; Semary et al. Citation2015). Finally, we normalize the size of all images to 256*256. In Feature Extraction, hand-crafted features used in previous works are combined to improve results. These features are extracted from color and texture (Gabor Wavelet Transform GWT (Prasad, Peddoju, and Ghosh Citation2016), Color Moment (Semary et al. Citation2015), Wavelet Moment (Semary et al. Citation2015), GLCM(Mokhtar et al. Citation2015; Semary et al. Citation2015)). As classification algorithm, two shallow models are used: SVM (Dandawate and Kokare Citation2015; Mokhtar et al. Citation2015; Raza et al. Citation2015; Semary et al. Citation2015) and Random Forrest. We have ignored classifiers having accuracy less than 90% like decision tree and KNN.
Figure 4. State-of-the-art approach in plant disease classification using leaf image.
and show that deep models (CNNs) outperform shallow models combined with hand-crafted features (SVM, Random Forrest). Indeed, the best accuracy in shallow models is 95.476 against 99.185 in deep learning. Also, Macro F value (98,518) is very high in deep models compared to Macro F value in shallow models (94.185). These results show the power of deep models in constructing good features without human expert intervention. In other words, the features constructed automatically have a better performance than hand-crafted features.
Table 5. Experimental results.
Figure 5. comparison between deep models and shallow models.
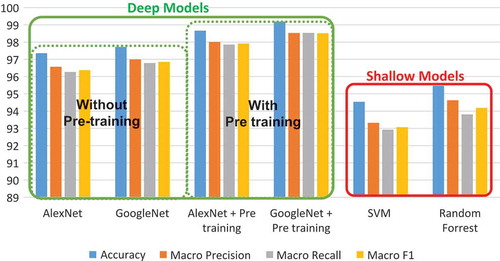
AlexNet vs. GoogleNet
The results of show that GoogleNet network overcomes the results of AlexNet in plant disease classification. Although the size of GoogleNet is small (36.6 MB) compared to AlexNet (201 MB), the results of GoogleNet are more accurate than AlexNet results. The accuracy of pre-trained GoogleNet is 99.185 and macro F1 is 98.518 while AlexNet has an accuracy equal to 98.660 and macro F = 97.911. This superiority of GoogleNet is due to the new architecture that is used in this network to increase nonlinearity without an explosion of the number of weights (Szegedy et al. Citation2015). GoogleNet uses inception module that is inspired from the architecture Network in Network proposed in (Lin, Chen, and Yan Citation2014). Inception module uses convolutions with filters one by one (1*1), leading to decreases in the depth of input volume. Moreover, the number of weights decreases, without losing much information. In other words, convolution using filters of size 1*1 plays the role of filtering information along the layers and this reduces the size of the network.
Deep models with pre-training vs. deep models without pre-training
Also from our experiments (), we observe that fine-tuning of pertained models improves the results of CNN. Indeed, fine-tuning pre-tained models improves the accuracy of GoogleNet from 97.711 to 99.185 and accuracy of AlexNet from 97.354 to 98.660. The effectiveness of fine-tuning is explained by the ability of the network to reuse and transfer learned features from one problem to another. The network learns features in one domain or a large dataset and, afterward, reuses these features in another task with a small modification, especially in the last layers. Also, fine-tuning is very suitable in cases when the number of training examples is small, and we cannot train deep models require a high number of labeled examples in training phase. In this case, we can use a model trained on a large dataset in the scale of ImageNet and train it in a dataset that contains a small number of examples. Finally, fine-tuning helps to train deep models in machines that do not have big memory in GPU. For example, our machine used in the experiments has only four GB of GPU memory and using pre-trained models in ImageNet we have reached the accuracy of 99.185 with small batches in training.
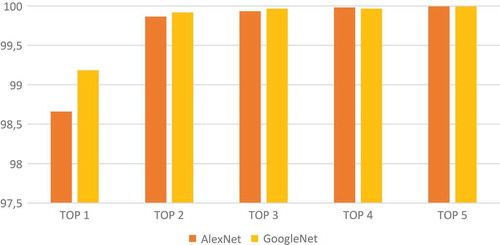
Top k accuracy
Top K accuracy evaluates the power of classifier in ordering predictions. Top K accuracy divides the number of images having the correct class in top k list of predicted classes by the number of all images. When good classifier cannot find the right class of image, it is useful to put the right class in a good position in the predictions list (sorted according to probabilities). Results presented in show that Top 5 Accuracy is close to 100. In other words, the user of the classifier can exclude four diseases from nine and focus only on five diseases with an empirical confidence equal to one. Also, the risk is not very important when the user attention is focused on the two first predictions because Top 2 accuracy is 99.864 in AlexNet and 99.918 in GoogleNet.
Figure 6. Top accuracies of deep models (k = 1, 2, 3, 4, 5).
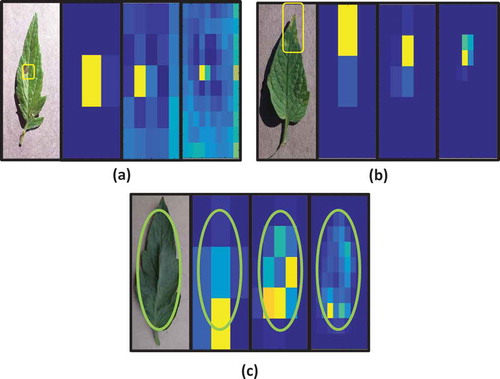
Symptoms and disease region detections using CNN
The drawback of using old neural networks is the difficulty of interpreting how it works. In deep learning, many studies proposed the visualization of learned features, in order to explain how classifier gives the final results and how features are constructed (Grün et al. Citation2016; Yosinski et al. Citation2015; Zeiler and Fergus Citation2014). In our work, the visualization of features helps users to understand the plant diseases and its symptoms. We have used the occlusion method as previously described in (Zeiler and Fergus Citation2014) to understand how network classifies the disease. We hide some part of the image and we calculate predictions of this image. If the hidden part is important, then this occlusion will decrease the probability of the correct class. However, if the occlusion does not decrease the probability of correct class, then this part does not participate in the classifier decision. Herein, we slide black rectangle over an image, and afterward, we run CNN to calculate the probability of correct classes of current image . The indexs
indicates the occlusion rectangle position in the image. Then, we visualize the negative log likelihood (
) of these probabilities using heat map. We can control the resolution of this heat map by changing the number of rectangles. For example, in there are three used resolutions 3*3, 5*5 and 10*10. The intuition behind this technique is as follows: if the probability
corresponding to occlusion rectangle
is low, then this region is important. If this region is important it will be yellow in heat map because the value of
will be high. On the other hand, if
is high then the occluded region does not affect the correctness of network output. In this case, this region is not important and the heat map becomes blue because the value of
is small. This visualization can be used by agriculture expert to identify new symptoms from analyzing heat maps. Observing the obtained heat map, the user can understand model behavior, and he can also gain some insight into disease and infected regions. For instance, in ), the gray concentric ring is used by the classifier as a symptom of Early Blight disease. To be sure, we have compared this observation with the expert-defined symptoms (Koike, Gladders, and Paulus Citation2007). Indeed, as reported by Koike et al. (Koike, Gladders, and Paulus Citation2007), gray concentric rings are described as a distinguishing characteristic of Early Blight. Also, changing resolutions in ) helps us to locate the region of disease accurately and focus on a small region. In ), a yellow region on the top of the leaf is activated in the heat map. To be sure that this region represents the symptom of leaf mold, we have consulted the website of Maine Organic Farmers and Gardeners Association and the conference of fall 2012. In this specialized association conference, they describe the symptoms of leaf mold as follows: “It shows up as yellowing on top of the leaf and, on the underside of the leaf, as a little speck of gray fuzz under each spot.” Therefore, the automated detection of leaf mold symptom is identical to an expert description. Finally, all heat maps seen in ), show that the background of leaf does not affect the results (blue color). The independence of results on the background is an excellent property of CNN. Indeed, the model focuses on leaf and ignores its background without complicated algorithm in pre-processing for removing this background.
Figure 7. Symptom visualization of CNN. (a) Early blight. (b) Leaf mold. (c) Background influenc.
Conclusion and further research
In this study, we have proposed deep learning approach to build a classifier for disease classification. Our results show that deep models and particularly CNNs outperform the previous works in tomato diseases classification. In addition, our experiments demonstrate the benefit of using pre-trained model, especially if the number of examples used in training is not very large, unlike that used in disease classification context. In this study, we have also proposed the use of occlusion techniques to localize the disease regions, helping humans to understand the disease.
In the future, our objective is to reduce the computation and the size of deep models for small machines like mobiles. Besides, visualization of features is a hot topic in deep learning, and it could be used to understand plant diseases.
Acknowledgment
We thank the computer science department (University Bachir El Ibrahimi of Bordj Bou Arreridj) for their help, particularly for providing us the powerful machines to work on. The authors thank also-Sohaib Laraba (PhD student at Numediart Institute, University of Mons, Belguim) and Hamza Achi (Engineer at Centre de Développement des Technologies Avancées (CDTA), Algeria) for the recommendations, comments and corrections that have greatly improved this paper. We would also like to show our gratitude to Billel Brahimi (Engineer graduated from Institut de Génie Electrique et Electronique IGEE, Algeria) and Khaireddine kraim (Associated professor at École normale supérieure d’enseignement technologique (ENSET), Azzaba, Algeria) for sharing their pearls of wisdom with us during the course of this research.
References
- Akhtar, A., A. Khanum, S. A. Khan, and A. Shaukat. 2013. Automated Plant Disease Analysis (APDA): Performance comparison of machine learning techniques. Proceedings of the 11th International Conference on Frontiers of Information Technology, 60–65. IEEE Computer Society, Islamabad, Pakistan.
- Al Hiary, H., S. Bani Ahmad, M. Reyalat, M. Braik, and Z. ALRahamneh. 2011. Fast and accurate detection and classification of plant diseases. International Journal of Computer Applications 17:31–38. doi:10.5120/ijca.
- Alex, K., I. Sutskever, and G. E. Hinton. 2012. Imagenet classification with deep convolutional neural networks. In Neural Information Processing Systems (NIPS),ed. F. Pereira, C. J. C. Burges, L. Bottou, and K. Q. Weinberger, Curran Associates Inc.: Lake Tahoe, Nevada, USA, 1097–105.
- Bahrampour, S., N. Ramakrishnan, L. Schott, and M. Shah. 2015. Comparative study of Caffe, Neon, Theano, and Torch for Deep Learning. ArXiv 2:1–14.
- Blancard, D. 2012. Tomato diseases. The Netherlands: Academic Press.
- Breitenreiter, A., H. Poppinga, T. U. Berlin, and F. N. Technik. 2015. Deep learning. Nature 521:2015.
- Dandawate, Y., and R. Kokare. 2015. An automated approach for classification of plant diseases towards development of futuristic decision support system in Indian perspective. Proceedings of the International Conference on Advances in Computing, Communications and Informatics (ICACCI), Kochi, India, 794–99. IEEE.
- FAOSTAT. 2016. Food and agriculture organization of the United Nations Database, Food and Agriculture Organization Corporate Statistical Database, Rome, Italy.
- Goodfellow, I., Y. Bengio, and A. Courville. 2016. Deep learning. MIT Press Cambridge, Massachusetts, London, England.
- Grün, F., C. Rupprecht, N. Navab, and F. Tombari. 2016. A taxonomy and library for visualizing learned features in convolutional neural networks. Proceedings of the Workshop on Visualization for Deep Learning at International Conference on Machine Learning (ICML), New York, USA, 48.
- Hanssen, I. M., and M. Lapidot. 2012. Major tomato viruses in the mediterranean basin. In Advances in virus research, volume 84 of advances in virus research, ed. G. Loebenstein and H. Lecoq, 31–66. Academic Press: San Diego, California, USA.
- Koike, S. T., P. Gladders, and A. O. Paulus. 2007. Vegetable diseases: A color handbook. Ed Academic Press: San Diego, California, USA.
- Le, T.-L., N.-D. Duong, V.-T. Nguyen, and H. Vu. 2015. Complex background leaf-based plant identification method based on interactive segmentation and kernel descriptor. Proceedings of the 2nd International Workshop on Environmental Multimedia. In Conjunction with ACM Conference on Multimedia Retrieval (ICMR), Shanghai, China, 3–8. ACM.
- Lin, M., Q. Chen, and S. Yan. 2014. Network in network. Arxiv Preprint Arxiv:1312.4400.
- Mokhtar, U., N. El-Bendary, A. E. Hassenian, E. Emary, M. A. Mahmoud, H. Hefny, M. F. Tolba, U. Mokhtar, A. E. Hassenian, E. Emary, and M. A. Mahmoud. 2015. SVM-Based detection of tomato leaves diseases. In Advances in intelligent systems and computing, Eds., D. Filev, J. Jablkowski, J.Kacprzyk, M. Krawczak, I. Popchev, L. Rutkowski, V. Sgurev, E. Sotirova, P. Szynkarczyk, and S. Zadrozny, Vol. 323, 641–52. Springer, Cham, Switzerland.
- Nechadi, S., F. Benddine, A. Moumen, and M. Kheddam. 2002. Etat des maladies virales de la tomate et strat{é}gie de lutte en Alg{é}rie. EPPO Bulletin 32:21–24.
- Prasad, S., S. K. Peddoju, and D. Ghosh. 2016. Multi-resolution mobile vision system for plant leaf disease diagnosis. Signal, Image and Video Processing 10:379–88. doi:10.1007/s11760-015-0751-y.
- Raza, S. E. A., G. Prince, J. P. Clarkson, and N. M. Rajpoot. 2015. Automatic detection of diseased tomato plants using thermal and stereo visible light images. Plos ONE 10:e0123262. doi:10.1371/journal.pone.0123262.
- Sannakki, S. S., V. S. Rajpurohit, V. B. Nargund, and P. Kulkarni. 2013. Diagnosis and classification of grape leaf diseases using neural networks. Proceedings of the 4th International Conference on Computing, Communications and Networking Technologies (ICCCNT), Tiruchengode, India, 3–7. IEEE.
- Schikora, A. S. M. 2014. Image-based analysis to study plant infection with human pathogens. Computational and Structural Biotechnology Journal 12:1–6. doi:10.1016/j.csbj.2014.09.010.
- Semary, N. A., A. Tharwat, E. Elhariri, and A. E. Hassanien. 2015. Fruit-based tomato grading system using features fusion and support vector machine. In Advances in intelligent systems and computing, Eds., D. Filev, J. Jablkowski, J.Kacprzyk, M. Krawczak, I. Popchev, L. Rutkowski, V. Sgurev, E. Sotirova, P. Szynkarczyk, and S. Zadrozny, Vol. 323, 401–10. Springer, Cham, Switzerland.
- Szegedy, C., W. Liu, Y. Jia, P. Sermanet, S. Reed, D. Anguelov, D. Erhan, V. Vanhoucke, and A. Rabinovich. 2015. Going deeper with convolutions. Proceedings of the IEEE Computer Society Conference on Computer Vision and Pattern Recognition, Boston, USA,7–12 June, 1–9.
- Xie, C., and Y. He. 2016. Spectrum and image texture features analysis for early blight disease detection on eggplant leaves. Sensors 16:676. doi:10.3390/s16050676.
- Xie, C., Y. Shao, X. Li, and Y. He. 2015. Detection of early blight and late blight diseases on tomato leaves using hyperspectral imaging. Scientific Reports 5:16564. doi:10.1038/srep16564.
- Yosinski, J., J. Clune, A. Nguyen, T. Fuchs, and H. Lipson. 2015. Understanding neural networks through deep visualization. International Conference on Machine Learning - Deep Learning Workshop 2015:12.
- Zeiler, M. D., and R. Fergus. 2014. Visualizing and understanding convolutional networks arXiv:1311.2901v3 [cs.CV] 28 Nov 2013. In Computer Visioneccv 2014, Vol. 8689, Eds., D. Fleet, T. Pajdla, B. Schiele, and T. Tuytelaars, 818–33. Springer, Boston, USA.