
ABSTRACT
Nowadays, the Traveling Salesman Problem (TSP) is one of the most studied combinational optimization problems that researchers study. Although it is easy to define, its solution is hard. Therefore, it is one of the NP-hard problems in the research literature. It can be used to solve real-life problems such as route planning and scheduling, and transportation and logistics applications. In this study, for TSP, an interface that can run on mobile devices using Android and IOS operating systems is developed. Real-world data are used online by the interface. Locations, and the distance between them, are obtained instantly by Google Maps APIs. Genetic (GA) and ant colony optimization (ACO) algorithms are used to solve the TSP. Furthermore, users have also been allowed to conduct trials for different parameter values. The application developed has been tested on two different datasets. The test results show that for the determination of the optimum route, the ACO algorithm is better than the GA. However, when considering the run times, GA works much faster than ACO.
Introduction
The Traveling Salesman Problem (TSP), first proposed by Eular in 1759, is quite an old problem. It was first defined mathematically by Menger (Citation1932) in the early 1930s. Nowadays, this problem is one of the most studied combinational optimization problems that researchers study. Although it is easy to define, its solution is hard. Therefore, it is one of the NP-hard problems in the research literature (Garey and Johnson Citation1979). It can be used to solve real-life problems such as route planning and scheduling, and transportation and logistics applications. Consequently, it provides an ideal test environment, especially for researchers conducting studies on optimization techniques (Johnson Citation1990).
The specific solution algorithms (dynamic programing, branch and bound, branch and cut, etc.) proposed for TSP give successful results to some extent (Applegate et al. Citation2011; Ascheuer, Fischetti, and Grötschel Citation2001; Arora, Citation1998; Held and Karp Citation1962; Johnson and McGeoch Citation1997; Miller and Pekny Citation1991). However, the problem size and execution times increase as the number of points increases, and as a result, obtaining the optimum results becomes impossible. For that reason, researchers who are studying this issue have concentrated more on heuristic and metaheuristic methods. Although they do not guarantee the optimum result, these methods can produce satisfying results because of the short running times.
A set of studies has been conducted by the researchers using different heuristic and metaheuristic algorithms for TSP. In the first group of studies, various benchmark data were used, and the experiments were performed by computers (Hingrajiya, Gupta, and Chandel Citation2012; Hlaing and Khine Citation2011; Király and Abonyi Citation2015; Li, Wang, and Song Citation2008; Mohammed Citation2013; Osaba et al. Citation2016; Silva and Runkler Citation2004). In the second group of studies, real-world data have been used and the applications have been developed for use on mobile devices (Aydin and Telceken Citation2015; Fajardo and Oppus Citation2010; Helshani Citation2015; Jana and Chattopadhyay Citation2015). The first of these applications was MyDisasterDroid, which can operate on devices using the Android operating system (Fajardo and Oppus Citation2010). This system was designed as a disaster management system for the Philippines. In case of a natural disaster, it was used to determine the optimum route so that rescue and help assistance can reach to the affected regions as effectively as possible. The distances between geographic locations were calculated by Euclidean distance, and a genetic algorithm (GA) was used to determine the optimum route. In the second application, a client–server system was developed (Helshani Citation2015). An Android application is built on the client side. The location data to be visited are determined by the Android application and sent to the server. There is GA code developed in Java on the server. The location data are processed by this code, and the optimum route is calculated using Google APIs. The route obtained is sent to the Android application built on the client side. In another study, a mobile trip planner for the city of Eskişehir was developed (Aydin and Telceken Citation2015). First, 30 points and 150 subpoints in this city were determined as the locations to be visited, and then the location data were saved to the application. The application was tested separately for two different scenarios by choosing five and 10 locations to be visited. During the test, both A* and ant colony optimization (ACO) algorithms were used to find the optimum route. The results obtained have shown that both algorithms can determine the same optimum route. In a later study, a navigation system was developed for the campus of Jadavpur University (Jana and Chattopadhyay Citation2015). It was aimed at helping students, faculty members, and staff to travel from their current location to their required destination as fast as possible. An Android application for users was developed with this aim. A web interface was also developed to update event and location data. The shortest route from users’ current location to the requested destination was calculated and sent to the user interface through the interface used by the map manager.
In this study, an interface that can operate on devices with Android and IOS operating systems has been developed for TSP. Real-world data are used online by the interface. The users can determine the locations they want to visit. The locations and the distance between them are obtained instantly by Google Maps APIs. GA and ACO algorithms are used to solve the TSP. Furthermore, users have also been allowed to conduct trials for different parameter values. The results obtained from trials can be displayed as a table and graphic for each algorithm. Furthermore, the locations, trip order, and the route can be examined on the map. The results obtained can be displayed and examined comparatively at the same time for both algorithms.
TSP
In the TSP, a salesman or a vehicle is asked to visit all the locations in the system only once by starting from a certain location and return to the initial location. In the meantime, the aim is to keep the total tour length to a minimum. In order to solve the problem, distances between all points should be known. If n is the total number of points, then for the first point, there are n – 1 alternative points to go to, and for the second point, there are n – 2 alternative points to go to. Here, n expresses the size of the problem, and the number of possible tours involved is (n – 1)! As stated previously, reaching the exact solution is possible when there are a fewer number of points. However, as the number of points increases, the number of alternative solutions increases quickly and much more time is needed to find the optimum solution. TSP is expressed mathematically as follows (Dantzig et al. Citation1954):
The objective function of the TSP is shown in Equation (1). Here, d(i, j) shows the distance between points i and j. Term x(i, j) shows whether it goes from point i to point j. Equations (2) and (3) are aimed at guaranteeing that each point will be visited only once. According to Equation (2), each point is left only once, and according to Equation (3), each point is visited only once. Equation (4) states a subtour elimination limit to prevent subtours being created. In Equation (5), the fact that x(i, j) is equal to 1 shows that there was a tour from i to j; if it is equal to 0, it means there was no tour.
In this study, assuming that a vehicle is going to be used, the distances between points are obtained by using real-world data. For this process, Google Directions and Places APIs are used. Because d(i, j) ≠ d(j, i) in asymmetric TSP (due to traveling by vehicle), distances from i to j and from j to i are calculated separately in this study as well (Zhang and Korf Citation1996). When finding the d(i, j) value, the shortest route is taken into consideration if there are more than one alternative routes from point i to point j.
Algorithms
In order to determine the optimum route between locations, GA and ACO algorithm were used in this study. The details of the GA and ACO algorithm specifically proposed for the development of this application are given in subsections.
GAs
GAs are one of the heuristic optimization algorithms applied by researchers to many problems and were first proposed by Holland (Citation1975). In this study, they have been used with real-world data for the solution of TSP on mobile devices with Android and IOS operating systems. First, the random initial population is created according to the population size determined by the user. Each gene forming the chromosomes corresponds to the points to be visited. For example, assuming that the number of points to be visited is 8, 81275463 represents an example of a chromosome. After creating the initial population, the fitness value for each chromosome is calculated. For this, data for the distance between points are used. The fitness value of each chromosome is calculated by adding distance data.
After calculating the fitness value, natural selection for the chromosomes begins. In this process, different methods are used. Because of its quite common use, a roulette wheel selection method has been chosen for this study. In natural selection, the process of the production of a new generation from the selected chromosomes is defined as “crossover.” Crossover is carried out according to the crossover rate given to the algorithm as an input. The one-point crossover method is a commonly used method, so it has been used in this study. However, for TSP, some standardization operations need to be applied after crossover, because the salesman is asked to visit all the cities only once. In the population obtained from crossover, this situation falls into decay. In this study, standardization is applied with the condition that the first repeating city in the chromosome is replaced with the unvisited city having the smallest number (see ).
Table 1. Crossover and standardization processes.
A mutation process is applied by changing the location of the genes in the randomly selected chromosomes according to the mutation rate given to the algorithm as an input by the user. Which genes will be replaced are determined randomly. After this operation, the fitness value of the population obtained is calculated, and hence the initial population is obtained for the next generation (iteration). The process continues up to the iteration number given to the algorithm as an input by the user.
ACO algorithm
The ACO algorithm was developed by Dorigo (Citation1992) in order to solve combinational optimization problems. This algorithm starts with the determination of the initial pheromone value of the routes between points. In this study, initial pheromone values for each route were taken as 10–4. The ant population should be created according to the size of the population input to the algorithm by the user. To do this, each ant should be placed randomly to the locations first. Then, Equation (6) is used to determine to which location the ant k at i location will go out of u alternative locations.
Here, τ(i, u) is the pheromone trail on the (i, u) path. The term η(i, u) = 1/δ(i, u) is the reverse of the distance from point i to point u. The term Jk(i) represents the nodes that have not yet been reached by ant k at point i. The α value (α > 0) indicates the importance of the pheromone amount of the related path, and the β value (β > 0) indicates the effect of path lengths in the selection of the next point. This parameter is entered into the algorithm as an input by the user. The term q0 (0 ≤ q0 ≤ 1) is the parameter that shows the relative importance of searching the solution space. If q > q0, the second transition rule is operated and the probability of the selection of paths to be followed is calculated according to Equation (7).
Once all the ants have completed their tour, the local pheromone is updated according to Equations (8) and (9).
Here, is the initial pheromone level, and ρ is the pheromone evaporation parameter determined by the user. The term
is the total tour length for ant k. Once all the ants have completed their tour, the global pheromone is updated. The pheromone amount on the paths followed by the ant using the shortest path is increased according to Equations (10) and (11).
is the best tour length obtained globally. These processes in the ACO algorithm are repeated until the iteration number determined by the user has been reached.
The developed interface
A large majority of the operating system market for smart mobile devices (phones, tablets, etc.) is dominated by Google Android and Apple IOS (Strategy Analytics Citation2015). Therefore, these two platforms are aimed for the applications developed. Embarcadero Delphi 10 Seattle has been used as the application development interface due to its cross-platform quality. TMS WebGMaps for FireMonkey component compatible with Delphi 10 Seattle was preferred for the use of Google Maps APIs such as Directions and Places. The SQLite database was used to store all the data entered into the application and the results obtained.
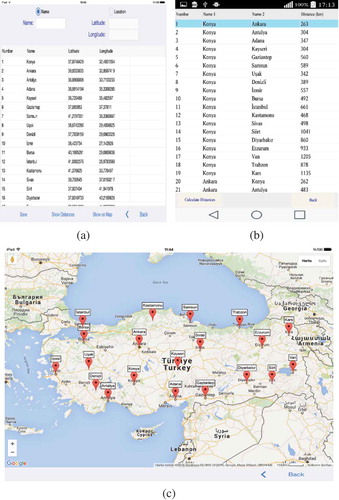
shows the main window of the developed interface. In this window, the related data-entering window will be opened if the Data Input button is clicked (). This window is used to enter location information, to show locations on the map, and to calculate the distances between these locations for TSP. As can be seen in , the location information can be entered both as a name and as a latitude–longitude. When it is entered as a name, its correspondence to a latitude–longitude is found and when it is entered as a latitude–longitude, its correspondence to a name is found using Google Places API, and then saved to the database. Moreover, the location information entered can be displayed on the map (). The distances between locations are calculated by using Google Directions API. When more than one routes are found between two locations, the shortest one is taken as the distance between these two locations. Distances between locations are calculated separately as bidirectional, because in asymmetric TSP, the distance from point i to point j can differ from the distance from point j to point i ().
Figure 1. Main window of the interface.
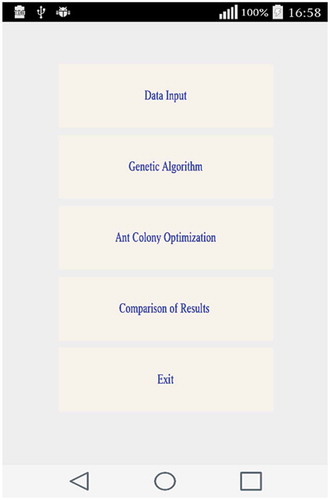
Figure 2. (a) Entering location information in the IOS operating system. (b) Listing the distance between locations in the Android operating system. (c) Showing the locations on the map in the IOS operating system.
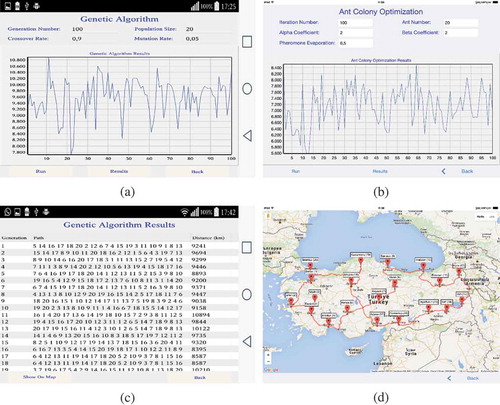
Windows providing parameter adjustment for the GA and for the ACO algorithm are shown in and , respectively. These windows are reached with the help of related buttons from the main window. After entering the parameter values, the algorithms are activated by clicking the Run button. The algorithms use the location and distance information determined by the Data Input window. The details of the algorithms were given in previous sections. The results obtained by the GA and ACO algorithm are recorded along with the parameter values, and are displayed graphically. The window showing the results related to that algorithm as a list is opened by clicking the Results button (). This window shows how much distance has been covered for which route in which iteration. Furthermore, by choosing any iteration, the route of that iteration can be displayed on the map along with the order of the locations visited ().
Figure 3. (a) GA window in the Android operating system. (b) ACO algorithm window in the IOS operating system. (c) Listing the GA results in the Android operating system. (d) Showing the ACO results on the map in the IOS operating system.
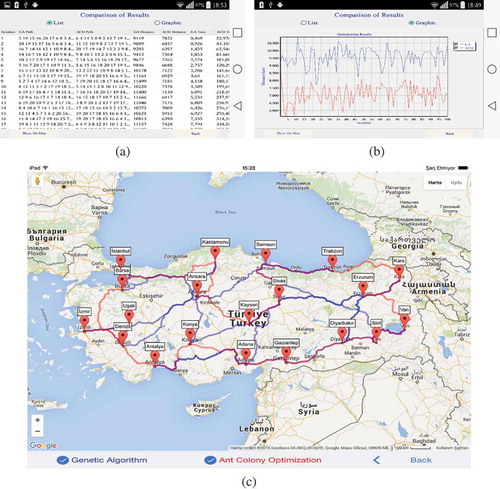
When the Comparison of Results button is selected on the interface window shown in , a window is opened where the results obtained can be compared in different ways. shows the comparison the results obtained for two algorithms in a list. The comparison is made on the basis of the route followed, distance obtained, and elapsed time for each iteration. In , the comparison between the results obtained for two algorithms is shown as a graphic. The comparison between the routes followed by two algorithms is given in . The comparison operation shown here can be created by the results obtained from each iteration (by choosing the related iteration from the list).
Figure 4. The comparison between the algorithm results obtained from the Android and IOS operating systems. (a) As a list. (b) As a graphic. (c) On the map.
Results
The developed application was tested for the solution of TSP on two mobile devices with Android and IOS operating systems. The first device is an LG G3 D855 and the other is an IPad Mini 3. The LG G3 D855 has a quad-core 2.5 GHz Krait 400 processor architecture and 3 GB RAM. It has the Android 4.4.2 KitKat operating system. The IPad Mini 3 has an ARMv8 processor architecture and 1 GB RAM and the IOS 8.0 operating system.
The application developed for the smart mobile devices was tested for two different datasets. The first dataset was formed in a way that covered seven different geographic regions of Turkey by selecting 20 different cities. In the second dataset, the districts of Konya were taken into consideration. Twenty districts were selected to be located across the entire city. shows the cities and districts in the datasets, with their locations.
Table 2. The locations of the cities and districts in the datasets.
The developed application was tested using the GA and ACO algorithm on each of the two datasets. Test operations was carried out for different iteration and population size values. The crossover rate was taken as 0.9 and the mutation rate as 0.1 for the GA. For the ACO algorithm, α and β parameters were taken as 2 and the pheromone evaporation value as 0.5. Trials were carried out separately on both mobile devices with Android and IOS operating systems. The results obtained are provided with details in and . As seen in both tables, ACO produces better results than GA regarding the length of the route. For example, using the dataset of cities for an iteration number of 100 and a population size of 50, while the result was 7588 km for GA, it was 5630 km for ACO, when the Android device was used. Similarly, using the same dataset for the same iteration number and population size, while the result was 7479 km for GA, it was 5637 km for ACO, when the IOS device was used. With regard to their elapsed time, it was observed that GA works much faster than ACO. For example, using the dataset of districts for an iteration number of 100 and a population size of 50, while the result was 198 ms for GA, it was 5074 ms for ACO, when the Android device was used. Similarly, using the same dataset for the same iteration number and population size, while the result was 47 ms for GA, it was 3568 ms for ACO, when the IOS device was used. These results show that ACO works better than GA in determining the optimum route. However, when comparing the elapsed time, the result is reversed with GA working better than ACO.
Table 3. The results obtained for the dataset of cities.
Table 4. The results obtained for the dataset of districts.
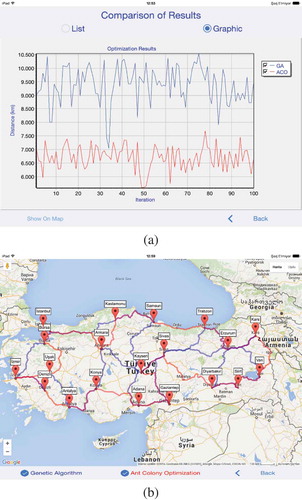
shows the graphical comparison between the results obtained for GA and ACO with an iteration number and a population size of 100, for the dataset of cities using the IOS device. For each algorithm, the comparisons of the best routes obtained are shown in .
Figure 5. (a) Graphical comparison of the results. (b) Displaying the best routes obtained on the map.
Conclusion
In this study, an interface that can operate on mobile devices with Android and IOS operating systems has been developed. Real-world data have been used online in the developed interface and locations are determined by the user. The locations and the distance between them are obtained instantly by Google Places and Directions APIs. GA and ACO are used to solve TSP. Furthermore, users have also been allowed to conduct trials for different parameter values. The results obtained from the trials can be viewed as a table or a graphic for each algorithm. Moreover, the locations can be analyzed on the map along with the order and route of the travel. The results can also be displayed and analyzed comparatively and simultaneously for both algorithms.
The application developed was tested on two different datasets. The test results show that ACO is better in determining the optimum route, and GA is better in terms of the running times.
Acknowledgments
This study is supported by Necmettin Erbakan University Scientific Research Projects Coordinatorship, Konya, Turkey. The authors would like to thank the editors and anonymous reviewers of this manuscript for their very helpful suggestions.
References
- Applegate, D. L., R. E. Bixby, V. Chvatal, and W. J. Cook. 2011. The traveling salesman problem: A computational study. Princeton University Press, 41 William Street, Princeton, New Jersey, USA.
- Arora, S. 1998. Polynomial time approximation schemes for Euclidean traveling salesman and other geometric problems. Journal of the ACM (JACM) 45 (5):753–82. doi:10.1145/290179.290180.
- Ascheuer, N., M. Fischetti, and M. Grötschel. 2001. Solving the asymmetric travelling salesman problem with time windows by branch-and-cut. Mathematical Programming 90 (3):475–506. doi:10.1007/PL00011432.
- Aydin, A., and S. Telceken. 2015. Artificial intelligence aided recommendation based mobile trip planner for Eskisehir city. In Industrial Electronics and Applications (ICIEA), Auckland, New Zealand, 15–17 June 2015, 1650–54.
- Dantzig, G., R. Fulkerson, and S. Johnson. 1954. Solution of a large-scale traveling-salesman problem. Journal of the Operations Research Society of America 2 (4):393–410. doi:10.1287/opre.2.4.393.
- Dorigo, M., 1992. Optimization, learning and natural algorithms. Ph. D. Thesis, Politecnico di Milano, Milano, Italy.
- Fajardo, J. T., and C. M. Oppus. 2010. A mobile disaster management system using the android technology. WSEAS Transactions on Communications 9 (6):343–53.
- Garey, M. R., and D. S. Johnson. 1979. Computers and intractability: A guide to the theory of NP-Completeness. New York: W. H. Freeman And Company, New York, USA.
- Held, M., and R. M. Karp. 1962. A dynamic programming approach to sequencing problems. Journal of the Society for Industrial and Applied Mathematics 10 (1):196–210. doi:10.1137/0110015.
- Helshani, L. 2015. An android application for google map navigation system, solving the travelling salesman problem, optimization throught genetic algorithm. Proceedings of FIKUSZ, 89, Óbuda University, Budapest, Hungary.
- Hingrajiya, K. H., R. K. Gupta, and G. S. Chandel. 2012. An ant colony optimization algorithm for solving travelling salesman problem. International Journal of Scientific and Research Publications 2 (8):1–6.
- Hlaing, Z. C., and M. A. Khine. 2011. Solving traveling salesman problem by using improved ant colony optimization algorithm. International Journal of Information and Education Technology 1 (5):404. doi:10.7763/IJIET.2011.V1.67.
- Holland, J. H. 1975. Adaptation in natural and artificial systems. Ann Arbor: The University of Michigan Press, London, England.
- Jana, S., and M. Chattopadhyay. 2015. An event-driven university campus navigation system on android platform. In Applications and Innovations in Mobile Computing (AIMoC), Kolkata, India, 12-14 February 2015, 182–87.
- Johnson, D. S. 1990. Local optimization and the Traveling Salesman Problem. In International Colloquium on Automata, Languages, and Programming (ICALP), England, 16–20 July 1990, 446–461.
- Johnson, D. S., and L. A. McGeoch. 1997. The traveling salesman problem: A case study in local optimization. Local Search in Combinatorial Optimization 1:215–310.
- Király, A., and J. Abonyi. 2015. Redesign of the supply of mobile mechanics based on a novel genetic optimization algorithm using Google Maps API. Engineering Applications of Artificial Intelligence 38:122–30. doi:10.1016/j.engappai.2014.10.015.
- Li, B., L. Wang, and W. Song. 2008. Ant colony optimization for the traveling salesman problem based on ants with memory. Natural Computation 7:496–501.
- Menger, K. 1932. Das botenproblem. In Ergebnisse eines Mathematischen Kolloquiums, Vol. 2. Leipzig, Germany: Teubner.
- Miller, D. L., and J. F. Pekny. 1991. Exact solution of large asymmetric traveling salesman problems. Ed., K. Menger, Science 251 (4995):754–61. doi:10.1126/science.251.4995.754.
- Mohammed, K. S. 2013. Modified ant colony optimization for solving traveling salesman problem. International Journal of Engineering & Computer Science 13 (5):1–5.
- Osaba, E., X. S. Yang, F. Diaz, P. Lopez-Garcia, and R. Carballedo. 2016. An improved discrete bat algorithm for symmetric and asymmetric Traveling Salesman Problems. Engineering Applications of Artificial Intelligence 48:59–71. doi:10.1016/j.engappai.2015.10.006.
- Silva, C. A., and T. A. Runkler. 2004. Ant colony optimization for dynamic traveling salesman problems. In ARCS Workshops, Brussels, Belgium, 22–24 September 2008, 259–66.
- Strategy Analytics. 2015. Global smartphone shipments growth slows to 15 percent in Q2 2015. July,Boston, United States, Strategy Analytics Inc.
- Zhang, W., and R. E. Korf. 1996. A study of complexity transitions on the asymmetric traveling salesman problem. Artificial Intelligence 81 (1):223–39. doi:10.1016/0004-3702(95)00054-2.