
ABSTRACT
Although mammography is typically the best method to detect breast cancer, it does not recognize 3–20% of the cancer cases. Mammography has established itself as the most efficient technique for detecting tiny cancerous tumor and micro-calcifications are the most difficult to detect since they are very small (0.1–1.0 mm) and they are almost contrasted against the images background. The main purpose of this paper is to provide a new method for the automatic diagnosis of micro-calcification in digital mammograms. It is based on image mining, and the results show 97.35% accuracy, which is improved than the previous works. Tests are based on the standard images data corpus, MIAS. The practical result of this research is registered as an invention in the Patents and Industrial Property Registration Organization numbered as 83119.
Introduction
Breast cancer is one of the most common diseases in women. Early diagnosis of the disease can be very effective in its treatment. The risk of breast cancer increases with age. Specifically, 80% of the cases occur after the age of 50. Breast cancer is initially a tiny tumor and it takes several years for a small cancerous tumor to turn into a large cancerous tumor and to affect the surrounding tissues. Early diagnosis of small tumors increases the chance of success in surgery from 27% to 98%. Since there are no symptoms in the early stages, new approaches for the early diagnosis of breast cancer and the normality and abnormality of this member are vital (Smeltzer et al. Citation2010). There are three methods for the early diagnosis of breast cancer, including examination by doctor, mammography and self-examination.
The purpose of mammographic tests is to diagnose tiny tumors. Women should have a yearly mammogram after age 40 and after age 65, and the interval between tests depends on the individuals’ situation. Mammography is the best method to diagnose very tiny tumors. Accordingly, Cancer Society of the USA recommends it for all women above 40 years old. This method has its own shortcomings and 10–30% of breast cancers are mistaken in mammography. For instance, in women under age 50, breast tissue is denser and is full of milk glands. Consequently, the detection of abnormal masses from normal tissue is more difficult. Sometimes, mammogram shows a problem that really does not exist (i.e. false positive). It causes unnecessary samplings, which in turn brings its own fear and anxiety (Zachman Citation1987).
Physicians and radiologists further manually analyze the images. Since it requires analyzing a number of images, the diagnostic process becomes tedious and hence is more prone to error. In order to minimize errors, computer-aided detection can be used to assist physicians. Therefore, computer-aided detection systems are becoming very important in medical care and can be used as a second opinion to accelerate detection, to help radiologists and mammograms. Computerized detection not only helps radiology specialists detect more accurately, but also detects the smallest malignant tumors in the early stages in young women’s breasts. With this method, the masses of 1 cm or smaller can be diagnosed in women.
On the other hand, currently, extracting knowledge from large databases has come to the attention of much recent research and applications. However, there is little research on the data mining of images. Recent advances in storage technology and achieving images have led to significant development in the images database (Zaiane et al. Citation1988). A large amount of image data is daily produced in the medical field and today medical images (Computed tomography (CT), Electroconvulsive therapy (ECT), etc.) are available to physicians as well as patients in the digital format. These images contain useful and implied information that it is difficult for users to detect.
Given the progress made in the field of image mining, its algorithms can automatically discover this information from large numbers of images. According to the definition, image mining is an extension of data mining to the image domain, which includes computer vision, image processing, image retrieval, machine learning, artificial intelligence, database, data mining, etc. In the second part, we will go through image mining in breast cancer diagnosis in mammographic images, and studies have been performed in this area. In the third part, the proposed method of this research on mammographic images will be introduced and illustrated. The fourth chapter includes conclusion and suggestions for further research.
Image mining applications in medical images
Image mining is utilized in different medical areas for initial diagnosis. Particularly, regarding the importance of the early detection of illness for immediate treatment and cure of patients, image mining is taken into consideration more than ever by physicians and specialists.
One of the critical issues in most of the image mining research is the preprocessing and feature extraction of images so that they can be offered in a way that makes the use of data mining algorithms possible. A common display is a feature vector in which each image is shown as a vector. Each vector represents a subset of the amount of features from the overall feature set.
However, it is necessary to detect image objects before the stage in which the segmentation method is utilized. Segmentation is the process of detecting important regions in an image that share common features. These areas are called Regions of Interest (ROI) that have their own special features and are locally related to each other (Pan, Jianzhong, and Zhang Citation2007).
Significant researches and successful applications are offered in the area of feature extraction to diagnose cancerous tumors, of which neural network, wavelet, genetic algorithm, etc. can be mentioned. Pan, Qilong, and Guisheng (Citation2008) applied the ROI extraction algorithm and the ROI clustering algorithm combination on medical images, implemented the association rules concept based on ROI and proposed two algorithms to discover recurring items and to extract significant association rules from medical images. Senthilkumar et al. (Citation2009) proposed a new method called ADMID (Association rule Discovery for Mammogram Image Diagnosis), which supports medical images detection using association rules. The ADMID method has a particular characteristic that makes it significant compared with other detection systems. It allows several diagnostic hypotheses to be proposed for the same image and one quality measure is used for their ranking. Despite this, the proposed method is optimized in that article because it performs two different operations of feature extraction and digitalization in one stage. This leads to the acceleration of the search algorithm and the optimization of the classification stage.
Beyer et al. (Citation1999) demonstrated that increasing the number of features would lead to missing the importance of each of the features. Hence, to avoid the loss of precision, keeping the number of features is very important. Wang, Huang, and Zhaho (Citation2007) performed preprocessing using exponential conversion function and extracted six features. Mohamed Kadah et al. (Citation2007) proposed a three-phase system including ROI extraction, feature selection and classification that included 88 extracted features. They realized that 78 of these features are able to differentiate between normality and abnormality, with an 83.3% rate. Dominguez and Nandi (Citation2007) used a three-phase system that utilized wavelet decomposition and morphology operation in the preprocessing phase. The number of extracted features is 18 in this article and the detection rate is 80%.
In many of the articles in the medical field, the clustering method is used to analyze the data. Aarthi et al. (Citation2011) employed k-means clustering and the feature extraction method and classified the resulting features from previous works using the SVM classification algorithm. The accuracy of this method was 86.11%, higher than the direct classification method, where the precision was 80%.
In another study carried out by Anitha and Peter (Citation2012), a morphologic method based on the segmentation method is used to extract features. In this method, mammographic images are preprocessed so that the breast form is extracted and its contrast is optimized. The extracted features from this method obtain the precision of 95% after classification through SVM. In another method, Sanae et al. (Citation2014) used block-base statistical features that are the subsets of the wavelet method. The resulting precision of this method through SVM classification is 96%. The objective in Malar, Kandaswamy, and Chakravarthy’s (Citation2012) paper is to reveal the effectiveness of wavelet-based tissue texture analysis for micro-calcification detection in digitized mammograms using Extreme Learning Machine (ELM). The accuracy of this method was 94%. This paper proposes a gray-level statistical matrix, from which four statistical texture features are estimated for the retrieval of mammograms from the mammographic image analysis society (MIAS) database. Using the proposed method, the highest mean precision rate obtained is 85.1%.
Abraham Chandy et al. (Citation2014) proposed a gray-level statistical matrix from which four statistical texture features are estimated for the retrieval of mammograms from the MIAS database. The highest mean precision rate obtained is 85.1%. Murali et al. (Citation2015) used the gray-level co-occurrence matrix (GLCM) method and a hybrid approach of feature selection with 95% accuracy.
Arden et al. (Citation2015) used Law’s Texture Energy Measure (LAWS) as a texture feature extraction method and artificial neural network (ANN) as a classifier for normal-abnormal and benign-malignant images. They showed that LAWS provides 93.90% accuracy for normal-abnormal and 83.30% accuracy for benign-malignant classification.
Abirami, Harikumar, and Sannasi Chakravarthy (Citation2016) developed an automatic system to classify digital mammogram images into benign or malignant images. They used an ANN-based classifier to detect the micro-calcification at each location in the mammogram images. The accuracy of this method was 93%. Kamra, Jain, and Singh (Citation2016) created a quantitative approach for the texture classification of AD based on various texture models, using the support vector machine (SVM) classifier. Using the proposed method, the highest mean precision rate obtained was 95.34%. What distinguishes each of these above-mentioned methods in cancer detection is the detection precision of the algorithms in mammographic images. One of the effective factors on increasing or decreasing precision is the type of image and its extracted feature. Cancerous tumors are usually hidden in fatty tissues of the breast and this will interrupt the process of diagnosis. Therefore, a suitable filter seems necessary. Furthermore, it is important to choose an optimized method and algorithm to extract features from mammographic images and, consequently, the type of classification of these features. Tests performed on MIAS images in this article show that this procedure is considerably enhanced in resulting precision compared with the other samples.
Materials and methods
In this research, to achieve a suitable level of precision and diagnosis, all three phases of image-quality optimization, features extraction and classification are carefully performed. The Contrast-limited Adaptive Histogram Equalization (CLAHE) filter is used to increase the contrast of mammographic images, GLCM is employed to extract effective features from breast images, and radial basis function (RBF) SVM is used to classify the features. The overall design of this research is presented in .
Figure 1. Structure of the proposed technique.
Preprocessing and optimization of image quality
Raw data usually suffer from noise, bios and radical changes in dynamic interval sampling. Using them in these conditions would weaken the subsequent sketches. Preprocessing includes complex transformations that are employed to reduce the size of data. In brief, preprocessing includes all changes on raw data that make it more effective and uncomplicated for subsequent processing like classification. There are various tools and methods for preprocessing, such as normalization, in which data converts data to new data with suitable distribution, and dimension reduction, in which repetitive, redundant, or unrelated data are deleted.
Interpretation and understanding of mammographic images are difficult. In some cases, they have redundant parts that make diagnosis difficult. To simplify, improve image quality and make the feature extraction stage trustable, preprocessing seems essential. Tumors are usually embedded in breast tissues, as a result of which the accuracy of diagnosis decreases.
Cutting and removal of redundant data
Owing to the large size of mammographic images and the large amount of calculations necessary to determine the location of damages and tissues of the patient, it is time-consuming to diagnose in all levels of mammography. Hence, decreasing the desired regions without losing valuable data would be helpful in precision, speed and load of computations. This method is used to cut the black spaces of the image as well as artifacts like written tags. About 50% of the images, including black backgrounds with significant noises, are deleted. shows the mammographic images after the cutting operation. Cutting is performed before quality enhancement to avoid increasing noises. In this research, the CLAHE filter is used to improve image quality.
Figure 2. (a) The original mammogram image, (b) cropped image and (c) image filtered with CLAHE.
CLAHE filter
The CLAHE filter reduces noise in similar and parallel regions. CLAHE operates on a small region in the image, which is called tile, and increases the contrast in each tile.
This method includes three parameters.
Block Size: the size of the local region around a pixel should be such that its histogram is diminished. This size should be bigger than the size of the features kept.
Histogram Bins: it is used to equalize and balance the histogram. Internal elements work with byte clarity. Accordingly, a number more than 256 is not meaningful. This amount restricts the outgoing amount when processing 8-bit gray or 24-bit RGB images. The number of histogram bins must be less than the pixels of a block.
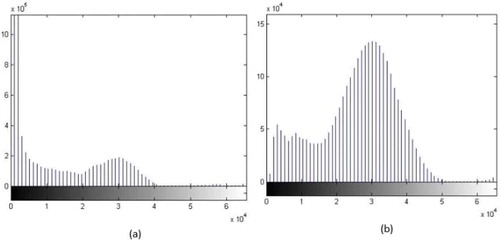
Max slop: this limits contrast expansion in the transfer function. Very large amounts allow the histogram equalization function to do what it wants to do and this results in maximum local contrast. shows a sample of the mammographic image after preprocessing, including cutting and filtering. illustrates the image’s histogram diagram before and after applying CLAHE filters on the MIAS images. The filter was tested in different numerical intervals and at the best condition, the set presented in was used. Histogram graphs of mammographic images in two conditions of before and after applying filter are presented in . The graphs show that applying the CLAHE filter improved and increased the contrast of images.
Table 1. Initializes CLAHE.
Figure 3. (a) The histogram chart of the original mammogram image. (b) The histogram chart of the CLAHE image.
Extraction and reduction of the number of images’ features
The features must be properly selected because they represent the most relevant information on an image to fully describe a tumor. The methodology for the extraction analyzes objects and images to extract the features representing various classes of objects. In this method, features are extracted from image texture. Texture of an image is an important part of the image, which reveals a pattern of information or sequence of structures in an image. The texture form is a type of visual features that is not based on the color or brightness intensity of the pixels; it reflects the natural phenomenon of images. For this reason, texture forms have been widely used in image processing. Many of the objects in an image are diagnosed alone by their textures with no other information. There is no comprehensive definition for texture. Texture may include some of the basic principles and may also describe the structure of a region and the relationship of the surrounding area. Using texture analysis, considerable features of the image can be extracted. Various techniques are used to measure texture such as Co-occurrence Matrix, Fractals, Gabor Filters, etc. Identification of specific textures in an image is primarily carried out via texture modeling as a two-dimensional gray-level modification.
The two-dimensional array is called GLCM. GLCM calculates the number recurrence of a pair of pixels within the image based on the distance and specific spatial angle determined between them. In general, the four angles of 0, 45, 90 and 135 are used to extract texture features in the classification of GLCM, which are used for classification as well. A sample of the extracted features from the tissue of an image is presented in . A total of 21 features are extracted from the images, which are carried out by the GLCM algorithm.
Table 2. Features identified by GLCM on MIAS images.
Features classification
In this part, extracted features from the GLCM method and mammographic images’ tissues are classified via the SVM method. In fact, SVM is a binary classifier that separates two classes using a linear border. In this method, instances that represent classes’ borders are obtained by an optimization algorithm. These instances are called support vector. A number of training points that are making the least distance to the decision-making border can be considered as a subset to define the decision-making borders and as a support vector. represents two classes and the related support vectors.
Imagine data comprise two classes and classes include xi training points and , where
is a vector. These two classes are tagged with
. In order to calculate the decision-making border of two completely separate classes, the improved margins method is employed (Vapnik and Chervonenkis Citation1998). In this method, the linear border is calculated in such a way that:
All +1 class samples are on one side of the border and all −1 class samples are on the other side of the border.
The decision-making border is in such a way that the distance between the nearest border training samples of each class, in the direction perpendicular to the decision-making border, is as wide as possible.
A linear decision-making border can be calculated as
where is a point on the decision-making border;
is the next
vector perpendicular to the decision-making border;
is the distance between the origin and the decision-making border; and
represents the inner product of the two vectors. As Formula 2 is still balanced if multiplied by a constant, the following conditions are applied on them to define the unique value of
and
:
In a more general sense, whenever it is not possible to linearly separate data, a nonlinear conversion is used for mapping data-vector to a higher dimensional space (feature space). To avoid over-fitting error resulting from transition to a higher space, SVM utilizes a kernel function in which nonlinear mapping is implicitly isolated (Vapnik Citation1998).
The SVM classifier follows the following formula:
where is the kernel function,
represents the support vector obtained from the training points,
is the number of support vectors,
is the number of related
class and
are constants obtained in the training stage. According to the definition, support vectors are elements of training data that are actually classified on or within the decisions-making borders. In other words, these vectors include instances that are classified with great difficulty compared with the other instances. It must be noted that in an issue of SVM, only a small fraction of the training data is determined as support vectors. Kernel functions play a central role in mapping the incoming vector curve to the feature space with a larger size to obtain a higher resolution. In this paper, the RBF radial Gaussian kernel is used, which is shown by Formula 4.
is known as the Square Euclidean distance between two feature vectors and
is a constant, which defines the kernel width and is one of the most widely used kernels for SVM.
Experimental results
In this part, the proposed algorithm’s results are discussed, compared with the feature extraction algorithm’s sample and classified. The above-mentioned algorithm is worked on a core computer with 3.10 GHz speed and 1 GB RAM. Images utilized in this research are from MIAS. The format of MIAS pictures is LJPEG42.
After implementing the proposed method, the results of this research are presented on the MIAS database in this part to improve the image quality and increase the diagnosis precision. The format of the images was modified into usual digital images format via Linux-based DDSM-Software designed by Dr. Chris Rose in Oxford Manchester University as a laboratory project. The modified images have 4828*2279 pixels with suitable resolution and quality. The CLAHE filter is used to increase the image contrast; subsequently, GLCM is employed to extract effective features from the mammographic images’ texture, and finally RBF SVM is used for classification.
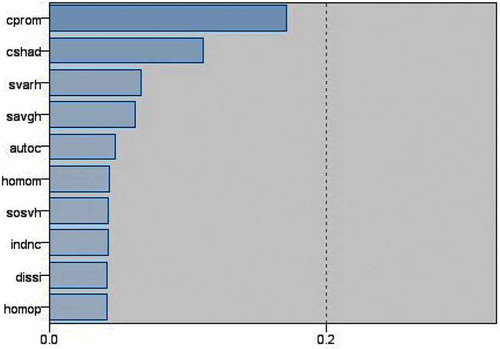
and represent those features having the maximum effect on classification. As observed, Cluster Prominence has the maximum effect in this classification.
Table 3. Variables from that had the greatest impact on the diagnosis and classification of a cancer image.
Figure 4. Cloud level with maximum separating border along with separating borders, for classification of the data samples into two different classes.
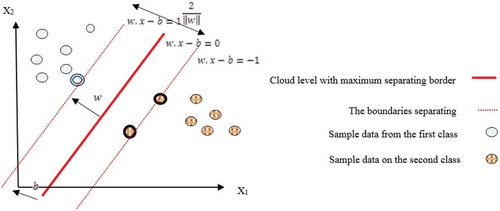
Figure 5. Variables from that had the greatest impact on the diagnosis and classification.
To evaluate the model by previous methods, precision in the classification method has been considered and investigated.
The results can be observed in . From among 151 mammographic images from the MIAS database, 147 were precisely classified whereas there were four mistakes in diagnosis.
Table 4. Results obtained by our method.
shows the confusion matrix of this research. In this case, out of 52 cancer images, 48 were exactly diagnosed. Furthermore, four images were diagnosed as benign by mistake. Images of the benign and normal classes were properly diagnosed.
Table 5. Confusion matrix.
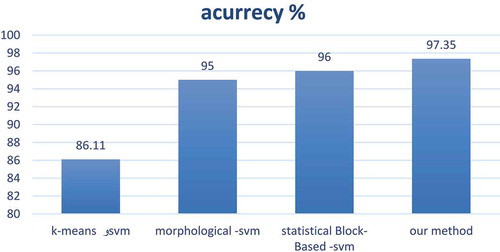
The results of this research are compared to previous related works in . Employing the CLAHE filter and the classification of the extracted features via the GLCM method using the SVM algorithm resulted in better diagnosis precision compared with similar cases.
Figure 6. The new method proposed compared with other similar methods.
Conclusion and discussion
Mammography is one of the best methods in detecting breast cancer. However, in some cases, radiologists encounter problems in managing tumors. Detection of breast cancer via computer (Computer-Aided Detection) is one of the issues that come to the interest of researchers. The main purpose of this paper is offering a new method to automatically diagnose small cancerous textures in mammographic images. In this research, special attention is paid to the three stages of image-quality improvement, feature extraction and classification to obtain a suitable level of diagnosis and precision. A new method is used for implementation. Cancerous textures are classified into three classes of normal, benign and malignant. The obtained precision is 97.35% in this method, which is significantly improved compared with the previous methods. The practical result of this research is registered as an invention in the Patents and Industrial Property Registration Organization of Iran numbered as 83119. It is hoped that in the long term, fully automated systems of image recognition can be created; the huge visual databases can analyze images synchronously and online, subsequently helping physicians and radiologists diagnose illness in the early stages. It is hoped that despite the scientific using of the results of this research, effort is also made to improve the method’s accuracy on small tumors.
References
- Abirami, C., R. Harikumar, and S. R. Sannasi Chakravarthy. 2016. Performance analysis and detection of micro calcification in digital mammograms using wavelet feature. International Conference on Wireless Communications, Signal Processing and Networking (WiSPNET), 23–25. doi:10.1109/WiSPNET.2016.7566558.
- Abraham, D., S. Stanly Johson, and S. Selvan. 2014. Texture feature extraction using gray level statistical matrix for content-based mammogram retrieval. Multimedia Tools and Applications 2011–24. doi:10.1007/s11042-013-1511-z.
- Anitha, J., and J. D. Peter 2012. A wavelet based morphological mass detection and classification in mammograms. International Conference on Machine Vision and Image Processing (MVIP), 25–28. doi:10.1109/MVIP.2012.6428752.
- Arden, S. S., W. Julian, and Y. Purnama 2015. Mammogram classification using Law’s Texture energy measure and neural networks. International Conference on Computer Science and Computational Intelligence(ICCSCI), 92–97. Jakarta, Indonesia.
- Aarthi, R., K. Divyana, N. Komala, and S. Kavitha 2011. Application of feature extraction and clustering in mammogram classification using support vector machine. Third International Conference on Advanced Computing (ICoAC), pp. 62–67. doi: 10.1109/ICoAC.2011.6165150.
- Beyer, K., J. Goldstein, R. Ramakrishnan, and U. Shaft 1999. When is nearest neighbor meaningful. In Proceedings of International Conference, Database Theory (ICDT). pp. 217–35. Jerusalem, Israel.
- Dominguez, A. R., and A. K. Nandi 2007. Enhanced multi-level thresholding segmentation and rank based region selection for detection of masses in mammograms. IEEE International Conference on Acoustics, Speech and Signal Processing, I-449–I-452. doi: 10.1109/ICASSP.2007.366713.
- Kadah, Y. M., and M. Wael. 2007. Computer aided diagnosis of digital mammograms. International Conference on Computer Engineering & Systems, 299–303. doi: 10.1109/ICCES.2007.4447063.
- Kamra, A., V. K. Jain, and S. Singh. 2016. Characterization of architectural distortion in mammograms based on texture analysis using support vector machine classifier with clinical evaluation. Journal of Digital Imaging 104–14. doi:10.1007/s10278-015-9807-3.
- Malar, E., D. Kandaswamy, and A. Chakravarthy. 2012. A novel approach for detection and classification of mammographic microcalcifications using wavelet analysis and extreme learning machine. Computers in Biology and Medicine 898–905. doi:10.1016/j.compbiomed.2012.07.001.
- Murali, S., and K. P. Sathee. 2015. Multiclass classification of mammogram images with GLCM features. International Journal of Engineering Research and Science& Technology 56–62:2319–5991.
- Pan, H., L. I. Jianzhong, and W. Zhang. 2007. Incorporating domain knowledge into medical image clustering. Applied Mathematics and Computation 844–56. doi:10.1016/j.amc.2006.06.083.
- Pan, H., H. Qilong, and Y. Guisheng 2008. A ROI-based mining method with medical domain knowledge guidance. International Conference on Internet Computing in Science and Engineering, pp. 91–97. doi: 10.1109/ICICSE.2008.91.
- Sanae, B., S. Elmargae, M. AtiKerroum, and Y. Fakhri 2014. Statistical block-based DWT features for digital mammograms classification. In 9th International Conference on Intelligent Systems: Theories and Applications (SITA-14), pp. 1–7. doi: 10.1109/SITA.2014.6847307.
- Senthilkumar, J., J. K. Kavitha, D. Manjula, and R. Krishnamoorthy 2009. ADMID: An association rule discovery for mammogram image diagnosis. 22nd IEEE International Symposium on Computer-Based Medical Systems, pp. 1–8. doi: 10.1109/CBMS.2009.5255419.
- Smeltzer, S. C., B. G. Bare, J. L. Hinkle, and K. H. Cheever. 2010. Textbook of medical-surgical nursing. Philadelphia, United State: Lippincott William&Wilkins.
- Vapnik, V. 1998. Statistical learning theory, 1st ed. Hoboken, United State: Wiley-Interscience.
- Vapnik, V., and A. Chervonenkis. 1998. The necessary and sufficient conditions for consistency in the empirical risk minimization method. In Pattern recognition and image analysis, ed. Yuri I. Zhuravlev, pp. 283–305. Germany: Springer.
- Wael, M., and Y. M. Kadah 2007. Computer aided diagnosis of digital mammograms. International Conference on Computer Engineering & Systems. pp. 299–303. doi: 10.1109/ICCES.2007.4447063.
- Wang, H., L. L. Huang, and X. J. Zhaho 2007. Automated detection of masses in digital mammograms based on pyramid. International Conference on Wavelet Analysis and Pattern Recognition, pp. 183–87. doi: 10.1109/ICWAPR.2007.4420660.
- Zachman, J. A. 1987. A framework for information systems architecture. IBM SystemsJournal 276–92. doi:10.1147/sj.263.0276.
- Zaiane, O., J. Han, Z. Li, and J. Hou 1988. Mining multimedia data. CASCON ‘98 Proceedings of the 1998conference of the Centre for Advanced Studies on Collaborative research, Toronto, pp. 24–36.