
ABSTRACT
Most of the current computer systems authenticate a user’s identity only at the point of entry to the system (i.e., login). However, an effective authentication system includes continuous or frequent monitoring of the identity of a user already logged into a system to ensure the validity of the identity of the user throughout a session. Such a system is called a “continuous or active authentication system.” An authentication system equipped with such a security mechanism protects the system against certain attacks including session hijacking that can be performed later by a malicious user. The aim of this research is to advance the state-of-the-art of the user-active authentication research using keystroke dynamics. Through this research, we assess the performance and influence of various keystroke features on keystroke dynamics authentication systems. In particular, we investigate the performance of keystroke features on a subset of most frequently used English words. The performance of four features including key duration, flight time latency, diagraph time latency, and word total time duration are analyzed. A series of experiments is performed to measure the performance of each feature individually as well as the results from the combinations of these features. More specifically, four machine learning techniques are adapted for the purpose of assessing keystroke authentication schemes. The selected classification methods are Support Vector Machine (SVM), Linear Discriminate Classifier (LDC), K-Nearest Neighbors (K-NN), and Naive Bayesian (NB). Moreover, this research proposes a novel approach based on sequential change-point methods for early detection of an imposter in computer authentication without the needs for any modeling of users in advance, that is, no need for a-priori information regarding changes. The proposed approach based on sequential change-point methods provides the ability to detect the impostor in early stages of attacks. The study is performed and evaluated based on data collected for 28 users. The experimental results indicate that the word total time feature offers the best performance result among all four keystroke features, followed by diagraph time latency. Furthermore, the results of the experiments also show that the combination of features enhances the performance accuracy. In addition, the nearest neighbor method performs the best among the four machine learning techniques.
Introduction
Traditionally, the combination of username and password security scheme has been the mainly used authentication method to control access to sensitive and important resource particularly in computer security and related fields. A legitimate user claims an identity by providing her user name and then proves the ownership of the claimed identity by providing a password. However, these traditional protection mechanisms that relay on using passwords are less satisfactory and vulnerable to many threats, for example, to be stolen. As indicated by the 2002 NTA Monitor Password Survey (NTA Citation2002), a study conducted on 500 users demonstrates that every user has approximately 21 passwords of which 81% employ regular regime in protecting password while 30% write their passwords down or store them in a file. According to a study published in 2007, the average user has 6.5 passwords, each of which is shared across 3.9 different sites (Florencio and Herley Citation2007). The same study reports that each user has about 25 accounts that require passwords, and types an average of eight passwords per day. These traditional authentication mechanisms that relay on using usernames and passwords only verify user’s identity at the point of entry to the system (i.e., login). However, an effective authentication system includes continuous or frequent monitoring of the identity of a user to ensure the valid identity of the user throughout a session. Such a monitoring system is called a continuous or active authentication system. An authentication system with such security scheme protects against certain attacks such as session hijacking that can be conducted by a malicious user. There are numerous conceivable applications and scenarios that require employing continuous monitoring approach to authentication. For instance, consider a student who takes online quizzes/tests. This is an important application in the light of the fact that the number of students taking online classes is increasing and teachers are getting more concerned about true assessment and academic integrity. Threats in this case include substitution of the legitimate and valid student who is already authenticated at the start of the exam. For another example, consider an employee who works for an organization. In this case, threats include an insider intruder who can takes over an active session on a computer that is left unattended.
Recently, keystroke analysis has acquired its popularity as one of the main approaches in behavioral biometrics techniques that can be used for continuously authenticating user. There are several advantages when applying keystroke analysis: First, keystroke dynamics are practical, since every user of a computer types on a keyboard. Second, keystroke analysis is inexpensive because it does not require any additional components (such as special video cameras) to sample the corresponding biometric feature. Third and most importantly, typing rhythms can be still available even after the authentication stage has been passed.
A major challenge in keystroke analysis is the identification of the major factors that influence the performance accuracy of the keystroke authentication detector. Two of the most influential factors that may impact the performance accuracy of the keystroke authentication detector include the classifier employed and the choice of features (Killourhy and Maxion Citation2010).
Currently, there is insufficient research that addresses the impact of these factors in continuous authentication analysis. The majority of exciting studies in keystroke analysis focuses primarily on the impact of these factors in the static authentication analysis. Understanding the impact of these factors will contribute to the improvement of continuous authentication keystroke-based system performance. Furthermore, most of the existing schemes of keystroke analysis require having predefined typing models either for legitimate users or impostors. However, it is difficult or even impossible in some situations to have typing data of the users (legitimate or impostors) in advance.
The intention that forms the basis of this research is to improve continuous keystroke biometrics user authentication systems designed to detect malicious activity caused by another person (impostor) who intends to take over the active session of a valid user. The major contribution of this research is the utilization of most frequently used English words in deciding about identify of users when typing. Our keystroke authentication scheme captures necessary features such as latencies and duration times to determine which timing feature performs better in keystroke dynamics. Another important contribution of this research includes proposing a novel approach based on sequential change-point methods for early detection of an imposter in computer authentication. There are two main advantages of using sequential change-point methods. First, they can be implemented online, and hence, enable building the continuous user authentication systems without any needs for any prior user model in advance. More specifically, sequential change-point tests do not require any a-priori information regarding both process and change (Alippi et al. Citation2011). Second, these techniques minimize the average delay of attack detection while maintaining an acceptable detection accuracy rate.
The remainder of this paper is organized as follows. Section 2 highlights the motivation and the contributions of this paper. An overview of keystroke analysis is given in Section 3. Section 4 presents the research objectives and the research questions. Section 5 describes our experiment procedure, data capture, feature extraction, and classification techniques employed. The experimental results are represented in Section 6. Section 7 introduces a change point detection approach to keystroke dynamics, its experiments and their obtained results. Section 8 provides a literature review of keystroke analyses. Section 9 presents the conclusions and future work.
Motivation and contribution
When a user types on a keyboard two main events occur: 1) the key down event, when the user pressing a key, and 2) the key up event, when the user releases a key. Timestamps of each event are usually recorded to keep track of the time period of pressing or releasing a key.
A variety of timing features can then be extracted from this timing information. Two of the most used features are: 1) duration of the key, which is the time the key is held down, and 2) keystroke latency, which is the time between two successive keystrokes. It is also possible to capture other keystroke dynamics information, such as the time it takes to write a word, two letters (digraph) or three letters (tri-graph).
Features are one of the most important factors that may influence the effectiveness and error rates of keystroke-dynamic detectors (Killourhy and Maxion Citation2010). The process of feature selection plays a critical role in improving the performance when designing keystroke dynamic detectors. Ashbourn states that the classification accuracy is substantially influenced by the feature selection process and to a lesser extent on the authentication algorithm employed (Ashbourn Citation2000). Also, a recent survey of keystroke dynamics perceives that certain features have a tendency to be more helpful than others (Banerjee and Woodard Citation2012).
Extant literature on keystroke dynamics demonstrates conflicting results regarding which feature is the most effective timing feature in terms of distinguishing between users in keystroke dynamics domain. Experiments show that hold times are much more important than latency times (Robinson et al. Citation1998; Tech, Yue, and Teoh Citation2012). It is also observed that using tri-graph time offered better classification results than using digraphs or higher order n-graphs (Bergadano, Gunetti, and Picardi Citation2002). Revett et al. also reported that the digraph and tri-graph times were more effective compared to the hold time and time of flight (Revett et al. Citation2007). Accordingly, recent studies combine more than one of these features (Ara´Ujo et al. Citation2004; Tech, Yue, and Teoh Citation2012). Research has found that use of all three types of features (i.e., hold times, digraph times, and flight times) produces better results (Ara´Ujo et al. Citation2004). In contrast, it has also been reported that, when hold times and either digraph times or flight times are included, the particular combination has a trivial effect (Tech, Yue, and Teoh Citation2012).
Another observation taken from the literature on keystroke dynamics is that existing schemes use some features (i.e., hold times, digraph times, and flight times) from static authentication keyboard-based systems to represent user typing behavior in continuous authentication keyboard-based systems. These features can be used in the static authentication keyboard-based systems for successful user authentication. However, these features may not guarantee strong statistical significance in continuous authentication keyboard-based systems. Hence, better informative timing features must be added to the extant literature to guarantee successful distinguishing between users in continuous authentication keyboard-based systems.
From a different point of view, another important conclusion that can be drawn from the existing literature of keystroke dynamics is that most of the existing schemes require having predefined typing models either for legitimate users or impostors. It is difficult or even impossible in some situations to have typing data of the users (legitimate or impostors) in advance. For instance, consider a personal computer that a user carries to a college or to a cafe. In this case, only the computer owner (legitimate user) is known in advance. For another instance, consider a computer that has a guest account in a public library; in this case, none of the system users are known in advance. Thus, a new automated and flexible technique that has the ability to authenticate the user without the need for any prior user-typing model is needed.
This paper assesses the performance and influence of various keystroke features on keystroke dynamics authentication systems. In particular, we investigate the performance of keystroke features on a subset of most frequently used English words. The paper analyzes the effectiveness and performance of keystroke dynamics with respect to four features namely: (1) key duration, (2) flight time latency, (3) diagraph time latency, and (4) word total time duration. In addition to measuring the performance of each feature separately, we also capture the effectiveness of the keystroke dynamics on combination of various subsets of these features. Moreover, this paper introduces a novel approach based on sequential change-point techniques for early detection of anomaly in an online active authentication system. The key contributions of this paper are as follows:
Introduction of new features useful in distinguishing users in continuous authentication systems based on keystroke dynamics. The new features are based on the utilization of the most frequently used English vocabularies to ascertain identify of the users typing on a keyboard.
Introduction of a new anomaly detection approach based on sequential change-point methods for early detection of attacks in computer authentication. The developed algorithms are self-learning, which allow the construction of continuous keystroke authentication systems without the need for any a-priori regarding the user-typing model in advance.
Extraction of various types of keystroke features and determination of the most important features in the keystroke dynamics problem. In particular, the performance of four features such as i) key duration, ii) flight time latency, iii) digraph time latency, and iv) word total time duration are extracted and analyzed in order to find which one among these four features performs better in keystroke dynamics.
Investigation of the possibility of improving the performance of the keystroke continuous authentication system by building various models by combining the extracted keystroke features. In particular, this research compares the independent performances of four keystroke features, including i) key duration, ii) flight time latency, iii) digraph time latency, and iv) word total time duration against ten different combinations of these keystroke features.
Introduction and comparison of the performance of several machine learning-based anomaly detection techniques in terms of their ability to distinguish users in continuous authentication systems. In particular, four machine learning techniques are adapted for keystroke authentication in this paper: Support Vector Machine (SVM), Linear Discriminate Classifier (LDC), K-Nearest Neighbors (K-NN), and Naive Bayesian (NB).
An overview of keystroke dynamics
Keystroke dynamics are defined as “a behavioral biometric characteristic, which involves analyzing a computer user’s habitual typing pattern when interacting with a computer keyboard” (Monrose and Rubin Citation2000). There are several advantages of using Keystroke Dynamics (Gunetti and Picardi Citation2005): First, keystroke dynamics are practical and feasible, since every computer user types on a keyboard; second, it is inexpensive due to the fact that it does not require any additional or special tools or components; thirdly, typing rhythms can be still available even after the authentication phase has passed.
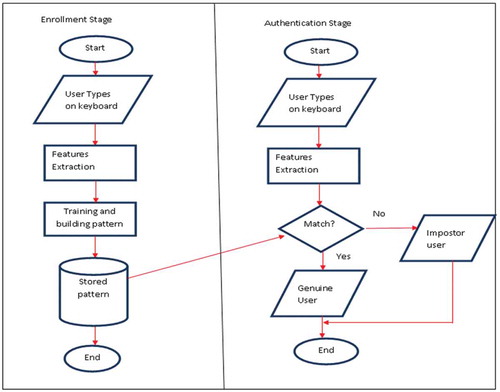
A keystroke authentication system consists of two phases: the training or enrollment phase, which includes capturing typing data, filtering, feature extraction, and pattern learning to build a model representing legitimate users; and the verification phase, which includes capturing data typed, filtering, feature extraction, and performing the comparison with the biometric pattern. The main scheme for the keystroke dynamics system as technically described by Giot, El-Abed, and Rosenberger (Citation2011) is pictured in . A user types on the keyboard and the timing of typing features is extracted and compared with the user’s stored typing pattern by the matcher. The matcher decides whether the current user is a legitimate user.
Figure 1. The basic keystroke dynamics training or enrollment in authentication schemes as described by (Giot et al. Citation2011).
Static and dynamic authentication systems
Keystroke analysis techniques can be primarily classified into two main categories: static and dynamic (also known as continuous or active) analysis. Static analysis means that the analysis is executed at certain points in the system (i.e., at log-in time). This type of analysis ordinarily involves short typing samples such as those which might be seen at log-in time. For example, user IDs, passwords, names, and/or passes phrases. This method is often used to add additional layer of security to the system and to address some limitations inherent in the traditional authentication techniques such as when the password is stolen by another person.
With such a security scheme enforced during an authentication process (at log-in time), the verification system attempts to verify two aspects of the user: first, is the user credential correct? Second, is the manner of typing the password similar to the user profile? Therefore, if an attacker was able to steal the user’s credentials, he/she will be denied by the verification system because he/she will not type in the same manner as the legitimate user.
With a static security scheme, the authentication process is statically performed only at the point of entry to the system (i.e., log-in). However, an effective authentication system continuously verifies the identity of a user by gathering data typed throughout the user’s session to ensure the valid identity of the user. An authentication system with such a security scheme can be robust against certain attacks, such as session hijacking performed later by a malicious user.
In contrast to static analysis, dynamic analysis includes continuous or frequent monitoring of a user’s keystroke typing behavior. It is first checked during the log-in session and continues after the initial authentication. In this case, larger typing samples, that is, training data, are usually necessary in order to build an individual model. Typing samples can be collected directly, by requiring individuals to type some predefined long fixed or dynamic text several times, or indirectly, by monitoring their keystroke activities (e.g., when they are writing emails and using word processing).
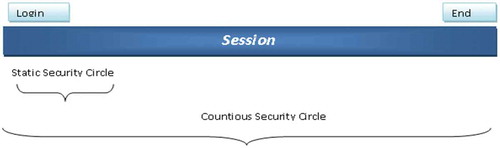
shows the security life cycles of static and continuous keystroke authentication systems. It is obvious that continuous keystroke authentication systems provide greater security.
Figure 2. Security cycles of static and continuous keystroke authentication system.
Additionally, static authentication analysis can be utilized only in systems where there is no need for additional text entry (e.g., to check bank accounts online). In contrast, there are numerous conceivable applications of the keystroke biometric for dynamic authentication analysis. One such application is the verification of the identity of students taking online quizzes/tests. This is an important application in the light of the fact that the number of students taking online classes is increasing, leading to growing concerned among education professionals about true assessment and academic integrity. Another good application is the use of dynamic biometrics to prevent insider attacks by installing key loggers on each employee’s computer to monitor his/her keystroke activities.
Keystroke features
Keystroke latency can be calculated by many different methods. The most commonly used methods are:
Press-to-press (PP) latency, which is the time interval between consecutive key presses, also called the digraph time.
Release-to-press (RP) latency, which is the time interval between releasing the key and pressing the next one, also called the flight time.
Release-to-release (RR) latency, which is the time interval between releases of two consecutive keys.
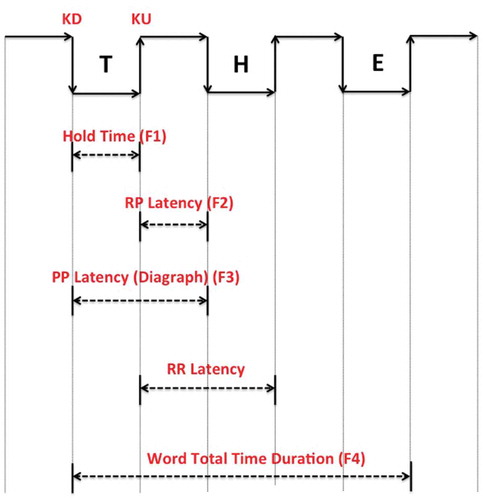
It is also possible to capture other keystroke dynamics information, such as the time it takes to write a word, two letters (digraph) or three letters (tri-graph). presents the most popular features that can be extracted from keystroke timing information. Other features such as difficulty of typing phrase, pressure of keystroke, and frequency of word errors can also be used as features in keystroke analysis. However, not all features are favorable since some of them require additional tools, as in the case of keystroke pressure.
Figure 3. Keystroke timing information.
Objectives and research questions
In this paper, we focuses on improving continuous user authentication systems (that are based on keystroke dynamics) designed to detect malicious activity caused by another person (impostor) whose goals to is take over the active session of a valid user. Through this paper, we assess the performance and influence of various keystroke features in keystroke dynamics authentication systems. In particular, this paper investigates the performance of keystroke features on various subsets of the 20 most frequently used English alphabet “letters”, the 20 most frequently appearing pairs of English alphabet “letters”, and the 20 most frequently appearing English “words”. The rationale behind in focusing only the first 20 items of each list is two-fold: (1) the feasibility of study and experimentations to assure that the study and the collection of data are accomplished within time and resource limits; (2) the significance of the results with respect to the volume of the data captured and analyzed. The performance of four features including the key duration, flight time latency, digraph time latency, and word total time duration are analyzed. Experiments are conducted to measure the performance of each feature individually and of different subset combinations of these features. Moreover, this paper introduces a new anomaly detection approach based on sequential change-point methods for early detection of attacks in computer authentication. The developed algorithms are self-learning, which allow the construction of continuous keystroke authentication systems without the need for building any user typing model in advance.
The research will be carried out by 1) studying the impact of the selected features on the performance of keystroke continuous authentication systems; 2) proposing new timing features that based on utilization of the most frequently used English words (e.g. “The”, “And”, For””) that can be useful in distinguishing between users in continuous authentication systems; 3) comparing the performance of keystroke continuous authentication systems with the application of different algorithms; 4) investigating the possibility of improving the accuracy of continuous user authentication systems by combining more than one feature; 5) proposing a new detector that does not require predefined typing models either from legitimate users or impostors.
The main research questions addressed in this paper are the follows:
Which keystroke timing feature(s) among key duration, flight time latency, digraph time latency, and word total time duration timing performs better in keystroke dynamics?
Does any combination of timing features improve the accuracy of an authentication scheme?
How does word total time duration feature perform in comparison with key duration, flight time latency, and digraph time latency?
Which authentication algorithm(s) among SVM, LDC, NB, and KNN performs better in keystroke dynamics?
Can we detect the impostor who takes over from the legitimate user during the computer session when NO predefined typing models are available in advance either for legitimate users or impostors?
Is it possible to detect an imposter in the early stages of an attack? If so, what amount of typing data is needed for a system in order to be able successfully detect the imposter?
Experimental procedure
This section describes the experimental procedure, data collection, and the feature selections used in this experimental study.
Data collection
A VB.NET windows form application was developed to capture raw keystroke data samples. For each keystroke, the time a key was pressed and the time a key was released, measured in milliseconds, were recorded. Our experiment of keystroke timing dynamic involved 28 participants. The participants were graduate students majoring in Computer Science who volunteered for the study and thus no official effort was made to obtain an Institutional Review Board (IRB) approval. The participants had the ability to use all keys on the keyboard including special keys such as Shift and Caps Lock keys. More importantly, they were also able to use the Backspace key to correct their typing errors.
The participants had the choice to either use our laptop computer or download the application for collecting data on their own computers. However, since the study was a controlled experiment, the keyboard use was controlled and the participants were asked to use our own laptop. The main window of the application was split into two sections. The top section displayed text that was required to be typed, i.e., fixed text. The bottom section had a space to allow the participant enter the text.
Even though it is desirable to let participants freely enter whatever they have in mind, it may cause some problems in performance evaluation since there is no source test text with which to compare the entered text to. When deciding about choosing a phrase for evaluation, some concerns should be accounted for: (1) reproducibility, (2) study heterogeneity, (3) internal validity, and (4) external validity (Kristensson and Vertanen Citation2013). It has been noted that when using a phrase set for typing and evaluation, the goal is to use phrases that are moderate in length, easy to remember, and representative of the target language (MacKenzie and Soukoreff Citation2003). It has reported that asking participants to memorize phrases increases entry rates at the cost of slightly increased error rates (Kristensson and Vertanen Citation2013). The preferred procedure, which is often used in the majority of research studies, is to randomly retrieve phrases from a set and present them to participants (MacKenzie and Soukoreff Citation2003). The texts used in the experiment were a collection of random English sentences selected from a randomly selected pool of English passages. shows a screen shot of the main window of the application used to collect the data from users.
Figure 4. The main window of the application used to collect the data from users.

All participants were asked to type the same prepared text (5000 characters) one time. Furthermore, six of the 28 participants were asked to provide another two samples of the same text. We were thus able to have two data sets:i) the first data set contained one sample for each one of the 28 users, and ii) the second data set contained two more samples for only six users who played the role of the owner of the device, i.e. the legitimated users, and whose active authentications were of interest.
Extracted features
The collected raw data from both data sets were used to extract the following features for our experiment:
Duration (F1) of the key presses for the 20 most frequently English alphabet letters (e, a, r, i, o, t, n, s, h, d, l, c, u, m, w, f, g, y, p, b) (Gaines Citation1956).
Flight Time Latency (F2) for the 20 most frequently appearing pairs of English alphabet letters (in, th, ti, on, an, he, at, er, re, nd, ha, en, to, it, ou, ea, hi, is, or, te) (Gaines Citation1956).
Digraph Time Latency (F3) for the 20 most frequently appearing pairs of English alphabet letters (in, th, ti, on, an, he, at, er, re, nd, ha, en, to, it, ou, ea, hi, is, or, te) (Gaines Citation1956).
Word Total Duration (F4) for the 20 most frequently appearing English words (for, and, the, is, it, you, have, of, be, to, that, he, she, this, they, will, I, all, a, him) (Fry et al. Citation2006).
Every feature (F1, F2, F3, and F4) consisted of 20 data items. For instance, F1 contained 20 alphabet letters, where each letter represented an item (e.g. “a”). illustrates an example of four keystroke features extracted for the word “the” along the features.
Classification schemes
In keystroke dynamics security system, classification of users is accomplished based on the similarities and dissimilarities among the observed data and stored patterns. In this paper, four machine learning classification techniques are adapted to evaluate the performance of the keystroke identification and authentication systems. The selected classification methods are Support Vector Machines (SVM), Linear Discriminate Classifiers (LDC), K-Nearest Neighbors classifiers (K-NN), and Naive Bayesian (NB). The adapted techniques are accompanied by a good and comprehensive set of features that enables conducting various forms of classification analysis.
Support vector machine
Support vector machines (SVMs) are an excellent and prevalent technique for data classification. SVM is a discriminative classifier based on the concept of separating hyperplanes. In other words, given a set of labeled of training data, SVM objective is to find an optimal separating hyperplane that separates the training data set by a maximal margin.
Given two classes of labeled training data, an SVM outputs an optimal hyperplane that categorizes new observation of data either to (+1) or (−1). Generally, SVM classification is a two-phase process. In the first phase, or the training phase, the SVM classifier builds two models using the training vectors. The algorithm projects two classes of training data into a higher dimensional space, then finds a linear separator between the two classes. Thus, all vectors located on one side of the hyperplane are labeled as 1, and all vectors located on the other side are labeled as −1. In the second phase, the testing phase, the testing vectors are mapped into the same high-dimensional space and it is predicted as to which category they belong to, with respect to the side of the hyperplane they fall.
In addition to the traditional linear classifications, SVMs can effectively execute a non-linear classification using what is called the kernel functions. The two most used kernel functions with SVM are the polynomial kernel and the radial basis. While the polynomial kernel produces polynomial boundaries of degree d in the original space, the radial basis function (RBF) produces boundaries by putting weighted Gaussians upon key training instances. An RBF kernel nonlinearly projects training data samples into a higher dimensional space and can therefore deal with the cases in which the relation between class labels and attributes is nonlinear. This type of kernel is distinct upon the linear kernel.
Linear discriminant classifier
Linear discriminant classifier (LDC) is a simple and mathematically strong classification method that is based upon the concept of searching for a linear combination of variables, which can best separates two or more classes. LDC tries to find a linear combination of variables (predictors) that maximizes the difference between the means of the data while at the same time minimizes the variation within each group of the data. Therefore, LDC usually looks for a projection where samples from the same class are projected close to each other and, at the same time, the projected means are as separate as possible.
Assume that we have C classes with the mean vector of each class; we are then interested in finding a scalar by projecting the samples onto a line:
where x is a sample vector, Wk is a weight vector that represents coefficients, and Wk0 is the bias, also called threshold, which determines the decision surface. In order to find the optimum W, first the within-class scatter matrix SW is computed by the following equation (Scholkopft and Klaus-Robert Citation1999):
where
represents scatter matrix for every class, and is the mean class vector. Similarly, the between-class scatter matrix
is computed by the following equation:
where m is the overall mean, and and
are the sample mean and sizes of the respective classes. Finally, linear discriminates can be expressed as:
K-nearest neighbor
The K-nearest neighbor classifier is one of the simplest and most well-known classifiers in pattern recognition. The main principle behind it is to calculate the distance from a query point to all of its neighbors in the training set and select the k data points which are the closest ones. Specifically, in the training phase, the KNN classifier builds two models using the training vectors. In the testing phase, the distances between the query point and all its neighbors are calculated. A majority vote is then used to classify a new point to the most prevalent class between its K-nearest neighbors. In other words, KNN classifies new points based on a similarity measure (e.g., distance functions). In general, the distance can be any metric measure; however, the Euclidean distance is the most frequent choice. The Euclidean distance is given by the following equation (Cunningham and Delany Citation2007):
Naïve bayes
The Naive Bayes classifier technique is a well-known machine learner based on Bayes’s rule of conditional probability with a “naive” independence assumption between every pair of variables. Specifically, a Naive Bayes classifier provides a method of calculating the posterior probability, P(c|x), from P(c), P(x), and P (x|c) as seen in the following equation:
where:
P(c|x) is the posterior probability of a target class given the predictor (attribute).
P(c) is the prior probability of class.
P(x|c) is the likelihood, which is the probability of predictor given class.
P(x) is the prior probability of predictor.
R packages
Analyses of machine learning-based classification methods were conducted using R scripts. In particular, knn and lda functions from MASS R package (Venables and Ripley Citation2013) were used to carry out K-Nearest Neighbors (K-NN), and LDC analyses respectively. On the other hand, SVM and Naïve Bayes functions from e1071 R package (Dimitriadou et al. Citation2009) were used to carry out Support Vector Machine (SVM) and Naive Bayesian (NB) analyses respectively.
Results
Evaluating authentication performance
The performance of the authentication system was evaluated by assigning each of the 28 users in the training data set the role of a genuine user. Then, each of the remaining users played the role of the imposter. The above-mentioned classifiers were then built, trained,Footnote1 and tested to measure their ability in classifying the genuine user and imposters. On each repetition, we kept track of the number of false positives and false negatives classified by each classifier. The false acceptance rate (FAR) and false rejection rate (FRR) were then computed as follow:
where is the number of false positive cases,
is the number of false negative cases,
is the number of true negative cases, and
is the number of true positive cases, classified by the classifier. It is important to note that the use of FAR and FRR under the context of keystroke dynamics is very prevalent. It is also possible to employ some other metrics such as the time it takes to recognize an imposter. However, employing such assessment metrics and in particular the real time that takes to identify an imposter are prone to being less accurate. We adhere to use FAR and FRR instead of some other metrics for consistency with the literature and similar research work conducted by some other researchers.
We ran two experiments in this paper. The aim of the first experiment was to compare the features individually in order to find out which features were most effective in distinguishing users. The purpose of the second experiment was to evaluate and study the influence of various keystroke feature combinations on the performance accuracy of keystroke dynamics authentication system. Specifically, we compared the performances of four features against different feature combinations using the proposed classifiers.
For both experiments the first 25 typed timing repetitions of all feature’s items (20 items of each feature) were selected to create a user profile. We selected 25 repetitions of each feature’s item for two reasons: First, 25 repetitions in our data set can be treated as the smallest number of repetitions that occurred for all feature’s items. Secondly and more importantly, we aimed to test the classifiers performance on small samples to determine the accuracy in these cases. Then, the first 20 repetitions of each feature’s item (of the 25) for each user were chosen for the training phase, and the remaining five repetitions of each feature’s item were used for the testing phase.
Comparing the performance of the classifiers
In order to compare the classification algorithms mentioned in the previous section, the digraph latency (F3) was used since it is the most utilized feature by researchers in literature (Banerjee and Woodard Citation2012). reports the results. By observing , we notice that KNN and SVM perform the best among the four utilized classifiers. However, using KNN classifier, we are able to obtain a better result compared to the other learning classifiers (SVM, LDC, and NB) for minimizing the authentication error rates of FAR and FRR. Using KNN classifier, the FAR and FRR values achieved were 5% and 4%, respectively.
Table 1. A comparison of learning methods using digraph time latency.
The performance of single feature individually
We compared four different keystroke features F1 (Duration), F2 (Flight Time Latency), F3 (Diagraph Time Latency), and F4 (Word Total Duration) based on the four classification methods. illustrates the FAR and FRR values for all features based on (SVM), (LDC), (NB), and (K-NN), respectively. We observe that by using F4, we are able to obtain a better result compared to the other keystroke features (F1, F2, and F3). In particular, the results are ascertaining noticeably better with the use of the KNN classifier. The FAR and FRR values when F4 was used were 3% and 2%, followed by F3 with 5% and 4% of FAR and FRR, respectively. The low FAR and FRR values for F4 and F3 suggest that these two timing features might be good indicators for distinguishing users.
Table 2. The performance comparison of four different keystroke features on SVM, LDC, NB, and KNN.
Multiple features performance
We have already observed that the use of F4 feature produced the best result among the four keystroke features. It would be beneficial to know whether combinations of these features would improve the results by reducing the error rates values of FAR and FRR.
Since KNN and SVM outperformed the other classification methods, we used only KNN and SVM in the second analysis that aimed to evaluate and study the influence of various keystroke feature combinations on the performance accuracy of the keystroke dynamics. It can be observed from and that the error rates values of FAR and FRR were decreased by combining more than one feature. In particular, using the KNN classifier, we were able to achieve 2% of FAR and 1% of FRR when combining the four features. More notably, while using the KNN classifier, the results showed that the combination of F4 with any other three features produced a better result as compared to other combinations without F4. Furthermore, the worst results were obtained from combining F2 and F3 for both classifiers. It is possible that because the latency times are less stable than duration times, combining of the two latency times in combination might prove insufficient for distinguishing users.
Figure 5. Performance comparison of four keystroke features used independently against the ten different combinations performed on SVM.
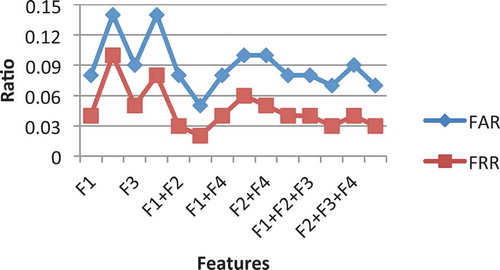
Figure 6. Performance comparison of four keystroke features used independently against the ten different combinations performed on KNN.
Keystroke dynamics vs. intrusion detection
A continuous authentication system can be considered as a kind of intrusion-detection application that monitors a series of activities with the aim of detecting any malicious activities or abrupt changes in the system behavior.
Existing intrusion detection systems fall into two categories: i) Signature-Detection Systems, and ii) Anomaly-Detection Systems. In Signature-Detection systems, the system attempts to detect any attacks by comparing the observed patterns (patterns under the test) with known large databases of attack signatures. Therefore, such a system only looks for specific kinds of attacks that have already been identified and listed in the database. In anomaly detection, the system defines a normal baseline of a series of activities and then tries to compare the parameters of the newly observed activities with the learned normal activities. The attack is announced once a certain deviation from the normal activities is observed (Chandola, Banerjee, and Kumar Citation2009).
The problem of detecting an attack through which an imposter takes over an active session of a valid user, where it is impossible to gain prior knowledge of impostor activities, can be formulated and solved using the anomaly-detection approach. In particular, the approach adopted in this paper is based on change-point detection theory that offers the ability to detect a change in the model distribution in the early stages of an attack by specifying a particular point where the regular behavior starts to deviate. The idea behind this approach is based on the observation that taking over an active session of a valid user by another person (impostor) would lead to relatively abrupt changes in the statistical parameters. These changes occur at unknown points in time and should be detected as soon as possible.
Change-point detection
The driving idea behind change-point detection technique is that the structure of time-series data can be formulated or described by a stochastic model, and that modification or transformation of the data leads to abrupt changes of the data structure. Modifications in data can occur due to a number of causes such as a change in means, variances or correlation functions. Generally, such changes in distributions occur at unknown points in time, and then the objective of change-point detection is to detect these changes as soon as possible.
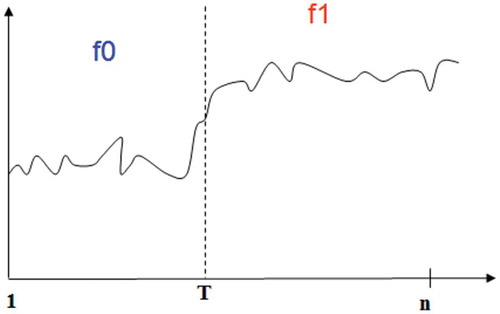
Traditionally, in typical change-point problems, one assumes that the sequence of time-series data that contain n observations is independent and identically distributed (iid) corresponding to some distribution
. If the change occurs at some point of time
, then the observations are independent and identically distributed, but to some another distribution
, where
, and can be written as (Hawkins, Qiu, and Kang Citation2003):
illustrates the general procedure of change-point detection. Generally, change-point detection algorithms identify where there is a change in the data sequence.
Figure 7. An illustration of a change-point detection system.
The change-point detection approach is typically characterized by three major metrics to measure its performance, namely: i) false alarm rate, which occurs when the alarm is flagged before the change occurred (Type I error); ii) misdetection rate, which occurs when a system cannot detect a change (Type II error); and iii) detection delay, which refers to the time period from the start of the change until the alarm is flagged correctly (Hawkins, Qiu, and Kang Citation2003). Detection delay can also be measured by the amount of data a system needed until signaling a change.
Generally, there are two main methods to detect changing events: batch detection and sequential detection (Basseville and Nikiforov Citation1993). In the former setting, there is a fixed length of sequence of time-series observations, and it is necessary to determine whether or not the observations are statistically homogeneous, and in the case of a sequence that is not homogeneous, to determine a particular point in time when the change occurred. This type of change-point detection is also called retrospective because it makes the decision as to whether the change occurred or not based on all observations. In the latter setting, the sequence of time-series of observations does not have a fixed length. The observations are arrived in and tested sequentially over time. Whenever a new observation is added, the test is made to determine if the change happened by using only the observations arrived in thus far. If the test decides no change has occurred, then the next observation is added to the observations set and tested.
Traditionally, the methods used for these problems are completely different. For batch-detection problems, the most generally used methods are likelihood ratio testing and Bayesian inference (Stephens Citation1994). On the other hand, control charts methods such as the Cumulative Sum (CUSUM) (Page Citation1954), Exponential Weighted Moving Averages (EWMA) (Roberts Citation1959), or sequential Bayesian methods (Fearnhead and Liu Citation2007) are used to detect changes in sequential change-point problems.
Sequential change-detection problems vary based on the assumption used about pre and post-change distributions. The traditional control charts methodologies, such as Cumulative Sum (CUSUM), and Exponential Weighted Moving Averages (EWMA), usually assume that data follows some parametric distribution, mostly normal distribution, and require a complete knowledge regarding the pre and post-change distribution parameters (mean, variance or both). However, in many feasible cases, these parameters are unknown, and in many situations the information about data distribution may not even be available.
Recently, advanced works in the field of change-point model framework have been developed to detect changes in cases where the available information about pre and post-change distributions is very restricted. The developed methodologies employ several statistical tests from parametric and nonparametric techniques to enable the detection of changes in diversity of sequences (Hawkins and Deng Citation2010; Hawkins, Qiu, and Kang Citation2003; Hawkins and Zamba Citation2005; Ross and Adams Citation2011).
The initial work was introduced by Hawkins, Qiu, and Kang (Citation2003) and concentrated on detecting changes in mean shift or variance of normal random distribution variables. Hawkins et al. assumed that no prior information is available regarding distributions parameters. Hawkins et al. developed an approach based on the logic of two-sample hypothesis testing, where the null hypothesis assumes that all observations in the sequence come from the same distribution and no change point occurs, against the alternative hypothesis, which assumes that there is a change point in the sequence of observations that split them into two sections. This work has been expanded by other researchers to detect more complicated changes, including those assuming that the ongoing data observations distribution is unknown (Hawkins and Deng Citation2010; Ross and Adams Citation2011; Zou and Tsung Citation2010).
The change-point model techniques developed in (Hawkins, Qiu, and Kang Citation2003) can be used in both batch detection and sequential detection settings. In the next two subsections, we will explain in further detail how these techniques work. First, we provide an overview of the batch-detection scenario, and then we explain the sequential extension.
Batch change-point detection
In the batch change-point setting, there is a fixed length of sequence of time-series observations where it is necessary to decide if the observations involve any change point or not. If any change exists, the sequence observations are independent and identically distributed corresponding to some distribution . If the change occurs at some point of time T, then the sequence of observations will have another distribution
, where
. In this case, the change point will be determined instantly after some specific observation
(Hawkins, Qiu, and Kang Citation2003).
In particular, this approach to the batch-change detection problem follows the form (Hawkins, Qiu, and Kang Citation2003):
where k represents an observation that a change point occurs at an unknown point of time.
This is a classical problem that can be solved by using a two-sample hypothesis test, where the option of statistical test relies on what is assumed to be known about the observations’ distribution. For instance, if the data observations are assumed to follow a normal distributional, then a Student-t test would be suitable to detect changes in mean, and an F test to detect a change in scale. For some other cases when no assumption is made about the data observations distributional, then a nonparametric test such as Man-Whitney test can be used to detect changes in location shifts, and the Mood test to detect changes in scale shifts.
Once the two-sample statistical test is chosen, the computed statistical value can then be compared to some appropriate threshold, if the computed value is greater than the threshold, then the null hypothesis that assumes the two-samples come from the same distribution is rejected, and we say that the change has occurred. The choice of threshold is based on the security level of the considered application. Small threshold value will result in quicker change detection at the cost of obtaining higher false alarms (Ross et al. Citation2011).
Since , an abrupt change-point in statistical model, is not known in advance, a two-sample statistical test
is estimated for every
, and the maximum value is used. In particular, every potential way of dividing a sequence of observations into two non-overlapping sets is considered, and a two-sample statistical test is applied at the splitting point to test for a change. The statistical test is then:
where is statistical means values,
is statistical standard deviations.
then has standardized mean of 0 and variance of 1. If
, the null hypothesis that assumes no change has occurred is rejected, where
is some suitable selected threshold that limits the Type 1 error rate and is constrained by the given value α. At last, the maximum likelihood estimator is used to estimate the best location of the change point that immediately follows the
observation that maximized
, i.e.: (Hawkins, Qiu, and Kang Citation2003).
Sequential change-point detection
The traditional two-sample hypothesis testing approach used in the batch- detection scenario can be extended to sequential change-detection scenario where new observations are arrived in and tested sequentially over time (Ross Citation2015).
The main driving idea behind this approach is that whenever a new observation is arrived in, it will be added to the observations sequence and the sequence treated as being a fixed length sample, then the change-point statisticis computed using the above batch methodology (Ross Citation2015).
To be specific, suppose thatindicates the number of observations that has been arrived in so far, where
and is increasing over time. Whenever a new observation
is arrived, it will be added to the sequence and treated
as being a fixed size sample, and computed
using the methodology from the previous section. If
for some appropriate selected threshold, the change is detected. If no change was detected, the subsequent observation
is added to the sequence, and then
is computed and compared to
, and so on.
While it is possible to determine the sequence ofthat limits the Type 1 error rate value with a fixed length sample, such a sequence is not appropriate for sequential change detection. In this setting, Type 1 error rate is linked with Average Run Length (ARL), that is, a number of observations are checked before the first signal of change is indicated, which is equal to
. Thus,
is selected so that the probability of Type 1 error is fixed over time, and under the null hypothesis that assumes no change-point occurs (Hawkins, Qiu, and Kang Citation2003):
However, the conditional distribution in the previous equation is computationally intolerable, and some other methods such as Monte Carlo simulation method is used to compute the sequence of the values that correspond to the selected.
The choice of Average Run Length (ARL) impacts the detection delay and false alarm rate. Low value of ARL will result in quicker change detection at the cost of obtaining higher false alarms (Ross et al. Citation2011). Therefore, selecting an appropriate value of ARL is based on the security level of the considered application.
While the major work of this approach concentrated on detecting changes in the shifts in means or variances of normal random distribution variables, some other researchers have expanded it to detect more complicated changes including nonparametric change detection of non-normal distribution, when no prior information is available regarding even the sequence distribution. (Hawkins, Qiu, and Kang Citation2003) used Man Whitney and (Ross et al. Citation2011) used Mood statistic tests to detect changes in location and scale parameters respectively, when no assumptions about the sequence distribution are made. (Ross and Adams Citation2011) used Lepage and Cramer-von-Mises statistics tests that designed to test the equality of the location and scale parameters changes where no assumptions about the sequence distribution are made.
CPM R package
In this paper, we use the cpm (Ross Citation2015) package to detect changes in sequences of time-series keystroke dynamic observations. In particular, we use detectChangePoint function from the CPM package to detect changes in a stream of observations that were arrived in and tested sequentially over time.
Analyses
Several analyses are conducted to determine the effectiveness of the sequential change-detection methods in continuous keystroke-based systems with the aim of detecting impostors automatically. The analyses results report how quickly the impostor is detected. This section represents data set used, experiment setup, and the results obtained by the analyses.
Data set
In the previous sections, the experiments focused on evaluating and studying the influence of various keystroke features on the performance accuracy of the keystroke dynamics system. Therefore, typed timing repetitions of all feature items were used to build user profiles in order to find which features perform the best among the four features (key duration, flight time latency, digraph time latency, and word total time duration). This section focuses only on the extracted feature item of key press duration (F1) for the most 11 frequently appearing English alphabet letters (e, a, r, i, o, t, n, s, h, d, l) (Gaines Citation1956). Sequences of time-series data for each user of 28 users are created based on those 11 letters, which are supposed to represent about 77% of any written text (Gaines Citation1956).
Analyses methods
To evaluate the effectiveness of the proposed sequential change-detection method on continuous user authentication system that is keystroke-based, we used four performance matrices:
False Acceptance Rate (FAR): it refers to the percentage of times a test does not signal a change-point in the sequence when it is there, also known as misdetection rate.
False Rejection Rate (FRR): it refers to the percentage of times a test signals a change point in the sequence when it is not there, also known as false alarm rate.
Equal Error Rate (EER): it can be defined as the point where FAR value is equal to FRR value, which can be estimated from Receiver Operating Characteristics (ROC) which plot FAR values against FRR values under different threshold values. Different thresholds are linked with choosing different values of Average Run Length that is equal
.
Average Detection Delay (ADD): it refers to the average amount of data a test needed to signal a change point in the sequence when it is there.
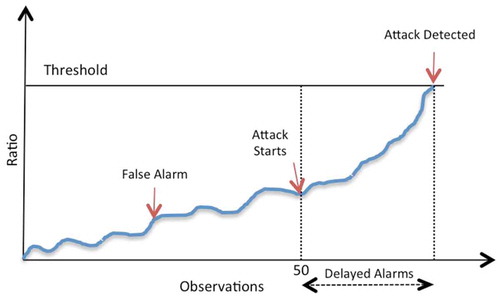
Authentication system performance was evaluated by assigning each of the 28 users in the data set the role of a genuine user. Then, each of the remaining users played the role of an imposter. In each repetition, the first 50 typed timing repetitions of the underlying letter, for both genuine user and impostor, were selected to create the sequence of observations data. Thus, a sequence of observations consisted of 100 timing repetitions: the first 50 timing repetitions represented a genuine user, and the last 50 timing repetitions represented an imposter.
The detectChangePoint function from CPM package is used to detect a single point of change in the sequence of observations, and to estimate the best location of the observation at which the change was detected; in our case, occurring after 50 observations. The detectChangePoint function processes the entire sequence. If the change was detected, then the observation at which the change was detected is specified. If no change was detected, then the function returns 0. More specifically, the authentication system performance was evaluated as follows:
If the test signals a change point before 50 observations, then we say that an authorized and legitimate user was declined from using the system.
If the test does not signal a change point in the sequence, then we say that the test was not able to detect a change, and an imposter was accepted by the system falsely.
If the test signals a change point after 50 observations, we record the location where it is detected and we calculate the detection delay in terms of the amount of data needed by the system to signal a change point in the sequence.
illustrates the change-point detection approach used in this paper. The first 50 typed timing repetitions belong to the genuine user, and the last 50 belong to the impostor. In this case, the attack begins at observation 51.
Figure 8. An illustration of sequential change-point detection. The detection delay is measured in the amount of data a test needed to signal a change point in the sequence.
This procedure was repeated for all 28 users, and thus there were 756 unique sequences of data for each letter of the 11 letters that needed to be tested to detect the change.
For an ideal case, both error rates (FAR, FRR) should be equal to 0%. However, there is a trade-off between these two metrics; that is increasing one might not be possible without decreasing the other. Thus, an appropriate threshold is a very important issue in biometric authentication systems that may depend heavily on the security level of the application. For instance, in the domains where a high security application is required, FAR needs to be as low as possible to detect as many impostors.
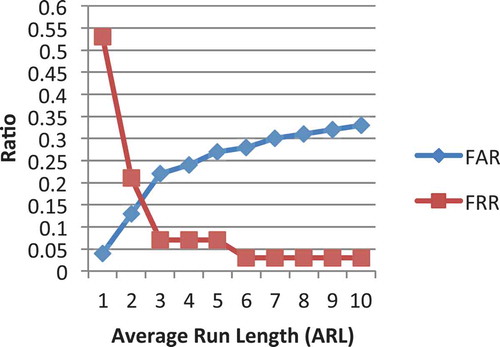
Therefore, to compare the performance of our detection system using different thresholds, various values of ARL were used. In particular, we tested the performance of our detection system for choices of ARL values ranging from 100 to 1000 with increments of 100 for each round. In each round, we calculated False Acceptance Rate (FAR), False Rejection Rate (FRR), and Average Detection Delay (ADD) measured in the amount of data a test needed to detect a change point. Calculation of False Acceptance Rate (FAR) and False Rejection Rate (FRR) using different thresholds would allow us to estimate Equal Error Rate (EER) values to compare a letter’s performance. For instance, shows the performance of the detection system using different values of ARL for letter E. The point where FAR value crosses FRR value is used to estimate Equal Error Rate (EER) and Average Detection Delay (ADD) from that reports the corresponding values of ARL, FAR, FRR and ADD. In this case, as shown in , the estimated value of ERR is equal to 16%. Looking at , we can see that this value falls within 13% of FAR and 21% of FRR, respectively. Therefore, we can see that the best FAR, FRR and ADD can be obtained when ARL = 200, and in this case, the estimated ERR is equal to 16%.
Table 3. Performance of detection system using different ARL of letter “E”.
Figure 9. Performance of detection system using different ARL of letter “E”.
In this setting, we ran several different experiments using different statistical test techniques, both parametric and nonparametric, to detect different kinds of changes; in particular, Mann-Whitney and Mood statistic tests to detect changes in location and scale parameters, respectively, and Lepage, and Cramer-von-Mises statistics to detect more general changes.
Analyses results
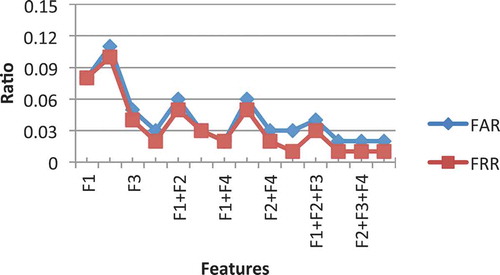
This section reports the results obtained by the conducted experiments. We ran three experiments. The purpose of the first experiment was to determine which letter performs better among all 11 letters. The aim of the second experiment was to investigate how the number of observations that were available from the pre-change distribution would impact the performance. The aim of the third experiment was to compare different statistical tests techniques performance.
Letter performance
This section reports the accuracy measures of each letter to determine which letter performs better among all 11 letters. illustrates the performance values for performance of the 11 most frequent letter performances using sequential change-point detection along with Lepage statistical tests. For each letter, the table shows the estimated EER and its FAR and FRR interval that ERR falls within, and its estimated Average Detection Delay (ADD) measured by the average number of letters a test needed to signal a change point in the sequence when it was there.
Table 4. Letter performance using sequential change-point detection when employing Lepage statistical tests, the change occurs after 50 observations.
We observe that some letters perform better than the others. For instance, the estimated EER of letter “D” was 12% while the estimated EER of letter “N” was 22%. The low estimated EER of letters suggests that these letters might be good indicators for distinguishing users among the eleven letters.
Moreover, in it is observed that letter “D” performs the best among all eleven letters with 12% estimated EER, and estimated Average Detection Delay equal to 13 letters. Letter “A” comes in second place with 13% estimated EER, and estimated Average Detection Delay equal to 14 letters.
(2)Pre-Change Number of Observations Impact
In the previous experiment, the authentication system performance was evaluated by selecting the first 50 typed timing repetitions of the underlying letter, for both genuine user and impostor, to create the sequence of observations. In this section, we report the results when increasing the number of observations from 50 to 100 to investigate how the number of observations that are available from the pre-change distribution would impact the performance.
illustrates the performance values for the most frequent 11 letters using sequential change-point detection with Lepage statistical tests while increasing the number of observations from 50 to 100. We can observe that changes that occur after the 100th observation are easier to detect than those occurring after the 50th. Thus, we can conclude that the changes that occurred later are easier to detect than those which occurred earlier.
(3)Techniques Comparison
Table 5. Letter performance using sequential change-point detection when employing Lepage statistical tests, the change occurring after 100 observations.
We ran several different experiments using different statistical test techniques to detect different kinds of changes. In particular, Mann-Whitney, Mood statistic tests to detect changes in location and scale parameters, respectively, and Lepage, and Cramer-Mises statistics to test the equality of the location and scale parameters changes where no assumptions about the sequence distribution are made.
illustrates the performance values using these techniques. The table shows the results when the changes occur after the 50th and 100th observations. We can observe that some techniques perform better than others. In it is shown that Lepage statistical tests perform the best among all five techniques with an average 16% of estimated EER when the changes occur after the 50th and with an average 12% of estimated EER when the changes occur after the 100th observations.
Table 6. Letter performance using sequential change-point detection when employing different statistical test techniques.
Related work
(Gaines et al. Citation1980) conducted a feasibility study on the use of timing patterns of keystrokes as an authentication method. The experiment involved six professional typists who were required to provide three passages consisting of 300 to 400 words, two times each, over a period of four months. A statistical t-test was applied under the hypothesis that the means of the digraph times were the same in both settings, and with the assumption that the two variances were equivalent. It was demonstrated that the number of digraph values that exceeded the test were typically between 80 to 95%. The most frequent five digraphs that appeared as distinguishing features were in, io, no, on, ul.
Umphress and Williams (Citation1985) conducted an experiment in which 17 participants were asked to provide two typing samples. The first sample, which was used for training, included about 1400 characters, and the second, which was used for testing, included about 300 characters. Digraph latencies that fall within 0.5 standard deviations of its mean are considered to belong to a valid user. They achieved 6% of FAR and 12% of FRR.
Leggett and Williams performed experiments on 36 participants who were asked to type the same text of 537 characters twice in two separate events over a month (Leggett and Williams Citation1988). The first sample was used for training and building an authentication model of the users, and the second sample was used for testing. The test digraph latency was counted valid if it fell within a 0.5 standard deviation of the mean reference digraph latency, and was accepted if the ratio of valid digraph latencies to total latencies was more than 60%. A False Acceptance Ratio (FAR) of 5.5% and a False Rejection Ratio (FRR) of 5% were achieved.
Monrose and Rubin performed a study on both static and dynamic keystroke analyses (Monrose and Rubin Citation2000). Overall, 31 users were asked to type a few sentences from a list of available phrases and/or enter a few free sentences. Three different methods were used to measure similarities and differences between typing samples: normalized Euclidean distance, weighted maximum probability, and non- weighted maximum probability measures. About 90% of correct classification was achieved when fixed text was used. However, it was reported that when different texts are used, accuracy collapsed to 23% of correct classification in the best state.
Dowland, Singh, and Furnell (Citation2001) monitored normal activities of four users for some weeks on computers using Windows NT, which means there were no constraints on the users. Different statistical techniques were applied. Only digraphs that occurred less frequently by the users were used to build the users’ profiles. A new sample compared users’ profiles in two steps: first, each digraph in the new sample is compared to the mean and standard deviation of its corresponding digraph in the users’ profiles and marked accepted if it fell within some defined interval. Second, the new sample was assigned to the user whose profile provided the largest number of “accepted” digraphs. A 50% correct classification was achieved.
Bergadano and Guenti used the type error and intrinsic variability of typing as a feature to differentiate between legitimate users and impostors (Bergadano et al. Citation2002). Their experiment involved 154 participants, of whom 44 users, as legitimate users, were asked to type a fixed text of 683 characters long for five times over a period of one month, while110 users were asked to provide only one sample to be used as impostor users. The degree of disorder within tri-graph latencies was used as a measure for dissimilarity metric and statistical method for classification to compute the average difference between the units in the array. This approach was able to achieve 0.0% of FAR and 2.3% of FRR.
Curtin et al. (Citation2006) conducted three identification experiments in which subjects were asked to type three texts 10 times. The first two texts were 600 characters in length and the third one was 300 characters in length. The first text was used for training. The nearest neighbor classification technique employing Euclidean distance was used in these experiments. A 100% identification accuracy was achieved on eight users typing the same text. However, this accuracy diminished with 30 subjects, typing different texts, and gradually decreasing the length of the text. It was concluded that the best performance could be achieved under these conditions: sufficient training and testing text length, sufficient number of enrollment samples, and the same keyboard type used for enrollment and testing.
(Gunetti and Picardi Citation2005) conducted an experiment on 205 participants. Their work focuses on long free text passages. They used 40 participants to represent legitimate users who provided 15 samples each, and 165 participants to represent impostors who provided only one sample each. They developed a method for comparing the two typing samples based on the distance between typing times. They reported a FAR below 5% and a FRR below 0.005%.
(Hu, Gingrich, and Sentosa Citation2008) used 19 participants to represent legitimate users who provided 5 typing samples each, and 17 participants to represent impostors who provided 27 samples. Typing environment conditions were not controlled in the experiment. Typing samples were used in building users’ profiles by creating averaging vectors from all training samples. K-nearest neighbor technique was employed to cluster the users’ profiles based on the distance measure. 66.7% of correct classification.
Conclusion
This paper focuses on improving continuous user-authentication systems (based on keystroke dynamics) designed to detect the malicious activity caused by another person (impostor) who takes over the active session of a valid user by 1) studying the impact of the selected features on the performance of the keystroke continuous authentication system; 2) proposing new timing features that can be useful in distinguishing between users in continuous authentication systems; 3) comparing the performance of the keystroke continuous authentication system when applying different algorithms; 4) investigating the possibility of improving the accuracy of continuous user authentication systems by combining more than one feature; 5) proposing a new detector that does not require predefined typing models either for legitimate users or impostors.
The new keystroke timing features based on the utilization of the most frequently used English words can be useful in distinguishing between users in continuous authentication systems based on keystroke dynamics. The results of empirical studies show that word total time duration obtains the better result among the four features when applying the four classification methods (SVM, LDC, NB, and KNN). In particular, word total time duration provides better results with the use of the KNN classifier. This paper also investigates the possibility of improving the performance of the keystroke continuous authentication system by performing various combinations of the extracted keystroke features. In particular, this paper compares the independent performance of four keystroke features, including) key duration, ii) flight time latency, iii) digraph time latency, and iv) word total time duration against ten different combinations of these keystroke features. The results showed that the combination of features does improve the accuracy of authentication while using KNN and SVM classification methods.
Finally, this paper presents a new anomaly detection approach based on sequential change-point theory in order to detect the impostor who takes over from the legitimate user during the computer session when no predefined typing models are available in advance, either for legitimate users or impostors. The new approach provides the ability to detect the impostor in early stages of attacks. The empirical results show that letter “D” performs the best among all eleven letters with 12% of estimated EER, and estimated Average Detection Delay equal to 13 letters when Lepage statistical tests are employed. Additionally, the paper shows that the changes that occurred later are easier to detect than those, which occurred earlier.
Future work might involve introducing and comparing the performance of more anomaly detection techniques such as neural network and random forest hills in terms of their ability to distinguish between users. We are also interested in trying to train classifiers using smaller samples sizes and testing the impact of that on the performance accuracy in order to determine the minimum amount of typing training data needed for building a continuous typist authentication model of a user with the possibility of maintaining good performance accuracy of the system. In addition to applying sequential change-point analysis on a univariate sequence of data (letter by letter), we are also interested in applying this approach on multivariate observations. Moreover, we are also interested on studying the performance of other features such as flight time latency, digraph time latency, and word total time duration using sequential change-point analysis.
Notes
1. Please note that the classifiers used in this section still need to be trained the user models. However, when using sequential change point approach, there will be no need to train a user model.
References
- Alippi, C., G. Boracchi, and M. Roveri. “A hierarchical, non-parametric, sequential change-detection test,” International Joint Conference on Neural Networks (IJCNN), San Jose, CA, 2011.
- Ara´Ujo, L. C. F., L. H. R. Sucupira, M. G. Liz´Arraga, L. L. Ling, and J. B. T. Yabu-Uti. 2004. User authentication through typing biometrics features. IEEE Transactions on Signal Processing 53 (2):851–55. doi:10.1109/TSP.2004.839903.
- Ashbourn, J. 2000. Biometrics: Advanced identity verification. London: Springer.
- Banerjee, S. P., and D. L. Woodard. 2012. Biometric authentication and identification using keystroke dynamics: A survey. Journal of Pattern Recognition Research 7 (1):116–39. doi:10.13176/11.427.
- Basseville, M., and I. V. Nikiforov. 1993. Detection of abrupt Changes. In Theory and applications, Englewood Cliffs, N.J.: Prentice Hall.
- Bergadano, F., D. Gunetti, and C. Picardi. 2002. User authentication through keystroke dynamics. ACM Transactions on Information and System Security 5 (4):367–97. doi:10.1145/581271.581272.
- Chandola, V., A. Banerjee, and V. Kumar. 2009. Anomaly detection: A survey. ACM Computing Surveys (CSUR) 41 (3):15. doi:10.1145/1541880.1541882.
- Cunningham, P., and S. J. Delany. 2007. k-nearest neighbour classifiers. In Multiple classifier systems, 1–17.
- Curtin, M., C. C. Tappert, M. Villani, G. Ngo, J. Simone, H. S. Fort, and S. Cha. 2006. Keystroke biometric recognition on long-text input: A feasibility study. In Int. workshop sci comp/comp stat (IWSCCS). Hong Kong.
- Dimitriadou, E., K. Hornik, F. Leisch, D. Meyer, A. Weingessel, and M. F. Leisch. “Package ‘e1071ʹ.” R Software package, avaliable at http://cran.rproject.org/web/packages/e1071/index.html(2009).
- Dowland, P., H. Singh, and S. Furnell. “A preliminary investigation of user authentication using continuous keystroke analysis.” In Proceedings of the IFIP 8th Annual Working Conference on Information Security Management & Small Systems Security. Las Vegas, 2001. 27–28.
- Fearnhead, P., and Z. Liu. 2007. On-line inference for multiple change point problems. Journal of the Royal Statistical Society Series B 69 (4):589–605. doi:10.1111/j.1467-9868.2007.00601.x.
- Florencio, D., and C. Herley. A large-scale study of web password habits. In Proceedings of the 16th International Conference on World Wide Web (WWW ’07), 657–66, 2007.
- Fry, E. B., J. E. Kress, and D. L. Fountoukidis. 2006. 5rd ed. The Reading Teachers Book of Lists. http://www.uniqueteachingresources.com/support-files/fryfirst100set.pdf
- Gaines, H. F. 1956. Cryptanalysis: A study of ciphers and their solution. New York: Dover.
- Gaines, R. S., W. Lisowski, S. J. Press, and N. Shapiro. 1980. Authentication by keystroke timing: Some preliminary results. Santa Monica,CA: Rand Corporation. R-2526-NSF
- Giot, R., M. El-Abed, and C. Rosenberger. 2011. Keystroke dynamics authentication. Biometrics, Vol. 1, pp. 157–182.
- Gunetti, D., and C. Picardi. 2005. Keystroke analysis of free text. ACM Transactions on Information and System Security 8:312–47. doi:10.1145/1085126.
- Hawkins, D. M., and Q. Deng. 2010. A nonparametric change-point control chart. Journal of Quality Technology 42 (2):165–73. doi:10.1080/00224065.2010.11917814.
- Hawkins, D. M., P. H. Qiu, and C. W. Kang. 2003. The change point model for statistical process control. Journal of Quality Technology 35 (4):355–66. doi:10.1080/00224065.2003.11980233.
- Hawkins, D. M., and K. D. Zamba. 2005. A change-point model for a shift in variance. Journal of Quality Technology 37 (1):21–31. doi:10.1080/00224065.2005.11980297.
- Hu, J., D. Gingrich, and A. Sentosa. “A k-nearest neighbor approach for user authentication through biometric keystroke dynamics.” In Proceedings of the IEEE International Conference on Communications. 2008. 1556–60.
- Killourhy, K.-S., and R.-A. Maxion “Why did my detector do that?!– predicting keystroke-dynamics error rates.” RAID’10 Proceedings of the 13th international conference on Recent advances in intrusion detection,vol. 6307 of Lecture Notes in Computer Science (2010): 256–76.
- Kristensson, P. O., and K. Vertanen, Performance comparisons of phrase sets and presentation styles for text entry evaluations. In Proceedings of 12th ACM International Conference on Intelligent User Interface, 29–32, 2013.
- Leggett, J., and G. Williams. 1988. Verifying identity via keystroke characteristics. International Journal of Man-Machine Studies 28 (1):67–76. doi:10.1016/S0020-7373(88)80053-1.
- MacKenzie, I. S., and R. W. Soukoreff. 2003. Phrase sets for evaluating text entry techniques. Extended Abstracts of the ACM Conference on Human Factors in Computing Systems - CHI 2003, pp. 754–755. New York: ACM.
- Monrose, F., and A. Rubin. 2000. Keystroke dynamics as a biometric for authentication. Future Generation Computer Systems 351–59. doi:10.1016/S0167-739X(99)00059-X.
- NTA, The information security specialists. 2002. http://www.nta-monitor.com/.
- Page, E. S. 1954. Continuous inspection schemes. Biometrika 41 (1/2):100–05. doi:10.1093/biomet/41.1-2.100.
- Revett, K., F. Gorunescu, M. Gorunescu, M. Ene, S. Magahaes, and H. Santos. 2007. A machine learning approach to keystroke dynamics based user authentication. International Journal of Electronic Security and Digital Forensics 1 (1):55–70. doi:10.1504/IJESDF.2007.013592.
- Roberts, S. W. 1959. Control chart tests based on geometric moving averages. Technometrics 42 (1):97–101. doi:10.1080/00401706.2000.10485986.
- Robinson, J. A., V. M. Liang, J. A. M. Chambers, and C. L. MacKenzie. 1998. Computer user verification using login string keystroke dynamic. IEEE Transactions on Systems, Man, and Cybernetics – Part A: Systems and Humans 28 (2):236–41. doi:10.1109/3468.661150.
- Ross, G. J. 2015. Parametric and nonparametric sequential change detection in R: The cpm package. Journal of Statistical Software, Volume 66, Issue 3.
- Ross, G. J., and N. M. Adams. 2011. Sequential monitoring of a bernoulli sequence when the pre-change parameter is unknown. In Computational statistics 28 (2013):463–79.
- Ross, G. J., N. M. Adams, D. K. Tasoulis, and D. J. Hand. 2011. A nonparametric change-point model for streaming data. Technometrics 53 (4):379–89. doi:10.1198/TECH.2011.10069.
- Scholkopft, B., and K.-R. Mullert. 1999. Fisher discriminant analysis with kernels. Neural Networks for Signal Processing IX 1:1.
- Stephens, D. A. 1994. Bayesian retrospective multiple-change point identification. Journal of the Royal Statistical Society Series C-Applied Statistics 43:159–78.
- Tech, P. S., S. Yue, and A. B. J. Teoh. 2012. Feature fusion approach on keystroke dynamics efficiency enhancement. International Journal of Cyber-Security and Digital Forensics (IJCSDF) 1 (1):20–31.
- Umphress, G., and D. Williams. 1985. Identity verification through keyboard characteristics. International Journal of Man-Machine Studies 23 (3):263–73. doi:10.1016/S0020-7373(85)80036-5.
- Venables, W. N., and B. D. Ripley. 2013. Modern applied statistics with S-PLUS. Springer Science & Business Media.
- Zou, C., and F. Tsung. 2010. Likelihood ratio-based distribution-free ewma control charts. Journal of Quality Technology 42 2:( Apr):174–96. doi:10.1080/00224065.2010.11917815.