
ABSTRACT
This paper presents an enrollment management model by applying artificial neural network (ANN). The aim of the research, which has been presented in this paper, is to show that ANNs are more successful in predicting than the classical statistical method – regression analysis (logistic regression). Both predictive models, no matter whether they are based on ANNs or logistic regression, offer satisfactory predictive results, and they can offer support in the decision-making process. However, the model based on neural networks shows certain advantages. ANNs demand understanding of functional connection between independent and dependent variables in order to evaluate the model. Also, they adapt easily to related independent variables, without the appearance of the problem of multicollinearity. In contrast to logistic regression, neural networks can recognize the appearance of nonlinearity and interactions in input data, and they can react on time.
Introduction
Artificial neural networks (ANNs) belong to the group of intelligent tools for data analysis with the purpose of solving the problem of approximation, classification, and prediction. Today, neural networks have a wide range of application in different fields (Gerasimovic Citation2012): “they can be realized as software or hardware systems, which strive to find the connection between input and output model variables from the existing model most frequently by iterative approach and to give the value of the output for new input data.” ANNs are used intensely in many disciplines for modeling complex problems (Liao and Wen Citation2007). The application of neural networks has been noted so far in the domains of productive technologies, finances, as well as in sociological research and in every domain where disorganized input data are used and whose interpersonal relations are influenced by different factors. A few researches point out to the advantages of using neural networks in comparison to traditional statistical models (Baker and Richards Citation1999; Flitman Citation1997; Gonzalez and Des Jardins Citation2002; Hardgrave, Wilson, and Walstrom Citation1994), such as: ability to work with nonstructured input data, ability of parallel data analysis and ability to learn (Garson Citation1998).
In the category of educational research, neural networks are most frequently used for solving the problems of prediction and classification. Prediction is presented by previous values of a system’s state, as well as current and previous input values, which form pairs with the future system’s states (Miljkovic Citation2003), whereas classification in the mentioned literature is treated as the set of inputs which form pairs with the specified class.
Survey and systematization of existing works, methods, and models of operational research in the field of predicting and decision-making in the process of managing students’ enrollment point out that the development of different prediction models, optimization models, and decision-making (Camarena-Alvarado Citation2010; Chang Citation2006; Gerasimovic, Bugaric, and Bozic Citation2016; Gerasimovic et al. Citation2011; Herzog Citation2006; Thanh and Haddawy Citation2007; Wook et al. Citation2009) has been successfully solved, most frequently by applying ANNs, and by regression analysis (logistic regression), as well as by combining different techniques of “data mining”. Neural networks note a significant success in solving the problem of prediction, approximation of functions, classification and recognition of samples (Miljkovic et al. Citation2011), and they were shown as a more accurate prediction technique in comparison to standard statistical methods (Camarena-Alvarado Citation2010; Chang Citation2006).
Structure of ANNs
There are more definitions of ANNs. According to Necht-Nielsen (Necht-Nielsen Citation1989), artificial networks are distributed, adaptable, and in general nonlinear systems built from large numbers of different processor elements, that is, neurons. In general sense, neural networks present a group of simple, processing elements-neurons, mutually connected by bonds with suitable weight relations (Miljkovic Citation2003).
Interconnectedness of neurons determines the network’s architecture. Every neural network has input and output layers, whereas in some architectures of neural networks hidden layers are encountered. The general structure of a neural network can be presented as an oriented graph, whose knots are neurons, while the directions of signal flow are presented by arrows ().
Figure 1. General structure of the artificial neural network.
Neural networks are based on neuron-biological bases of the human brain, which, with the help of brain neural cells (neurons), accomplish many intelligent functions. Neural networks simulate the manner of human brain functioning during the accomplishment of a task or function. That similarity is mirrored in the following:
• neural network acquires knowledge through the process of training;
• weights of inter-neural bonds (the strength of synapses) serve for memorizing knowledge.
Ability of neural network data analysis is the consequence of accomplished strength of bonds between neurons. It is achieved through the process of adaptation or through the set of examples for learning (Russell and Norvig Citation2002). Neural networks have the ability of adaptable behavior toward changes, through learning the input sample, which means that they can learn by copying between input and output signals, and to synthesize associative memory, which enables finding the appropriate output.
Generally, a neural network has three basic components: neuron, network’s topology, and the algorithm of learning. Additional components are: the size of a network (the number of levels – layers, the number of neurons in a layer), neuron functionality (input neuron operator, transmission factor, and activation function), training/validity, and implementation/realization.
The aim of the research, which has been presented in this paper, is to show that it is possible, by applying ANNs, to predict the number and structure of enrolled students at institutions of higher education, as well as to show that ANNs are more successful in predicting than the classical statistical method – regression analysis (logistic regression).
Logistic regression
Statistical forecasting methods are widely used, especially the method of regression analysis. The characteristic of the method of regression analysis is that the dependent variable, namely the forecasting value, is expressed as a mathematical function of one or more variables, predictive values, known in the time of forecasting (Hillier and Lieberman Citation2001). Logistic regression is a statistical method used to test models for prediction of categorical outcomes (dependent variable (y)), with two or more categories. Predictor i.e. the independent variable (x) could be categorical (discrete), continuous or a combination of both in the same model (Moore and McCabe Citation2004). One of the mathematical functions that best describe the connection between the independent variables and the probability of finding the variable in a particular category is represented by the following formula Eq. (1) (Moore and McCabe Citation2004):
where: p is the outcome probability of the dependent variable y, b0 represents logistic regression weights, and x is the value of the independent variable.
The odds ratio of the possibility or impossibility of occurrence of a certain event is usually presented as Eq. (2) (Moore and McCabe Citation2004):
The logistic regression is used for statistical modeling of the categorical dependent variable. Binary data are the most common form of categorical data.
The dependent variable takes values 0 and 1, depending on whether the observed event occurred or not. If the logistic model consists of the combination of continuous and categorical predictor values, which is the case analyzed in this paper, the functional dependence between the occurrence probability of the observed event and the mentioned independent variables is given in the form of Eq. (3):
The coefficients bj are derived from the categorical independent variables which have a total of n – k + 1; the factors cj,l have values 0 or 1; and their number (m) depends on the number of categories for each variable.
Predictive model
Higher education has an important role in economic and social development, and therefore all the changes and reform processes in that domain should lead to the improvement of the socioeconomic climate in one country. Higher education reform underlines the need for changing and specifying the role of universities and faculties in the enrollment management process. Previous reform activities of the world’s leading universities and faculties, as well as of the Serbian higher education system, indicate the importance of the management process reform as a key factor in improving both the quality of education and the scientific research at universities (Gerasimovic Citation2012). In that context, the existence of the Unique Education Information System (EIS) under the jurisdiction of the Ministry of Education and Science of the Republic of Serbia is of great importance in improving the process of enrollment management at higher education institutions in Serbia.
The constant development, implementation, and improvement of the EIS provide a more effective resource planning, resource management, and better monitoring of the activities in the educational system on all its management levels. The EIS enables data exchange between schools and municipalities, schools and the Regional School Ministry Administration, as well as school administration and the central level of the Ministry. Furthermore, the maximum possible data transfer automatization has been provided in the opposite direction, from the central level of the Ministry to the schools. The implementation of the EIS increases the efficiency and the effectiveness of the education system by managing the following activities: planning schools’ network, planning necessary teaching and nonteaching staff, financial planning, monitoring and controlling students’ achievements and schools’ performances.
The EIS is designed through the following program modules:
• students’ database;
• school employees’ database;
• inventory and schools premises database;
• financial module; and
• analytical software for simulation of the implementation of different education funding formulas (version of the application available in the Ministry).
In the focus of the research presented in this paper is the “students’ database”, which is an integral program module of the EIS. EIS database provides an important number of information regarding statistical data about students, students performances in different courses during their education (mid-term reports, reports at the end of the school year), as well as the information about their parents (the level of education, forms of employment, etc.). In order to select the required information from the mentioned EIS database, it is essential to determine the key factors of the graduate students’ professional choice. Based on those factors, a research on the sample of graduate student population has been conducted in order to gather baseline data needed to develop the predictive model. The implementation of this model of forecasting and decision-making will practically mean using the input data from the EIS database and generating the output data that can help higher education institutions to predict the number of enrolled students and make enrollment decisions.
This paper compares the model for forecasting and decision-making based on logistic regression and the model based on neural networks, and it represents an integral part of the support system in decision-making ().
Figure 2. Support system for decision-making process.
The support system enables the accomplishment of the objectives defined by the strategic orientation of higher education institutions. The software support provides the efficiency of decision-making, ease of use, and adaptability.
Sample description
In order to develop the prediction model, a research has been conducted in two vocational schools (VET schools) in Belgrade on a sample of 159 students. The research was conducted on the higher education institutions of engineering, more specifically, the Faculty of Mechanical Engineering (FME) in Belgrade. The data collected from the EIS database of the 159 students are used as the starting values (nine input variables). The data collected in the survey on the same sample of students (experiment) are used as control values (three output variables) in the developing phase of the predictive models. The encoding mode of input and output variables and their descriptive statistics are presented in .
Table 1. Input and output variables.
Using the input data from the EIS database and the results obtained by the experiment, a model has been developed based on the ANNs and logistic regression, which can provide support in decision-making in the process of managing and forecasting the enrollment at higher education institutions of technical sciences.
Results – Comparative analysis
Two models of predicting have been developed (the model of ANNs and the model of logistic regression), and accuracy of the developed model has been established on the basis of results which were obtained by research. Qualitative and quantitative comparison of the developed model has been performed with the help of comparative analysis.
The designed model of neural networks, in which the set of inputs with the specified class forms pairs, treats the problem of classification. In other words, the produced model of neural network was taught to recognize which graduating pupils, in regard to their input characteristics (G, S2, S3, S4, ME, FE, MW, FW, FS) (), belong to the defined classes – output parameters (J, FME, OF). Use of neural networks model provides results of classification, or more precisely, predicted values for all three parameters simultaneously ()
Table 2. The results of classification models of neural networks.
In contrast to the model of neural networks, the logistic regression model demands special analyses of prediction for each output parameter individually, which could be observed as its disadvantage. The advantage of neural networks is in the fact that they give prediction for all three outcomes, whereas when applying the logistic regression, three models must be generated for each output individually.
For developing the predictive enrollment model, for the target group of higher education institutions of technical sciences, is important to distinguish the results of prediction of enrollment at FME in Belgrade from the other possible options (J, OF). In another words, to predict the number of students in the population who will opt for FME.
Taking into consideration the results which were obtained with the help of the predictive model of logistic regression (), it has been noticed that the model of neural networks predicts the enrollment at the observed faculty significantly better (80%) in comparison to the model of logistic regression, which classifies precisely 63.6% of cases.
Table 3. The results of classification models of logistic regression (FME).
In order to perform a complete comparative analysis, it is necessary to develop two more models of logistic regression according to outputs: job (J) and continuation of schooling at some other faculty (OF). Only then is it possible to perform qualitative and quantitative comparison of the results obtained using the model of a multilayered perceptron with three outputs (the model of ANNs) and the values of prediction of all three models of logistic regression.
The results of predicting the model of logistic regression for the dependent variable – the continuation of schooling at some other faculty – have been presented in .
Table 4. Prediction of the logistic regression model for OF.
The results of the model of logistic regression, with which one predicts the number of graduating pupils who decide to work after graduation, are given in .
Table 5. Prediction of logistic regression model for J.
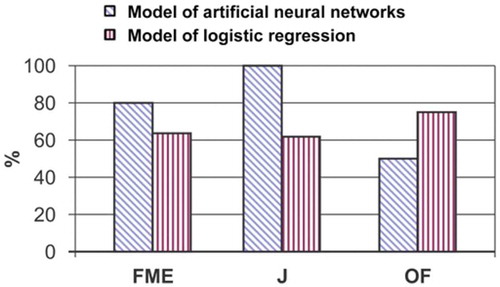
Taking into consideration the results which were obtained with the help of all three predictive models of logistic regression, it has been noticed that the model of neural networks, besides the fact that it predicts the enrollment at The FME significantly better, shows a better prediction of the number of graduating pupils who decide to work (100%), whereas the model of logistic regression is more precise when classifying students who continue schooling at some other faculty (75%). A parallel presentation of prediction for all three outputs which were obtained with one model of ANNs on one side, and that obtained with the help of three complementary models of logistic regression on the other side has been presented in .
Figure 3. Prediction of all three outcomes (ANN model).
The analysis of input variables’ significance for the graduating pupils’ decision-making about the enrollment at The FME has been performed in both models – neural networks and logistic regression. Parallel results of significance of input variables for the output FME have been presented in .
Figure 4. Significance of input variables for the output FME.
Success in the fourth grade is the input variable, which has the strongest influence on the observed output (FME) both in the model of neural networks and in the logistic regression model. In the model of neural networks, this variable has the greatest relative influence on the classification of the output of enrollment at The FME (34%), whereas the influence of other predictors is significantly lesser (FE – 17%, FW – 15.5%) (). In the logistic regression model, the contribution of success in the fourth grade to the enrollment at The FME is the greatest and its probability quotient amounts to 5.159 (37.3%), where the given value presents the size of the change of the output value if the input value changes for one unit. The other input variables, according to their size and significance, are: FS – 26.2%; S3 – 8.8%; G, S2, MW, ME, FW, FE – 27.7% ().
As far as the model of neural networks is concerned, the second variable, according to significance, is father’s education, and immediately after that is the father’s working status, whereas in the logistic regression model, the second variable, according to the strength of influence, is the financial support for the continuation of schooling, and then success in the third grade.
Conclusion
Both predictive models, whether based on ANNs or logistic regression, offer satisfactory predictive results and can offer support in the decision-making process. However, the model which is based on neural networks shows certain advantages. ANNs demand understanding of the functional connection between independent and dependent variables in order to evaluate the model. Also, they adapt easily to related independent variables, without the appearance of problem of multicollinearity. In contrast to logistic regression, neural networks can recognize the appearance of nonlinearity and interactions in input data and they can react on time.
It is necessary to emphasize significant contribution of this research, which is mirrored in the fact that we have presented the practical application of the model of ANNs in situations when it is necessary to predict as many outcomes as possible with the help of one model. Statistical method – logistic regression – demands the generation of separate models for each desired outcome, which can be considered as its shortcoming, especially when quick analysis and conclusion are necessary. Obtained results shows that one neural networks model better predicts two of three output variables (FME, J) than separate, specially designed for required output, logistic regression model.
Besides the above-mentioned advantages, ANNs showed certain disadvantages in comparison to the logistic regression method. Neural networks have a problem when determining the measure of connectedness and the influence of independent and dependent variables. However, networks do not recognize, for individuals who decide to enroll FME, how their choice depends on input variables. In that sense, neural network provides information with regard to which input variables have significant influence on the output. On the other hand, the logistic regression model, through the probability quotient, exactly shows the size of change of the input variable if the input variable changed for one unit of measure.
By realizing the contrasting analysis of the results which were obtained by the models of neural networks and logistic regression, it can be concluded that it is possible to find the rules for decision-making about the choice of certain architecture of ANNs depending on the nature of data in the sample and whether neural networks are more successful in predicting in comparison to the traditional statistical method – logistic regression. The application of the developed analytical model for prediction of enrollment with the help of ANNs has been supported by the Unique Education Information System (EIS), which contains all necessary input variables for the generated model in “students’ data base”. EIS is under the jurisdiction of The Ministry of Education and Science of The Republic of Serbia.
References
- Baker, B. D., and C. E. Richards. 1999. A comparison of conventional linear regression methods and neural networks for forecasting educational spending. Economics of Education Review 18 (4):405–15.
- Camarena-Alvarado, L. M. 2010. Scholarship allocation: An optimization model for enrollment management. Graduate Faculty of Texas Tech University, Lubbock.
- Chang, L. 2006. Applying data mining to predict college admissions yield: A case study. New Directions for Institutional Research 131:53–68.
- Flitman, A. M. 1997. Towards analysing student failures: Neural networks compared with regression analysis and multiple discriminate analysis. Computers & Operations Research 24 (4):367–77.
- Garson, G. D. 1998. Neural networks: An introductory guide for social scientists. London: Sage Publications.
- Gerasimovic, M. 2012. Contribution to development of methodology for prediction and decision-making by applying artificial neural networks. Faculty of Mechanical Engineering Belgrade University, Belgrade.
- Gerasimovic, M., L. Stanojevic, U. Bugaric, Z. Miljkovic, and A. Veljovic. 2011. Using artificial neural networks for predictive modeling of graduate’s professional choice. The New Educational Review 23 (1):175–89.
- Gerasimovic, М., U. Bugaric, and M. Bozic. 2016. Enrollment management: Development of prediction model based on logistic regression. FME Transactions 4 (1):92–98.
- Gonzalez, J. M., and S. L. Des Jardins. 2002. Artificial neural networks: A new approach to predicting application behavior. Research in Higher Education 43 (2):235–58.
- Hardgrave, B. C., R. L. Wilson, and K. A. Walstrom. 1994. Predicting graduate student success: A comparison of neural networks and traditional technique. Computers & Operations Research 21 (3):249–63.
- Herzog, S. 2006. Estimating student retention and degree-completion time: Decision trees and neural networks Vis-à-Vis regression. New Directions for Institutional Research 131:17–33.
- Hillier, F. S., and G. J. Lieberman. 2001. Introduction to operations research. New York: McGraw Hill.
- Liao, S. H., and C. H. Wen. 2007. Artificial neural networks classification and clustering of methodologies and applications – Literature analysis form 1995 to2005. Expert Systems with Applications 32 (1):1–11.
- Miljkovic, Z. 2003. Sistemi veštačkih neuronskih mreža u proizvodnim tehnologijama. Belgrade: Mašinski fakultet Univerziteta u Beogradu.
- Miljkovic, Z., M. Gerasimovic, L. Stanojevic, and U. Bugaric. 2011. Using artificial neural networks to predict professional movements of graduates. Croatian Journal of Education 13 (3):117–41.
- Moore, D. S., and G. P. McCabe. 2004. Introduction to the practice of statistic. New York: WH Freeman & Co.
- Necht-Nielsen, R. 1989. Neurocomputing. Boston: Adison-Wesley Publishing Company.
- Russell, S. J., and P. Norvig. 2002. Artificial intelligence, a modern approach, 2nd ed. New York: Prentice Hall.
- Thanh, L. V., and P. Haddawy 2007. Deriving financial aid optimization models fromadmissions data. Frontiers In Education Conference – Global Engineering: Knowledge Without Borders, Opportunities Without Passports, FIE ‘07. 37th Annual, Milwaukee, Wisconsin F2A-7-F2A-12.
- Wook, M., Y. H. Yahaya, N. Wahab, M. R. M. Isa, N. F. Awang, and H. Y. Seong 2009. Predicting NDUM student’s academic performance using data mining techniques. Second International Conference on Computer and Electrical Engineering (ICCEE), Dubai, UAE.