
ABSTRACT
Machine learning techniques have been widely applied to solve the classification problem of highly dimensional and complex data in the field of bioinformatics. Among them, Bayesian regularized neural network (BRNN) became one of the popular choices due to its robustness and ability to avoid over fitting. On the other hand, Bayesian approach applied to neural network training offers computational burden and increases its time complexity. This restricts the use of BRNN in an on-line machine learning system. In this article, a Bayesian regularized neural network decision Tree (BrNdT) ensemble model, is proposed to combat high computational time complexity of a classifier model. The key idea behind the proposed ensemble methodology is to weigh and combine several individual classifiers and apply majority voting decision scheme to obtain an efficient classifier which outperforms each one of them. The simulation results show that the proposed method achieves a significant reduction in time complexity and maintains high accuracy over other conventional techniques.
Introduction
Bioinformatics is one of the interdisciplinary fields which develop algorithms and methods for analyzing biological data to produce meaningful information (Christopher et al. Citation2009). During past few decades, in the area of feature-based classification, binary classification problems have been studied extensively but multi category classification has its own importance. Research also shows that multi-class classification is much complex than binary classification and accuracy of classifier drops significantly as the number of classes increases. In literature, various multi-class classifier algorithms have been devised by researchers such as decision tree (DT) (Asria et al. Citation2016; Patil, Joshi, and Toshniwal Citation2010), artificial neural network (ANN) (Thein and Tun Citation2015), support vector machine (SVM) (Bazazeh and Shubair Citation2017; Barale and Shirke Citation2016; Megha. and Pareek Citation2016; Salama, Abdelhalim, and Zeid Citation2012), and Bayesian regularized artificial network (BRNN) (Burden and Winkler Citation2008).
Figure 3. Structure of majority voting ensemble.
Figure 4. Proposed ensemble framework for classifier.
Figure 5. Performance comparison of classification accuracy in various schemes.
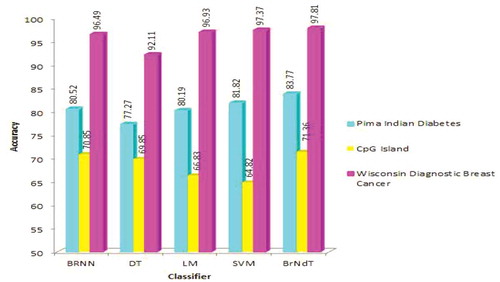
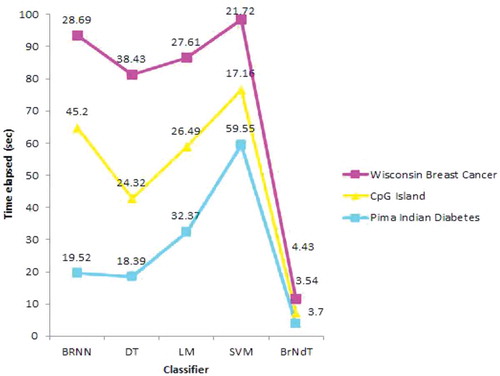
Figure 6. Performance comparison of time complexity involved in various classifiers.
DT algorithm (Patil, Joshi, and Toshniwal Citation2010) is a simple and widely used classification scheme. The principle of DT classifiers is based on a series of test questions and conditions in a tree structure. In general, DTs are robust to outliers but due to their tendency to over fit, they are much prone to sampling errors. DTs do not offer good results if sampled training data is somewhat different than scoring or evaluation data. ANN model offers an attractive solution for a direct multi-category classification problem (Thein and Tun Citation2015; Mishra and Zaheeruddin Citation2010a, Citation2010b). Neural networks can also be adapted easily to produce continuous variables instead of discrete class labels. This helps to predict the level of the variables used rather than to classify the samples into two or more categories. However, conventional neural networks usually provide lower classification accuracy due to its tendency to get stuck in local minima.
Contrary to ANN, SVMs deliver a unique solution and is also known as a large-margin classifier. The major objective of SVM is to find a decision boundary between two classes that remains maximally far from any point in the training data set. Though, SVMs are inherently two-class classifiers but can also be extended to a task of multiclass classification. One of the major limitations of support vector approach lies in the choice of optimum kernel. Size of SVMs network also restricts its performance, both in training and testing phase. SVMs also offer high algorithmic complexity and extensive memory requirements due to its quadratic programming in large-scale tasks.
Bayesian regularized artificial neural networks (BRANNs) (Burden and Winkler Citation2008) are more robust than standard Neural Network models based on back-propagation algorithm. Bayesian regularization converts a nonlinear regression into a “well-posed” statistical problem mathematically through a process of a ridge regression. These models also provide a less complex validation process as compared to normal regression methods such as back propagation algorithm. Moreover, BRANN uses objective Bayesian criterions to stop training which eliminates the possibility of over train and overfit of the network. The major limitation of these networks is the calculation, storage and inversion of Hessian matrices during training phase.
Therefore, it is the need of research to design a time efficient algorithm, which not only offers high accuracy but also outperform other equivalent classifiers based on its training speed and computational complexity. Motivated by this research gap, in this paper, an effort has been initiated to design a Bayesian regularized neural network decision Tree (BrNdT) ensemble mode classifier.
The rest of the paper is organized as follows: Section 2 presents popular existing models with their basic principles. Section 3 describes proposed methodology used in paper. The results and evaluation are discussed in Section 4. Finally, conclusion and future work are given in Section 5.
Existing models
Bayesian regularized neural networks (BRNN)
Bayesian regularization is a mathematical technique which converts a non-linear regression into a statistical well posed problem. The Bayesian regularized neural network is robust in nature (Burden and Winkler Citation2008). The Bayesian scheme for neural networks is developed on the probabilistic interpretation of network parameters. Bayesian approach includes a probability distribution of network weights. Bayesian approach resolves the over fitting problem. The complex models are also penalized in Bayesian approach (Kayri Citation2016). BRNN is the linear combination of ANN and Bayesian methods to determine the optimal regularization parameters. It involves imposing specified prior distributions on the parameters of model. shows the dataflow diagram of BRNN algorithm. In Eq. (1), term is used to anticipate a better generalization and smooth mapping (Okut Citation2016).
Figure 1. Data flow diagram of BRNN algorithm.
whereis sum of squared estimation errors, M is ANN Architecture and
denotes sum of squares of architecture weights.
and
are regularization parameters also called objective function parameters. The term
represents the weight decay, where
is the weight decay coefficient. To decrease the tendency of overfitting,
should have smaller values.
Eq. (1) involves tradeoff between goodness of fit and model complexity. When then it produces a smoother network response at the expense of goodness of fit.
Decision tree (DT)
DT is a well-known classification method also known as Classification Tree. A DT comprises of a set of internal and leaf nodes. The internal nodes are linked with a splitting criterion, consisting of a splitting attribute and splitting predicates defined on that splitting attribute. The leaf nodes are labeled using a single class label.
DT has various advantages which makes its performance outstanding from several other algorithms. DT don’t require any input parameter, and its construction technique is relatively fast. Moreover the results are also interpretable (Asria et al. Citation2016). DTs also provide the scalability features for large datasets. DT can classify both numerical and categorical data.
Linear regression (LR)
Regression is one among the common techniques used for prediction. Regression is one of the popular techniques used for prediction. Linear regression performs prediction for dependent variable by determining relationship between independent and dependent variables (Mehra Citation2003). The graphical relationship between variables can be easily represented by regression model. Mathematical representation of Regression model can be described as follows (Weiss and Kulikowski Citation1991):
where i ranges from . T represents transpose of
which is usedto determine the inner product between
and
.
By the combination of n in above equations, it can be written in the vector form as:
where is a dependent variable, and
is an independent variable,
represents regression coefficients, that are p-dimensional parameter vectors and
represents errors term. Numerous attributes provided in the datasets are taken as independent variables and output (sick/healthy) is considered to be dependent variable.
Support vector machine (SVM)
Support Vector Machine is supervised learning algorithm suggested by Vapnik. SVM is used for classification and regression tasks (Salama, Abdelhalim, and Zeid Citation2012). It is a binary classifier which separates the data by creating a margin hyper-plane. The kernel function is used for separation of dataset which is non-linear in nature. The SVM is represented by the following:
where depicts the problem to be classified and
represents maximum margin hyper plane. The data points are called support vectors.
In , d is a positive integer value and depicts the degree of kernel. Here σ is a real positive value.
Table 1. Types of kernel with its equations.
Proposed methodology
Ensemble classifier
In data mining, each classifier performs prediction based on its supervised learning. In the field of machine learning, ensemble methods were first invented a decade back. The ensemble classifiers weigh several individual classifiers and then fuse them together in order to achieve obtain the results which transcend every individual classifier, and as shown in . The ensemble classifier has better prediction accuracy and classification performance than individual classifiers (Polikar Citation2006).
The proposed research converges on the classifiers such as for instance DT, Bayesian regulatory neural network, and linear regression to form ensemble classifier.
Majority voting
The technique of classifying the unlabeled instances, based on the high frequency vote (or the highest number of votes) is coined as majority voting or plurality voting (PV). Three classifiers namely DT, Bayesian regularized neural network and linear regression combine to form majority voting scheme which is used to predict the class of unlabeled diabetes instances. Majority voting ensemble structure is depicted in . Mathematically, it can be represented as (Rokar Citation2010).
Figure 2. Ensemble framework.
where the classification of the classifier is denoted by
and
is an indication function defined as
A crisp classification can be obtained in the case of probabilistic classifier by following formula
in which classifier is represented by and the probability of class c is represented by
for an instance
.
Algorithm for majority voting ensemble and probability of correct labeling
Require:
D: Training dataset
L: Learning algorithm
W: Labels of training dataset
N: Number of Learning algorithm used
d: Output of Classifier
Do n = 1:N
1. Initialize Ln for every Dn .
2. Compare Wn with dn generated from Ln, and update vote.
3. Plurality results in a decision as a output from ensemble.
End
Selection of data base
In this paper three standard datasets are selected to verify robustness of the proposed scheme. The three datasets namely a) Pima Indian Diabetes, b) CpG island, c) Wisconsin Diagnostic Breast Cancer, represent three different real world classification problems available at UCI repository. The detail of datasets used is shown in .The datasets contain the feature space that distinguishes healthy and sick individuals into two classes. Each dataset has different various sets of attributes and data types. For every evaluation, constant proportion of training examples is randomly selected and verified on the testing set.
(a) Pima Indian Diabetes data can be obtained from UCI repository of machine learning:(https://archive.ics.uci.edu/ml/datasets/pima+indians+diabetes)
Table 2. Dataset employed in the experiment.
The database is created in National Institute of Diabetes and Digestive and Kidney Diseases. Several constraints were adopted on the selection of these instances from a larger database. In particular, all patients here are females at least 21 years old of Pima Indian heritage. The various attributes of Pima Indian Diabetes data set is listed in .
(b) Cpg Island dataset methylation defines the status of human chromosomes. The dataset is referred from BioMed Central Bioinformatics (Christopher et al. Citation2009). The dataset has 38 attributes which belong to four distinct categories namely i) CGI specific attributes (including G + C content, CpG cluster p-value, Observed/Expected ratio), ii) Repetitive sequences (eg. Number and type of repetitive elements, iii) Evolutionary Conservation (e.g. PhaseCon content), iv) Physiochemical and Structural Properties of DNA (includes twist, tilt, roll, rise, shift, slide).
Table 3. Description of attributes of pima Indian diabetes dataset.
The attributes of second dataset are shown in .
(c) Wisconsin Diagnostic Breast Cancer Data is made available at following link by William H. Wolberg University of Wisconsin Hospital.
https://archive.ics.uci.edu/ml/datasets/Breast+Cancer+Wisconsin+(Diagnostic)
Table 4. Description of attributes for CpG Island dataset.
It has two classes with 569 instances i.e. 357 benign and 212 malignant. It has 10 variables consisting of cellular characteristics computed from digitized image of breast fine needle aspirate. The standard error, mean and worst of these attributes were computed for every image, which results in 30 features. The real valued attributes collected from the following link and listed in . https://bigml.com/user/czuriaga/gallery/dataset/51794b29ce5680176800031e
Table 5. Description of attributes for wisconsin diagnostic breast cancer dataset.
Results and discussion
The proposed ensemble framework for classifier is shown in and tested on three standard data to establish its robustness. The training phase simulation of BrNdT model has been done with 70% data for training and 30% data for testing. The existing algorithms are also simulated with same standard datasets and their performance metrics are recorded for comparison.
The performance analysis of each model is measured in terms of accuracy and time complexity.
Accuracy is one of the important performance parameters of any classification scheme, since it aids in predicting the correct class and can lead to accurate diagnosis of the patients. A performance comparison of classification accuracy of various classifier schemes is shown in . The speed (Computing time) of the classifier also plays an important role. A classifier with smaller accuracy might be preferred over the higher one if shows significant smaller time complexity. shows the comparison of time complexity performance involved in various classifiers.
Other performance parameters such as sensitivity and specificity of the classifier are evaluated from confusion matrix. Confusion matrix consists of two categories of class namely actual and predicted class. The actual classis determined through angiographic method whereas predicted class is simulated through algorithms.
In confusion matrix, four parameters of actual class called True Positive (TP), True Negative (TN), False Positive (FP), and False Negative (FN) are evaluated and listed in .
Table 6. Confusion matrix.
The parameter TP represents the count of instances of Class C1 which are correctly classified as C1 and TN is the count of instances of Class C2 which are correctly classified as C2. Similarly, FN is the count of instances of Class C1 which are falsely classified as C2 and FP represents the count of instances of Class C2 which are falsely classified as C1. The calculated values of Confusion matrix are given in , and .
Table 7. Confusion matrix for pima indian diabetes dataset.
Table 8. Confusion matrix for cpg island dataset.
Table 9. Confusion matrix for breast cancer dataset.
Based on the parameters used in Confusion Matrix, the performance metric such as sensitivity, specificity, and accuracy are evaluated as given in and .
Table 10. Sensitivity and specificity for various classifiers using different datasets.
Table 11. Accuracies and time complexity using various classifiers on different dataset.
The results are correlated by computing statistical measures such as accuracy and time complexity listed in . From the analysis done on the above said datasets, it has been found that SVM has better accuracy than DT, Linear Regression and Bayesian regularized Neural Networks. Now Ensemble classifier is designed by using DT, Linear Regression and Bayesian Regularized Neural Networks and the performance measures of Ensemble Classifier are compared with that of the SVM. It has been found that Ensemble Classifier performs best than SVM.
BrNdT has increased the accuracy as well as reduces time complexity to a great extent. So overall it can be analyzed that Ensemble classifiers perform better than individual classifiers in the binary classification.
Conclusions &future scope
An ensemble based Bayesian regularized Neural network decision Tree (BrNdT) model has been proposed for binary classification. The proposed model is tested on three different standard datasets to validate its robustness. The simulation results show that the proposed scheme not only offers a better accuracy but reduces the time complexity of the model significantly compared to other existing methods. In real life multi-category class problems are more challenging and complex to solve. The work can be extended to design a multi-category class classifier model in future.
References
- Asria, H., H. Mousannifb, M. HassanAl, and N. Thomas. 2016. Using machine learning algorithms for breast cancer risk prediction and diagnosis. Procedia Computer Science 83:1064–69. doi:10.1016/j.procs.2016.04.224.
- Barale, M. S., and D. T. Shirke. 2016. Cascaded modeling for PIMA Indian diabetes data. International Journal of Computer Applications 139 (11). doi: 10.5120/ijca2016909426.
- Bazazeh, D., and R. Shubair. 2017. Comparative study of machine learning algorithms for breast cancer detection and diagnosis, International Conference on Electronic Devices, Systems and Application: 2159–2055. doi: 10.1109/ICEDSA.2016.7818560.
- Burden, F., and D., Winkler. 2008. Bayesian regularization of neural networks. 23–42. New York, US: Artificial neural networks Humana Press. PubMed: 25–44.
- Christopher, Oscar, Igor, Val, and C. Del. 2009. Profile analysis and prediction of tissue-specific CpG island methylation classes. BioMed Central Bioinformatics 10. doi:10.1186/1471-2105-10-116.
- Kayri, M. 2016. Predictive Abilities of Bayesian Regularization and Levenberg-Marquardt algorithms in Artificial neural networks: A comparative empirical study on social data. Mathematical and Computational Applications Journal. 21 (2): 1–11.
- Megha., R., and V. Pareek. 2016. Hybrid approach to predict breast cancer using machine learning techniques. International Journal of Computer Science Engineering 5(3):125–36.
- Mehra, A. 2003. Statistical sampling and regression: Simple linear regression, PreMBA analytical methods. New York, US: Columbia business school and Columbia University.
- Mishra, A., and Zaheeruddin. 2010a. Design of fuzzy neural network for function approximation and classification. IAENG International Journal of Computer Science 37(4):326–40.
- Mishra, A., and Zaheeruddin. 2010b. Design of Hybrid Fuzzy neural network for function approximation. Journal of Intelligent Learning Systems & Applications 2:97–109. doi:10.4236/jilsa.2010.22013.
- Okut, H. 2016. Bayesian regularized neural networks for Small n Big p data, Artificial Neural Networks- Models and Applications. doi: 10.5772/63256.
- Patil, B. M., R. C. Joshi, and D. Toshniwal. 2010. Hybrid Prediction model for Type-2 diabetic patient, Expert Systems with Applications 10:8102-8108 . doi: 10.1016/j.eswa.2010.05.078.
- Polikar, R. 2006. Ensemble bases systems in decision making. IEEE Circuits System Magazine 6:21–45. doi:10.1109/MCAS.2006.1688199.
- Rokar, L. 2010. Ensemble based classifiers, Artificial intelligence review 33. 1–39. New York, US: Springer Netherlands. doi: 10.1007/s10462-009-9124-7.
- Salama, G. I., M. B. Abdelhalim, and M.-E. Zeid. 2012. Breast cancer diagnosis on three different datasets using multi-classifiers. International Journal of Computer and Information Technology 1:36–43.
- Thein, H. T., and K. M. M. Tun. 2015. An approach for breast cancer diagnosis classification using neural network. Advanced Computing: An International Journal 6 (1). doi: 10.5121/acij.2015.6101.
- Weiss, S. M., and Kulikowski. 1991. Computer systems that learn: Classification and prediction methods from statistics, neural nets, machine learning and expert systems. San Francisco, CA, USA: Morgan Kaufmann Publishers Inc.