
ABSTRACT
Biclustering in gene-expression data is a subset of the genes demonstrating consistent patterns over a subset of the conditions. Recently, the most of research in biclustering involving statistical and graph-theoretic approaches by adding or deleting rows and/or columns in the data matrix based on some constraints. This is an exhaustive search of the space, and hence the solutions may not be feasible. The proposed work finds the significant biclusters in large expression data using shuffled cuckoo search with Nelder–Mead (SCS-NM). The diversification and intensification of the search space are obtained through shuffling and simplex NM, respectively. The proposed work is tested on four benchmark datasets, and the results are compared with the swarm intelligence techniques and the various biclustering algorithms. The results show that there is significant improvement in the fitness value of proposed work SCS-NM. In addition, the work determines the biological relevance of the biclusters with Gene Ontology in terms of function, process and component.
Introduction
The DNA microarray analysis is a technology which enables the researchers to analyze the expression level of thousands of genes in a single reaction rapidly and in an efficient manner (Lockhart and Winzeler Citation2000). A typical DNA microarray analysis involves a multistep procedure which includes fabrication of microarrays by fixing properly designed oligonucleotides representing specific genes, hybridization of complementary DNA (cDNA) populations onto the microarray, scanning hybridization signals, image analysis and normalization of data. After a number of preprocessing steps, the low-level microarray analysis of a microarray can be represented as a numerical matrix. In this matrix, the rows represent different genes and columns represent experimental conditions. Each element of this matrix represents the expression level of a gene under a specific condition, and is represented by a real number. In gene-expression matrix, a common goal is to group the genes and conditions into subsets that convey biological significance. In its most common form, this task translates to the computational problem known as clustering.
However, clustering has some disadvantages (Madeira and Oliveira Citation2004). To overcome the problems associated with clustering, biclustering was proposed. Biclustering is a powerful analytical tool for the biologist. A biclusters is a submatrix of the gene-expression data matrix. The rows and columns in the submatrix need not be contiguous as in the gene-expression data matrix (Madeira and Oliveira Citation2004). The computation of biclusters is costly because one will have to consider all the combinations of columns and rows in order to find out all the biclusters. The search space for the biclustering problem is 2m+n where m and n are the number of genes and conditions, respectively. Usually m + n is more than 2000. Therefore, the biclustering problem is NP-hard (Divina and Aguilar-Ruiz Citation2006; Tanay, Sharan, and Shamir Citation2009). The problem of finding a coherent bicluster can be formulated as an optimization problem. For stochastic algorithms, in general, there are two types—heuristic and meta-heuristic—though their difference is small. Loosely speaking, heuristic means “to find” or “to discover by trial and error” (Julio and Michael Citation1997). This is good when we do not necessarily want the best solutions but rather good solutions which are easily reachable. The Nelder–Mead (NM) downhill simplex is an example of heuristic algorithm. Further development over the heuristic algorithms is the so-called meta-heuristic algorithms. All meta-heuristic algorithms use certain trade-off of randomization and local search. Randomization provides a good way to move away from local search to the search on the global scale. Therefore, almost all meta-heuristic algorithms intend to be suitable for global optimization (Christian and Andrea Citation2003).
This work develops and implements the biclustering based on the most popular and robust bio-inspired strategy cuckoo search (CS) (Yang and Deb Citation2009). An important advantage of CS algorithm is its simplicity. In fact, comparing with other population- or agent-based meta-heuristic algorithms such as particle swarm optimization and harmony search, CS has fewer parameters that need to be tuned before starting the search compared with other techniques (apart from the population size). Therefore, it is very easy to implement. In the conventional CS, each nest consists of a single egg and cuckoo imitates an egg using Levy flight. In the proposed CS algorithm, a nest contains a clutch (three eggs) instead of single egg. To avoid the premature convergence, the cuckoo imitates an egg using the NM (Nelder and Mead Citation1965) approach and to obtain near global optimum, the eggs within the nests are shuffled when the stagnation occurs. In this study, shuffled cuckoo search with Nelder–Mead (SCS-NM) is used for biclustering microarray gene-expression data. The remainder of this paper is organized as follows: Section 2 provides the problem statement. Section 3 gives related works in biclustering. The SCS-NM is illustrated in Section 4. Kennedy and Eberhart proposed a discrete binary version of binary particle swarm optimization (BPSO) for binary problems (Kennedy and Eberhart Citation1997). The shuffled frog leaping (SFL) algorithm is a memetic meta-heuristic that is designed to seek a global optimal solution by performing a heuristic search. It is based on the evolution of memes carried by individuals and a global exchange of information among the populations (Eusuff, Lansey, and Pasha Citation2006). Section 5 presents the detailed experimental setup and results for comparing the performance of the SCS-NM with the BPSO, SFL, CS and CS-NM.
Problem Statement
The gene-expression data can be shown as N × M matrix A of real numbers. Let G be a set of genes, C a set of conditions, and A(G,C) the expression matrix, where G = {1,2,…,m} and C = {1,2,…,n}. The element GExi,j of A(G, C) represents the expression level of gene ‘i’ under condition ‘j’. The objective of biclustering is to extract the submatrix A(G’, C’) of A(G, C), which is identified by gene subset G’ of G and condition subset C’ of C. In general, the problem can be defined as finding large sets of rows and columns such that the rows show unusual similarities along the dimensions characterized by columns and vice versa. The bicluster cardinality or volume of bicluster is simply the product of the number of genes and number of conditions in the bicluster. The main objective here is to identify the biclusters of maximum size with the minimum mean squared residue (MSR) (homogeneity) and maximum of row variance (nontrivial).
Review of Related Works
As we mentioned in the introduction of this paper, the biclustering problem is NP-hard (Tanay, Sharan, and Shamir Citation2009). For that reason, heuristic search algorithms are usually used to approximate the problem by finding suboptimal solutions. A number of biclustering techniques have been proposed in the literature for gene-expression data analysis. presents the merits and demerits of the various existing biclustering method.
Table 1. Review of related work in biclustering gene expression data.
Shuffled Cuckoo Search with Nelder-Mead
In general, the performances of the meta-heuristic algorithms are mainly dependent on two properties of the algorithm: diversification and intensification, also mentioned as exploration and exploitation (Yang et al. Citation2013). Although the basic CS algorithm demonstrates good global optimal search ability in optimization problems, it has the problem of premature convergence. Therefore, the CS is improved by balanced intensification and diversification. This paper proposes a variant CS called SCS-NM. The traditional CS considers single egg in a nest and a cuckoo lays one egg at a time by using Levy flight (Yang and Deb Citation2009). The proposed CS considers a clutch which contains three eggs in each nest. So the population is partitioned into several clutches which are evolved independently. To ensure that the evolution process is competitive, it is required to have higher probabilities that better solutions contribute to the next generation. The use of a triangular probability distribution ensures this fairness. The NM simplex algorithm, a direct search method, is used to generate the new solution. This strategy uses the information contained in the clutches to direct the evolution in an improved direction (Nelder and Mead Citation1965). Every new solution replaces the worst solution of the current clutch, rather than the worst solution of the entire population. This substitution ensures that every member has at least an opportunity to evolve before being discarded or replaced. Thus, none of the information contained in the nest is ignored. The intensification is caused by while using simplex method.
For high-dimensional data, the local minima has a severe effect on fitness function value so that the global minimum is not well approximated. The CS is said to be converge prematurely when the proposed solution approximates a local rather than global minimum. The objective of the proposed work is when the solutions have prematurely converged due to stagnation, it shuffles the eggs in a new search space. The purpose of shuffling is to increase the diversity of the population (Yang et al Citation2013). After the certain number of evolutions, the best solution does not change. The solution has converged to local optimum of the objective function. Therefore, shuffling has a good performance to solve the CS drawbacks. In this regard, all the best solutions (eggs) are sorted in an ascending order according to their fitness. Then, the eggs are partitions or shuffle into the nest, i.e. rank 1 goes to nest 1, rank 2 goes to nest 2, rank 3 goes to nest 3, rank 4 goes to nest 1 and so on. So, the new clutches are formed through this process of shuffling. This strategy helps to improve the solution by sharing the information and properties independently gained by each clutch. Therefore, avoid trapping the local optimal solution. The SCS-NM maintains the balanced intensification and diversification via the process of NM simplex and shuffling in the solution of the search space respectively. The Algorithm 1 for SCS-NM is given as follows:
Algorithm 1. Pseudo code for SCS-NM.
Fitness Function
In order to measure the coherence of bicluster, Cheng and Church (Citation2000) introduced the concept of the MSR. Let AIJ = (I, J) be a submatrix of A where I ∈ R and J ∈ C. AIJ contains only the elements aij belonging to the submatrix with set of rows I and set of columns J. The residue of an element aij in a submatrix AIJ equals
where aiJ is the mean of the ith row in the bicluster, aIj the mean of the jth column in the bicluster, and aIJ is the mean of all the elements within the bicluster. The quality of a bicluster can be evaluated by computing the MSR, i.e. the sum of all the squared residues of its elements is as per (2)
Low MSR value denotes strong coherence in the bicluster. This may include the trivial or constant biclusters where there is no fluctuation. These trivial biclusters may not be interesting but need to be revealed and masked so more interesting ones can be found. Cheng and Church used row variance as an accompanying score to find out trivial biclusters. The row variance can be represented in Equation (3) as follows:
Our goal is to obtain biclusters with the maximum number of genes and conditions and with the minimum value of f(I,J). The fitness function for obtaining bicluster is defined in Equation (4) as follows:
Experimental Results and Analysis
The proposed algorithm presented for the bicluster problem is coded in MATLAB R2012a and run on an Intel i3 3.7 GHz. The biclustering algorithm has been applied to four sets in order to study its performance, namely the yeast Saccharomyces cerevisiae stress expression data (Gasch et al. Citation2000), Arabidopsis thaliana expression data (Bleuler, Prelic, and Zitzler Citation2014), yeast Saccharomyces cerevisiae cell-cycle expression data (Cho et al. Citation1998) and rat Central Nervous System (CNS) expression data (Wen et al. Citation1998) are used. shows the description of dataset used in this paper. The parameters pa, α, and λ are set as 0.25, 1, and 1.5, respectively (Yang and Deb Citation2009). Through empirical analysis, the population size and the number of iterations are set as 20 and 200, respectively.
Table 2. Dataset description.
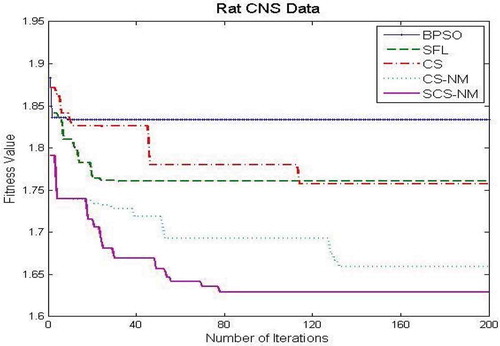
– show the fitness value obtained for Saccharomyces cerevisiae stress expression data, Arabidopsis thaliana expression data, yeast Saccharomyces cerevisiae cell-cycle expression data and rat CNS expression data, respectively. Through careful observation, it can be seen that SCS-NM fitness gets down rapidly in the initial stage of the evolution. The BPSO algorithm has premature convergence due to high stagnation. The SFL performs better on yeast stress expression data and the remaining three datasets CS give better performance than SFL. However, CS and SFL have roughly the same convergence speed. In addition, it is obvious to infer that SFL and BPSO get stuck at local optima quickly as can be seen from . For all the datasets, the proposed work SCS-NM outperforms all other algorithms because the exploration and exploitation are made with shuffling and simplex method. CS-NM performs better than BPSO, CS, and SFL. Moreover, SCS-NM converges to the global optimum rapidly. It frequently gives significant improvements in the first few iterations and quickly produces quite satisfactory results.
Figure 1. Plot of number of iterations versus fitness value for yeast stress data.
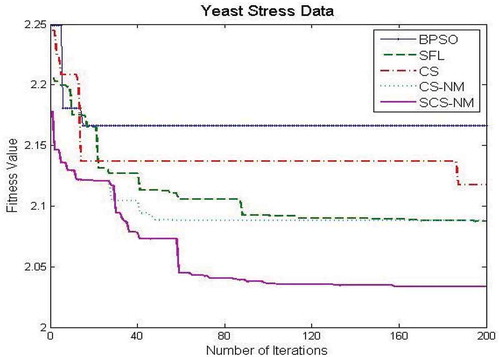
Figure 2. Plot of number of iterations versus fitness value for Arabidopsis thaliana data.
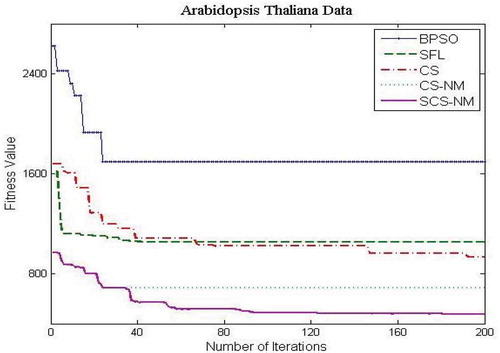
Figure 3. Plot of number of iterations versus fitness value for yeast cell-cycle data.
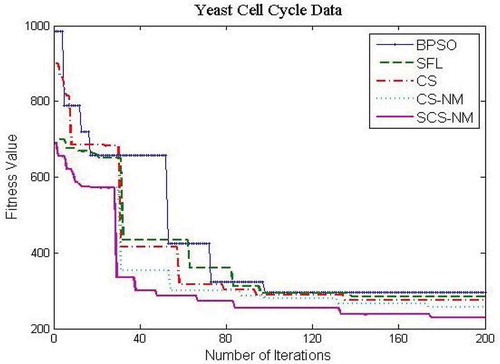
Figure 4. Plot of number of iterations versus fitness value for rat CNS data.
According to the problem formulation, the size of an extracted bicluster should be as large as possible while satisfying a homogeneity criterion. The bicluster should satisfy two requirements simultaneously. The expression levels of each gene within the bicluster should be similar over the range of conditions. That is, it should have a low MSR score. On the other hand, the bicluster gene variance should be high. The MSR represents the variance of the selected genes and conditions with respect to the homogeneity of the bicluster and gene variance removes the simple bicluster. To quantify biclusters, homogeneity and size should satisfy the coherence index (CI) which is used as a measure for evaluating their goodness (Mitra and Banka Citation2006). CI is defined as the ratio of MSR score to the size of the formed bicluster. shows the sample experimental results obtained for yeast Saccharomyces cerevisiae cell-cycle expression data and the biclusters are chosen randomly from 20 biclusters. In this table, the first column contains the label of each bicluster. The second and third columns report the number of rows (genes) and number of columns (conditions) of the bicluster, respectively. The fourth column reports the volume of the bicluster and the fifth column contains the MSRs of the biclusters. The sixth and seventh columns report the row variance and CI of the bicluster, respectively. The last column contains the fitness of the biclusters. The MSR maximum limit is 300. The largest size bicluster is found at MSR = 285.24, with CI being minimal and indicating the goodness of the discovered partitions. The minimum value of CI is 0.0219, with a corresponding size of 14,020 being the best in the table. As mentioned earlier, a low MSR indicates a high coherence of the discovered biclusters. shows clearly a small bicluster of size 8 × 5 for Arabidopsis thaliana data.
Table 3. Experiment results for Saccharomyces cerevisiae cell expression data.
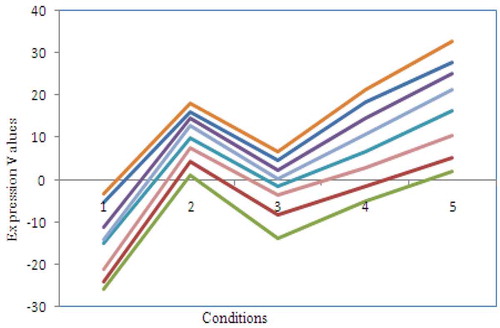
Figure 5. Plot of sample biclusters of size 8 × 5 for Arabidopsis thaliana data.
Comparative Analysis
shows a comparison summary of results obtained by various biclustering algorithms for the yeast cell-cycle dataset. The MSR value of biclusters obtained by all the algorithms listed in and the maximum limit is 300. The performance of SCS-NM is compared with flexible overlapped biclustering (FLOC), deterministic biclustering with frequent pattern mining (DBF), Cheng and Church (CC) and single-objective genetic algorithm (GA) on yeast cell-cycle dataset by Mitra and Banka (Citation2006) and the algorithm sequential evolutionary biclustering (SEBI) by Divina and Aguilar-Ruiz (Citation2006). FLOC uses a probabilistic approach to find biclusters. Even it extracts only half of the average volume of DBF for an average MSR of 187.44. DBF finds 100 biclusters, with half of these lying in the size range 2000–3000 and a maximum size of 4000. Similarly, CC algorithm gives a fractional volume of biclusters. Single-objective GA has also been used with local search to generate considerably overlapped biclusters. It is observed that a population size of 50 leads to the generation of a largest bicluster of size 1408. This is less than the bicluster size generated by all other algorithms. SEBI extracts only an average of 13 genes for average MSR of 205. On the other hand, it could find the biclusters of average genes are less than the set of conditions. Multi-objective evolutionary algorithm (MOEA gives maximum volume with the minimum MSR score. However, there is no overlapping carried out. Next CS method returns the largest bicluster; however, average MSR of CS is larger than MSR of MOEA. Eventually, the SCS-NM method extracts the largest bicluster of size 15,012 with average MSR of 229.15 as per the objective. In the case of SCS-NM, largest bicluster size as well as average volume is better than that of all other algorithms. Even so, MSR value is not better than that of all other algorithms because it extracts more than 60% average volume of FLOC. It is better than all other methods in all aspects except in the size of samples.
Table 4. Comparative analysis on yeast cell expression data.
Biological Analysis of Biclusters
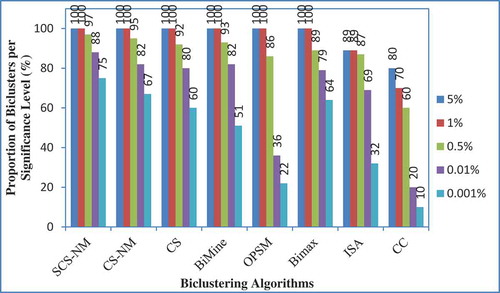
The proposed work determines the biological relevance of the biclusters found by SCS-NM on the Gasch yeast dataset in terms of the statistically significant GO annotation database. The degree of enrichment is measured by p values which use a cumulative hypergeometric distribution to compute the probability of observing the number of genes from a particular GO category (function, process, and component) within each bicluster. The p value is the probability that the genes are selected into the cluster by random. A small p value implies that the cluster is highly differed found by chance. The annotations of genes for three ontologies including biological process, cellular component, and molecular function are obtained. With the intention of evaluating the biological relevance of SCS-NM algorithm, the results of the proposed method are compared with CC, ISA, Bimax, OPSM and BiMine on yeast cell-cycle dataset from Ayadi, Elloumi, and Hao (Citation2009) by using web-tool of FuncAssociate (Berriz et al. Citation2003). The FuncAssociate computes the adjusted significance scores for each bicluster. Indeed, the adjusted significance scores assess genes in each bicluster by computing adjusted p values, which indicates how well they match with the different GO categories. Note that a smaller p value, close to 0, is indicative of a better match. represents the different values of significant p values for each algorithm over the percentage of total extracted biclusters. In fact with SCS-NM, 100% of tested biclusters have a p value = 5%. The same result is obtained with a p value of 1%. Finally, 75% of extracted biclusters with SCS-NM have a p value = 0.001%, while those of CS-NM and CS have 67% and 60%, respectively. We note that SCS-NM performs well for 0.001% p values compared to CC, ISA, Bimax and OPSM and it performs well for all cases of p value (p value = 5%, p value = 1%, p value = 0.5%, p value = 0.1%, and p value = 0.001%).
Figure 6. Plot of proportions of biclusters significantly enriched by GO annotations on yeast cell-cycle data.
Biological Annotation for Saccharomyces cerevisiae using GOTermFinder Toolbox
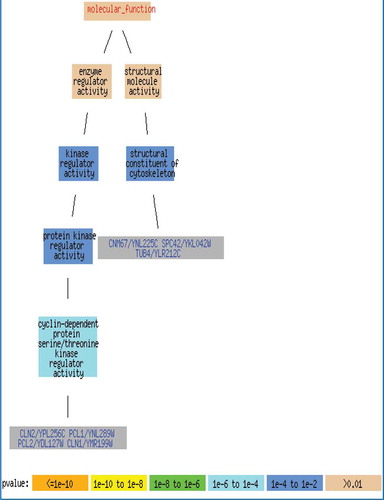
In order to identify the biological annotations for the biclusters, we use GOTermFinder which is tool available in the Saccharomyces Genome Database (SGD). GOTermFinder is designed to search for the significant shared GO terms of the groups of genes and provides users with the means to identify the characteristics that the genes may have in common. lists the significant shared GO terms used to describe the set of genes in each bicluster for the process, function, and component ontologies. Only the most significant terms are shown. For example, in the bicluster BC1, the genes are mainly involved in binding activity. The tuple (n = 517, p = 2.06 × 10⁻⁹) represents that out of 1487 genes in bicluster BC1, 517 genes belong to binding activity function, and the statistical significance is given by the p value of p = 2.06 × 10⁻⁹. shows the biological network of the bicluster with 10 genes; the false discovery rate (FDR) is very low (0.0003) and it is zero in many occasions. Further, the corresponding p value is very small (p = 0.00042) which shows that there is a very less probability to obtain the gene cluster in random. These results mean that the proposed SCS-NM biclustering approach can find biologically meaningful biclusters.
Table 5. Significant GO terms for three biclusters on Saccharomyces cerevisiae data.
Figure 7. Plot of Gene Ontology biological process of yeast cell-cycle data (10 genes).
Conclusions
In this work, SCS-NM algorithm for biclustering microarray gene-expression data is proposed. It focuses on finding maximum biclusters with lower MSR and higher gene variance. CS strategy is applied to find the optimal bicluster in which the exploration and exploitation of the search space are controlled and balanced through shuffling and simplex local search, respectively. Hence, SCS-NM outperforms the BPSO, SFL, CS-NM, and CS with Levy flight and the different biclustering methods. Moreover, the SCS-NM algorithm maintains its stochastic behavior capacity better than the BPSO and SFL algorithms while searching for the global optimum value. A qualitative measure of the formed biclusters with a comparative assessment of results are provided on four benchmark gene-expression datasets to demonstrate the effectiveness of the proposed method. Biological validation of the selected genes within the biclusters has been provided by publicly available GO consortium. The patterns present a significant biological relevance in terms of related biological processes, components, and molecular functions in a species-independent manner.
Related Research Data
References
- Angiulli, F., E. Cesario, and C. Pizzuti. 2008. Random walk biclustering for microarray data. Information Science 178 (6):1479–97. doi:10.1016/j.ins.2007.11.007.
- Ayadi, W., M. Elloumi, and J. Hao. 2009. A biclustering algorithm based on a bicluster enumeration tree: Application to DNA microarray data. BioData Mining 2:1–9. doi:10.1186/1756-0381-2-1.
- Ayadi, W., M. Elloumi, and J. Hao. 2012a. Pattern-driven neighborhood search for biclustering microarray data. BMC Bioinformatics 7:452–66.
- Ayadi, W., M. Elloumi, and J. Hao. 2012b. BicFinder: A biclustering algorithm for microarray data analysis. Knowledge Information System 30:341–58. doi:10.1007/s10115-011-0383-7.
- Ayadi, W., M. Elloumi, and J. Hao. 2014. A memetic algorithm for discovering negative correlation biclusters of DNA microarray data. Neurocomputing 145:14–22. doi:10.1016/j.neucom.2014.05.074.
- Ben-Dor, A., B. Chor, R. Karp, and Z. Yakhini. 2003. Discovering local structure in gene expression data: The order-preserving submatrix problem. Journal of Computational Biology 10:373–84. doi:10.1089/10665270360688075.
- Bergmann, S., J. Ihmels, and N. Barkai. 2003. Iterative signature algorithm for the analysis of large-scale gene expression data. Physical Review E 67:1–18. doi:10.1103/PhysRevE.67.031902.
- Berriz, G. F., O. D. King, B. Bryant, C. Sander, and P. Frederick. 2003. Charactering gene sets with FuncAssociate’. BMC Bioinformatics 19:2502–04. doi:10.1093/bioinformatics/btg363.
- Bleuler, S., A. Prelic, and E. Zitzler. 2014. An EA framework for biclustering of gene expression data. Proceeding Congress of IEEE on Evolutionary Computation 32:166–73.
- Blum, C., and A. Roli. 2003. Metaheuristics in combinatorial optimization: overview and conceptual comparison. Journal Acm Computing Surveys 35 (3):268–308. doi:10.1145/937503.
- Cheng, Y., and G. M. Church. 2000. Biclustering of expression data’. Proceedings of the Eighth International Conference on Intelligent Systems for Molecular Biology, Menlo Park, United States, 93–103.
- Cho, R. J., M. J. Campbell, E. A. Winzeler, L. Steinmetz, A. Conway, L. Wodicka, T. G. Wolfsberg, A. E. Gabrielian, D. Landsman, and D. J. Lockhart. 1998. A genome-wide transcriptional analysis of the mitotic cell cycle’. Molecular Cell 2:65–73.
- Christian, B., and Andrea, R. 2003. Metaheuristics in combinatorial optimization: Overview and conceptual comparison. Journal ACM Computing Surveys. 35 (3):268–308.
- Divina, F., and J. S. Aguilar-Ruiz. 2006. Biclustering of expression data with evolutionary computation. IEEE Transactions on Knowledge Data Engineering 18:590–602. doi:10.1109/TKDE.2006.74.
- Eusuff, M. M., K. Lansey, and F. Pasha. 2006. Shuffled frog-leaping algorithm: A memetic meta-heuristic for discrete optimization. Engineering Optimization 38:129–54. doi:10.1080/03052150500384759.
- Gasch, A. P., P. T. Spellman, C. M. Kao, O. Carmel-Harel, M. B. Eisen, G. Storz, D. Botstein, and P. O. Brown. 2000. Genomic expression programs in the response of yeast cells to environmental changes. Molecular Biology of the Cell 11:4241–57. doi:10.1091/mbc.11.12.4241.
- Julio, R., and Michael, W. 1997. An optimization-based econometric framework for the evaluation of monetary policy. NBER Macroeconomics Annual 1997, 12:297–361.
- Kennedy, J., and R. C. Eberhart. 1997. A discrete binary version of the particle swarm Algorithm, IEEE international Conference on Systems, Man and Cybernetics, Washington, United States, 5, 4104–8.
- Liu, J., Z. Li, X. Hu, and Y. Chen. 2009. Biclustering of microarray data with mospo based on crowding distance. Bioinformatics 10:1–12.
- Liu, X., and L. Wang. 2007. Computing the maximum similarity bi-clusters of gene expression data. BMC Bioinformatics 23:50–56. doi:10.1093/bioinformatics/btl560.
- Lockhart, D. J., and E. A. Winzeler. 2000. Genomics, gene expression and DNA arrays. Nature 405:827–36. doi:10.1038/35015701.
- Maatouk, O., W. Ayadi, H. Bouziri, and B. Duval. 2014. Evolutionary algorithm based on new crossover for the biclustering of gene expression data. Proceedings of the Ninth International Conference on IAPR Stockholm, Sweden, 48–59.
- Madeira, S. C., and A. L. Oliveira. 2004. Biclustering algorithms for biological data analysis: A survey. IEEE/ACM Transactions on Computational Biology and Bioinformatics 1:24–45. doi:10.1109/TCBB.2004.2.
- Mitra, S., and H. Banka. 2006. Multi-objective evolutionary biclustering of gene expression data. Pattern Recognition 39:2464–77. doi:10.1016/j.patcog.2006.03.003.
- Murali, T., and S. Kasif. 2003. Extracting conserved gene expression motifs from gene expression data. Pacific Symposium on Biocomputing, Boston University, United States, 77–88.
- Nelder, J. A., and R. Mead. 1965. A simplex method for function minimization. Computer Journal 7:308–13. doi:10.1093/comjnl/7.4.308.
- Prelic, A., Bleuler, S., Zimmermann, P., Buhlmann, P., Gruissem, W., and Hennig, L. 2006. A systematic comparison and evaluation of biclustering methods for gene expression data. Bioinformatics 22 (9):1122-1129.
- Roy, S., D. K. Bhattacharyya, and J. K. Kalita. 2013. CoBi: Pattern based co-regulated biclustering of gene expression data. Pattern Recognition 34:1669–78. doi:10.1016/j.patrec.2013.03.018.
- Saber, H. B., and M. Elloumi. 2015. Efficiently mining gene expression data via novel binary biclustering algorithms. Journal of Proteomics & Bioinformatics S9 (8). doi: 10.4172/jpb.S9-008.
- Tanay, A., R. Sharan, and R. Shamir. 2009. Discovering statistically significant biclusters in gene expression data. BMC Bioinformatics 18:136–44. doi:10.1093/bioinformatics/18.suppl_1.S136.
- Wang, Z., G. Li, and R. W. Robinson. 2016. UniBic: Sequential row-based biclustering algorithm for analysis of gene expression data’. Scientific Reports 6:23466. doi:10.1038/srep23466.
- Wen, X., S. Fuhrman, G. S. Michaels, D. B. Carr, S. Smith, J. L. Barker, and R. Somogyi. 1998. Large-scale temporal gene expression mapping of central nervous system development. Proceedings of the National Academy of Sciences 95:334–39. doi:10.1073/pnas.95.1.334.
- Yang, J., Wang, H., Wang, W., and Yu, P. 2003, ‘Enhanced biclustering on expression data’: proceedings of the Third IEEE Symposium on BioInformatics and BioEngineering, pp. 321-327.
- Yang, X., Deb, S., and Fong, S. 2013. Metaheuristic Algorithms: Optimal Balance of Intensification and Diversification.
- Yang, X. S., and S. Deb. 2009. Cuckoo search via Levy flights. Proceedings of World Congress on Nature & Biologically Inspired Computing 210–14.
- Yin, L., and Y. Liu. 2017. Ensemble biclustering gene expression data based on the spectral clustering. Neural Computing and Applications 28:1–14.