
 ?Mathematical formulae have been encoded as MathML and are displayed in this HTML version using MathJax in order to improve their display. Uncheck the box to turn MathJax off. This feature requires Javascript. Click on a formula to zoom.
ABSTRACT
Problem: Online higher education (OHE) failure rates reach 40% worldwide. Prediction of student performance at early stages of the course calendar has been proposed as strategy to prevent student failure.
Objective: To investigate the application of genetic programming (GP) to predict the final grades (FGs) of online students using grades from an early stage of the course as the independent variable
Method: Data were obtained from the learning management system; we performed statistical analyses over FGs as dependent variable and 11 independent variables; two statistical and one GP models were generated; the prediction accuracies of the models were compared by means of a statistical test.
Results: GP model was better than statistical models with confidence levels of 90% and 99% for the training testing data sets respectively. These results suggest that GP could be implemented for supporting decision making process in OHE for early student failure prediction.
Introduction
Online learning, also referred to as e-learning, virtual learning, or web-based learning, is instruction-facilitated and delivered through web platforms with the support of a mixture of applications and technologies and typically without face-to-face meetings (Allen I. and Seaman Citation2014).
To date, online learning has expanded into a variety of offerings through the use of several types of resources, applications, and technologies and it has grown rapidly in popularity (Hussar and Bailey Citation2013) and in the number of participants (OECD Citation2013).
Because of the flexible nature and characteristics of online education, higher education has incorporated this modal instruction into curricula. However, online higher education (OHE) faces high failure rates pointing to significant issues (Huang and Fang Citation2013) and actions for identifying and implementing improvements are needed and in a timely manner, for instance, the ability to accurately predict failure in the early stages of a course would make it possible to take quick remedial actions when needed.
Online courses are commonly supported by web technologies, such as learning management systems (LMS), which generate meaningful and relevant data produced daily by students, teachers, and administrators. The information that can be derived from these data provides the opportunity to analyze student performance (SP) by allowing detection of students at risk of failure, as well as to improve quality issues. Thus, an accurate, representative, and early prediction model of SP based on data recorded by an LMS could help in reducing failure rates by allowing timely implementation of corrective actions.
Prediction in OHE is an arising topic in scientific literature: we have identified studies on educational prediction particularly on prediction of SP using several dependent and independent variables, combining different prediction techniques and approaches but very few using genetic programming (GP) as a prediction technique.
Therefore, the contribution of this study is to investigate the application of GP to predict SP measured by student final grades (FGs) in an OHE course. We use Koza’s algorithm (Koza Citation1998) and compare its results to those of a statistical linear regression based on least squares (LR) model when both models are applied to predict the FGs of OHE students using early scores obtained during the course as the independent variable. Comparison of the LR and the GP model is based on the absolute residuals (AR) accuracy criterion; data sets obtained from records of the Moodle platform used by an online institution are used for training and testing the models.
The hypotheses to be tested are the following:
H0 Prediction accuracy of the GPM is statistically equal to that of the LR when these two models are applied for student final grade prediction using the early grades in a course as the independent variable.
H1 Prediction accuracy of the GPM is statistically not equal to that of the LR when these two models are applied for student final grade prediction using the early grades in a course as the independent variable.
This paper is structured as follows. Section 2 introduces the related work to SP; Section 3 presents a brief introduction to GP paradigm. Section 4 presents the description of the data used and how it was divided for the training and testing stages. Section 5 introduces the methodology followed for the generation and comparison of the models. Section 6 presents the results, including the limitations and future work.
Related Work
The literature search focused on two approaches: (1) studies related to SP which we analyzed from the point of view of the definition of SP and (2) studies that predicted SP in the OHE field analyzed from the following points of view: the technique used, the variables type used, and the source data set.
SP
SP is often defined as the quantitative and/or qualitative representation of knowledge and skills acquired by students through a standardized measure (Adelfio, Boscaino y Capursi Citation2014). Particularly in OHE, SP is very quantitative and standardized, obtained through the evaluation of student outputs associated with activities performed and exhibited by the student (Kalles and Pierrakeas Citation2006), such as written papers, exams, or posts in the different areas inside the LMS (forums, bulletin boards, and knowledge spaces), although a few authors associated it to the student perception of self-performance (Solimeno et al. Citation2008) and student satisfaction with knowledge acquired (Kuo et al. Citation2014).
The most common measure of SP found in literature is the FG (as the combination of several learning outputs and measures) given by the teacher (Castillo Merino and Serradell López Citation2014; He et al. Citation2015; Huang and Fang Citation2013) and exam grades (Giesbers et al. Citation2013; Tempelaar et al. Citation2012). Other measures found were scores from several types of exams (Cheng et al. Citation2011), the average grade of the students’ exam scores (Kim, Lee, and Ryu Citation2013; Varela, Cater III, & Michel, Citation2012), and the average grade of activity scores (Xu and Smith Jaggars Citation2013).
Factors analyzed related to SP are attitudes such as persistence (Xu and Smith Jaggars Citation2013), and cognitive characteristics such as achievement orientation (Varela, Cater III, & Michel, Citation2012), independent learning (Kerr, Rynearson, and Kerr Citation2006), critical thinking disposition (Ransdell Citation2010), and self-efficacy (Schoor and Bannert Citation2011); also demographics (Ransdell Citation2010), academic background (Huang and Fang Citation2013), and prior academic or professional experience (Alstete and Beutell Citation2004). Because of the nature of these data, several additional instruments such as surveys and questionnaires were needed to collect them, which is an additional step to be taken and consumes effort and time in detriment of performing an early prediction.
In spite of the great effort to explain educational phenomena in previous studies, none of them conclusions are conclusive and enough for constructing a body of theory with their results reported because of the variety of the instruments used for collecting the data, the approaches and the particularity of the data samples. Therefore, more experimental and empirical analyses need to be done.
Prediction of SP
The use of prediction models in the educational field is a relatively new topic, even though statistical analyses are common in this field (Ulloa-Cazarez and Lopez-Martin Citation2013). We found two types of models performed according to the type of prediction output:
Models that predict in terms of classification, grouping, clustering, or categorization and;
Models that predict in numerical terms (grades).
The studies were analyzed from the following points of view: the technique used, the dependent variable predicted, the independent variables used, and the source data set.
Prediction with Numerical Output
Different methods and techniques have been applied for prediction in OHE, such as statistical methods: statistical regressions (You Citation2015), logistic regressions (Hachey, Wladis, and Conway Citation2015), multivariate regressions (Guo Citation2010), and computing techniques that are mainly machine learning-based (Kardan et al. Citation2013) and soft-computing-based (Agudo Peregrina et al. Citation2014; Hachey, Wladis, and Conway Citation2015; You Citation2015).
In studies that used statistical methods as prediction techniques, SP was defined as the average course grade (Chen and Jang Citation2010; Ekwunife-Orakwue and Teng Citation2014), and as the final exam score (Giesbers et al. Citation2013). An additional measure of SP was used in Xu and Smith Jaggars (Citation2013) as persistence, and in Chen and Jang (Citation2010) as the student satisfaction with learning.
The data samples used varied from 117 (Giesbers et al. Citation2013) to 27,331 records (Xu and Smith Jaggars Citation2013). The number of independent variables analyzed ranged from 2 (You Citation2015) to 11 (Xu and Smith Jaggars Citation2013), including student interactions (Agudo Peregrina et al. Citation2014; Ekwunife-Orakwue and Teng Citation2014), forum participation (Ekwunife-Orakwue and Teng Citation2014; Giesbers et al. Citation2013; Macfadyen and Dawson Citation2010), student use of communication tools (Giesbers et al. Citation2013; Macfadyen and Dawson Citation2010), motivation (Chen and Jang Citation2010), and demographic data (Giesbers et al. Citation2013).
Five out of seven studies applied a multiple linear regression (MLR) technique (Agudo Peregrina et al. Citation2014; Ekwunife-Orakwue and Teng Citation2014; Giesbers et al. Citation2013; Xu and Smith Jaggars Citation2013; You Citation2015). Two studies used computing techniques for the prediction:
Huang and Fang (Citation2013) applied neural networks (NNs), support vector machines (SVM) and MLR to compare their performance. SP was measured by the final average score and the models were constructed with six independent variables related to scores in different examinations. Two different outputs were predicted: the average performance of the class and the individual performance of the student. The difference obtained in the accuracies among techniques was not statistically significant. Therefore, the authors recommended the MLR technique as more suitable.
Lykourentzou et al. (Citation2009) compared two feed-forward NNs and a MLR model for the prediction of student final exam scores. The independent variables were four scores obtained in multiple-choice tests. NN techniques performed better than statistical techniques Therefore, the authors recommended the use of NN for prediction purposes.
Prediction by Classification, Clustering, and Grouping
Most of the studies in this section (10 out of 13) performed comparisons among several algorithms and techniques in order to select those with better classification performance.
Most of the studies compared algorithms performance: in Figini and Giudici (Citation2009) two statistical models were compared whereas the rest of the studies compared statistical algorithms against computational techniques. In all the cases, statistical algorithms were overcome by other techniques (Taylan and Karagözoglu Citation2009; Wanli et al. Citation2015).
Three studies applied a single technique without performing a comparison: a statistical technique was used in MacFadyen and Dawson (Citation2010) and in Hachey, Wladis, and Conway (Citation2015) whereas a NN technique was used in Wang and Liao (Citation2011).
Characteristics of comparisons were different: the number of algorithms or techniques compared were from 2 (Figini and Giudici Citation2009) to 21 (Romero et al. Citation2013); several results were obtained for instance, decision-tree-based algorithms according to Hu, Lo, and Shih (Citation2014) and to Natek and Zwilling (Citation2014) performed better and NNs in Lykourentzou et al. (Citation2009).
Predictions were done in terms of classification in a binary way—fail or pass (Hachey, Wladis, and Conway Citation2015; Hu, Lo, and Shih Citation2014; Kotsiantis, Patriarcheas, and Xenos Citation2010; Macfadyen and Dawson Citation2010; Romero et al. Citation2013; Zafra, Romero, and Ventura Citation2013)—and in a categorical way—such as high, medium, and low (Figini and Giudici Citation2009; Natek and Zwilling Citation2014; Romero et al. Citation2010; Wanli et al. Citation2015; Zafra, Romero, and Ventura Citation2013). One study performed prediction in terms of clustering (Romero et al. Citation2013); another study (Romero et al. Citation2009) performed the prediction by grouping grades. In all cases, SP was defined numerically either by the student average FGs (Hu, Lo, and Shih Citation2014; Huang and Fang Citation2013; Lykourentzou et al. Citation2009; Macfadyen and Dawson Citation2010; Natek and Zwilling Citation2014; Romero et al. Citation2009; Wang and Liao Citation2011; Zafra, Romero, and Ventura Citation2013) or the final exam score (Kotsiantis, Pierrakeas and Pintelas Citation2004, Kotsiantis, Patriarcheas, and Xenos Citation2010; Romero et al. Citation2013).
Data samples used varied from 36 (Macfadyen and Dawson Citation2010) to 1566 records (Hachey, Wladis, and Conway Citation2015). The number of attributes (variables) used were from 9 (Hachey, Wladis, and Conway Citation2015; Zafra and Ventura Citation2012) to 22 (Macfadyen and Dawson Citation2010); filtering techniques (Natek and Zwilling Citation2014; Romero et al. Citation2010, Citation2013), correlational analysis (Romero et al. Citation2013), and dependence functions (Figini and Giudici Citation2009) were used as criteria for selecting the attributes or variables for the final prediction model.
GP for Prediction in the Educational Field
We found four studies using a GP algorithm. The aims of the studies were similar: to apply GP as an optimization technique.
In three studies (Romero, Ventura, and De-Bra Citation2004; Zafra, Romero, and Ventura Citation2013; Zafra and Ventura Citation2012), grammar-guided GP was used to optimize a learning system, knowledge discovery and/or rule discovery. In those, predictions were made in binary and categorically way. Data samples used varied from 50 to 419 records. Independent variables ranged from three to seven and used student activity reports, quiz activity (such as number of attempts, failed, and successful attempts), and quiz scores completion of assignments and participation in forums.
The fourth study (Huang and Fang Citation2013) implemented a GP algorithm to SVM optimization.
Conclusions
Quantitative measures of SP are the most common, either by FGs, midterm exams, final exams, activities, or participation average grades. The most common dimension of SP was FGs (15 studies) followed by exam grades (5 studies). In this work FGs will be used as a measure of SP and a good approximation to the educational phenomena in OHE
Assignments and forums sections were the sources most commonly used to get variables, in particular the number of messages sent, however, they were not the most related. Quizzes and midterm examinations scores were also analyzed, the studies that use them as independent variables found good measures of correlation with SP. However, the establishment of the correlation among these independent variables with SP is not stated or conclusive. We test the same type of variables in this study in order to find their significance and their statistical prediction power.
The use of variables obtained by the LMS platform records, is one of the most common sources and according to the nature of OHE. Data-mining approach is the most prominent among the studies reviewed.
The statistical prediction techniques were the most used by means of several regression techniques. The best prediction results were obtained by NNs either for numerical prediction (machine learning technique) or classification prediction. Four studies applied GP and used it as a data-mining and optimization technique to improve performance of other types of models. In this study GP would be analyzed as a prediction technique for SP and compared in performance against a regression technique.
GP
GP is an application of genetic algorithms that replicates the Darwinian evolutionary process of survival as described in following steps:
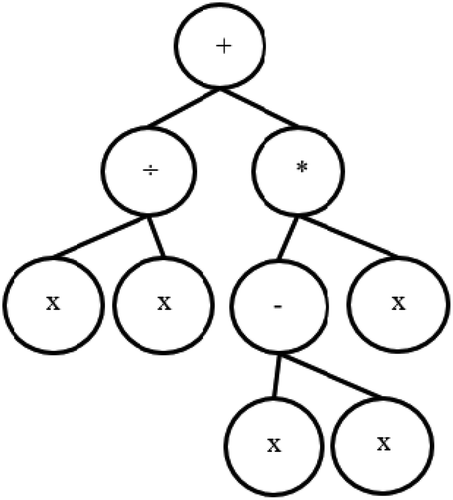
Generation of an initial population of individuals that can be produced randomly; individuals are computer programs (CP) composed of functions (i.e., arithmetic operators, nonlinear functions, or Boolean operators), and terminals (variables) appropriate to the problem domain and that are usually represented as trees with nodes (corresponding to functions) and leaves (corresponding to constant values and variables) (Koza Citation1998). is a graphical representation of a CP.
Each CP produced in the initial population is evaluated against a fitness function to measure the solution given by the CP in an iterative process that takes place until a termination criterion is reached. The CPs with the best evaluation result are considered for the next stage to form the next generation and evolve as other programs that can be applied to solve problems of the real world.
Improvement and replacement of functions and terminals take place on each CP using three genetic operators: crossover, reproduction, and mutation. The new CPs replace current CPs until a termination criterion is reached.
Step 2 is repeated. When the termination criterion is reached, the program produced is considered the result of the run—the winner—and is a candidate for replacing a member of the current population. The termination criterion can be established either as the maximum number of generations or runs that the CP must be iterated, or as a threshold accuracy of the CP.
Figure 1. Tree representation of a CP
Most of the parameters used in this study were implemented as recommended by Koza (Citation1998).
Genetic Operations
Crossover
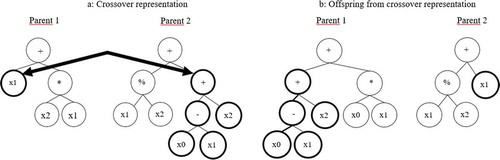
Crossover is an operation that mimics sexual recombination process. It produces a new offspring that is the result of combining randomly selected parts from two parents. is a crossover representation where the left branch of Parent 1 and the right branch of Parent 2 are selected as crossover points. The resulting tree is shown in , which shows the switch of both branches.
Figure 2. Crossover representation
The crossover parents are selected by the measure of their normalized fitness, shown in EquationEquation 1(1)
(1) , where
is the adjusted fitness value.
The effect of the crossover operation is similar to a point mutation, thus, in GP, mutation is considered as an inherent part of the crossover (Koza Citation1994).
Reproduction
Reproduction only operates on a single individual (or S-expression) and produces just one offspring expression by copying that individual without alteration. The original selection of that individual is made according to the fitness measure (EquationEquation 1(1)
(1) ).
Reproduction operation is commonly performed on about 8% of the population (Koza and Poli Citation2005). There are several reproduction methods; the one used in this paper is the Fitness-Proportionate selection.
Mutation
Mutation is an operation that is occasionally used in GP because:
The risk of convergence is unlikely in GP and is somehow handled by the crossover operation.
The risk of disappearance of a terminal or function is low because they are not located in a fixed structure unlike strings in genetic algorithms.
Although Koza (Citation1998) proved that the effects of mutation operation in performance were not substantial, his further research advises using a low level of mutation in order to speed up the process (Poli, Langdon, and McPhee Citation2008): thus, mutation on about 1% of the population is recommended.
Defining Parameters for GP
There are two major considerations in defining parameters for a GP model (Sette and Boullart Citation2001):
Closure property of functions and terminals. This means that each function should be able to process all argument values generated by other functions or terminals. GP copes with this requirement by means of three different approaches: strongly typed (with constrained syntax), GP, and grammar-based GP.
Sufficiency property of function and terminal set. This means that the problem should be solved using the proposed functions and terminals.
The following parameters need to be defined according to the problem to be solved (Sette and Boullart Citation2001):
Objective: What the problem should do (or solve)
Terminal set: The set of independent variables
Function set: The set of operators required by the program
Fitness cases: Number of cases
Raw fitness: The value of the stated fitness, commonly an error value
Parameters: Number of generations; size of the population; selection and generation methods; maximum depth of evolutionary processes.
In this paper, we implemented the Koza’s proposal named Symbolic Regression (Koza Citation1994) which was originally coded in the LISP programming language.
It is recognized that because of the characteristics of the GP paradigm, LISP is the most convenient language to code it because operates on symbolic expressions (S-expressions) that allow treating programs as data (Koza Citation1994).
S-expressions are a notation that can be both, source code and data. They can be represented as a parse tree (see ) more easily to be manipulated (Koza Citation1998; Sette and Boullart Citation2001). An s-expression can take many formats such as lists, pairs, symbols, strings, and integers. Lisp uses prefix notation which means that in an s-expression the first element is commonly an operator or function name and the rest of the elements are arguments.
GP is often used to evaluate mathematical expressions such as regression equations given a set of variables and functions allowing the optimization of more complicated structures (Sette and Boullart Citation2001). In Koza’s work GP is reported to be an efficient technique for optimizing several mathematical functions and it is stated as more understandable in terms of process than other solutions: it can be seen as a white box technique with higher expressivity (Romero et al. Citation2013) because GP solves problems by creating CPs (Koubek, LeBold, and Salvendy Citation2007) instead of weight vectors (NNs), decision trees, formal grammars, frames, schemata, clusters (data-mining), production rules, or concept sets generated by other methods used for prediction purposes.
Data Description
Data were obtained from a fully OHE course. These data corresponded to a first-semester course in an information technologies bachelor program. The Moodle platform is the LMS data source used, and the data sample was composed of student grades records and log records. The sample fulfills the requirements indicated in Romero, et al. (Citation2010), Romero et al. (Citation2013) and in Lara et al. (Citation2014).
The contents of the course selected (Computational Fundamentals) were approached as an introductory course for the entire program, having a major effect on further SP.
Data from two semesters were used. The first semester (A) covered 17 weeks from February to June, and the second semester (B) covered 16 weeks from August to December. They did not have any quiz or exam: learning evaluation was carried out using student outputs such as written papers, reports, exercises, and forum participation graded by teachers; students were required to deliver 17 different types of learning outputs during the entire course. Course content was structured into three study units and one final assignment required to pass the course; a student needed a FG between 59.60 and 100; a grade of 59.50 or lower was considered to be a fail.
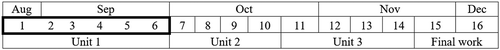
The entire set of activities corresponding to the contents of the first study unit and students’ first five grades were collected. Unit 1 took place prior to the first half of the semester, that is, activities delivered by students after the first 6 weeks for the A semester and first 5 weeks for the B semester. and show the distribution of activities and tasks of the course in the A and B semesters respectively.
Figure 3. A semester, data gathering period
Figure 4. B semester, data gathering period
A total of seven learning outputs were required in order to achieve the first five grades: one forum participation, three game-problem exercises, and three essays. The sum of points obtained by students on these outputs corresponded to the independent variable U1; a student passed U1 if he obtained a sum between 15 and 25, whereas a score of 14.99 or less was considered to be a fail. Passing Unit 1 was not considered a prerequisite for continuing in the course. Six independent variables were obtained from the LMS:
(3) FV: Number of forum views.
(4) FM: Number of forum messages posted.
(5) FT: Number of forum threads posted.
(6) OF: Other activity in forum (which groups several types of actions such as deleting and editing messages).
(7) V1: Number of resources views.
(8) V2: Number of pages views.
In addition, four additional variables were created by the sum of different types of records (for a total of 11 independent variables including U1):
(9) FP as the sum of all forum posts (NP and NT).
(10) FA as the sum of total forum activity (FP, OF and VF).
(11) V3 as the sum of total views (V1 and V2)
(12) TA as the total student activity (FA and V3)
A total of 166 students divided into 10 groups were enrolled in the A semester. The mean value of unit 1 scores was 12.8 and the median value was 4.0. The mean and the median for FG were 38.82 and 25.20 respectively. shows A semester statistics.
Table 1. Data sample description, A semester
Of the group that failed the course, 63 students failed unit 1 (60% of course failures) whereas 19 passed; 38 students who passed Unit 1 also passed the course and correspond to the 84% of the total group that passed, whereas the 22 students who passed Unit 1 and failed the course are the 25% of the total group that failed. Dropouts were eliminated from the data sample and a total of 133 records were used for the rest of the analysis.
For the B semester, a total of 169 records were obtained; dropouts (57 records) were eliminated. Thus, 112 records were used for the rest of the analysis.
Method for Split Data into Training and Testing Data Sets
As historical data was used for our empirical study, chronological split is justified by the following aspects (Lokan and Mendes Citation2009):
(13) The trend discovery
(14) Time- or group-related factors that could be related to the quality of the model
(15) Prediction accuracy of the chronological splitting has equal to other validation methods such as leave-one-out and k-fold cross-validation methods.
In accordance, A semester, namely the training data set, was used to generate the prediction model from a learning procedure and B semester, the testing data set, was used to assess the predictive power of the model (Hastie, Tibshirani, and Friedman Citation2009).
Method
The procedure applied in our study was as follows:
(16) Statistical analysis
(17) Generation of the models
(a) Generation of LR by using the training data set; the residual analysis was performed and the analysis of variance (ANOVA) calculated.
(b) Generation of GPM: Koza’s symbolic regression algorithm was generated using the training data set.
(18) Prediction accuracy: the mean and the median of the AR for LR and GPM were calculated; a suitable test to compare the prediction accuracy of the training models was selected based upon the number of data sets to be compared, dependence of data, as well as normality of the data.
(19) Testing the models: the LR and GPM obtained were applied to the testing data set. The mean and median of AR per model were calculated. The statistical test for comparing accuracies of models was applied.
Statistical Analysis
Correlational Analysis between FG and Seven Independent Variables
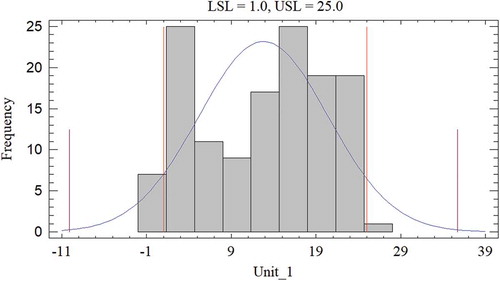
A multiple variable analysis was performed among FG and the 11 independent variables. presents the summary statistics including correlation coefficients (Pearson’s r). The highest r coefficient (0.78) with a p-value of 0.0000 was for U1, whereas the second largest r coefficient (0.61) with a p-value of 0.0000 was for V2. Normality tests for each variable were also performed with none of the variables showing a normal distribution. However, as seen in and , two peaks at lower and higher grades for both U1 and FG, as well as the outlier analysis, show that none of the variables distorted the model. In addition, the data ranged from 2–100% with sufficient data distributed in the range to validate a linear regression model for the data sample.
Table 2. Results of multiple variable analyses on 12 variables
Figure 5. Normality plot for FG
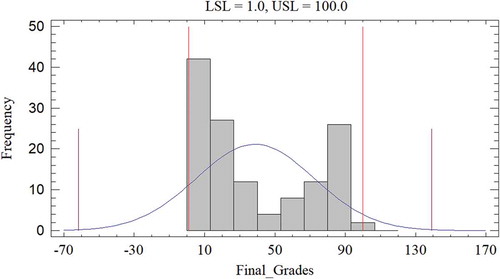
Figure 6. Normality plot for U1
Outlier analysis was performed and none of the records registered z-values greater than 3.0, indicating there were no significant outliers; the total 133 records were therefore used for the remaining analyses.
MLR Analysis
Seven different combinations of the 11 variables were tested for generating 205 models with FG as the dependent variable. The seven combinations were defined based on these criteria:
FP is the sum of FM and FT, then, a model including FP neither includes FM nor FT.
FA is the sum of FP and FV, then, a model including FA neither includes FP nor FM.
V3 is the sum of V1 and V2, then, a model including V3 neither includes V1 nor V2
TA is the sum of all student activity, then, a model including TA only includes U1 and none of the rest variables.
U1 is included in all the combinations.
The combination of V2 and U1 obtained the highest adjusted coefficient of determination (r2 = 61.75) and were selected to generate a MLR. In order to determine which independent variable is giving more meaning to the model, an individual analysis of parameters was done and U1 was the sole variable with a statistical significance with 99% of confidence. Thus, U1 was selected as the most representative variable for the prediction of FG and a simple linear regression model was proposed.
Generation of Models
Generation of LR
The simple LR model obtained is:
The residual analysis was performed and four values greater than z = 2.0 were found but none exceeded z = 3.0. Therefore, the complete data set of 133 records was used. The ANOVA calculations for the simple LR indicated a statistically significant relationship between U1 and FG at 99% confidence level. The LR had a correlation coefficient r of 0.78, and an r2 of 0.60.
Generation of GPM
In our study, the GP paradigm described in Section 3 was used with parameters described in :
Table 3. Genetic programming parameters
We have identified U1 as the terminal of our problem by the previous statistical analysis and the standardized fitness equals the raw fitness because we try to minimize the error.
EquationEquation 3(3)
(3) shows the GPM obtained once we converted the symbolic expression obtained in LISP language in prefix notation. The best result was found in generation three, run two, with a fitness value of 2089.83.
Comparison of Prediction Accuracies of the LR and GPM Models for the Training Data Set
The selection of the accuracy criterion for the comparison of the LR and GPM was based on the ARs as they do not lead to asymmetry [52].
AR is calculated as the absolute difference between each observation i and defined as:
The aggregation of AR over multiple observations was obtained by the mean of the ARs (MAR) from each observation i, and is defined as:
In addition, the median of the ARs (MdAR) was also calculated. The accuracy of a prediction is inversely proportional to the MAR and MdAR.
From each FG predicted for student an AR value was obtained. Then, a set of AR values per model was obtained from the training data set. The two AR data sets are therefore dependent. The set of differences between AR values from the LR and the GPM were calculated and a normality test based on the four known criteria (Chi squared, Shapiro-Wilk, Kurtosis, and Skewness) was performed over the set of differences. The values for the four tests are shown in .
Table 4. Test for normality of differences between AR of each model for training data set
Based on these results is concluded that the set of differences was not normally distributed with a 99% confidence level (Ross Citation2004). The Wilcoxon test that takes into consideration the number of data sets to be compared (two), the data dependence, and data not normally distributed was selected to evaluate the null hypothesis that the median of the two samples of AR is equal to 0.0000. The application of LR (EquationEquation 2(2)
(2) ) to the training data set produced a MAR of 16.93 and a MdAR of 16.59. When GPM (EquationEquation 3
(3)
(3) ) was applied to the same data set, a MAR of 15.71 and MdAR of 10.66 were obtained.
The p-value determined by Wilcoxon test was equal to 0.0727. Therefore, there is a statistically significant difference in accuracy between the models in favor of the GPM using the training data set with a 90% confidence level. These results were useful to test hypotheses H0 and H1 formulated in Section 1.
Testing the Models
The testing phase for LR and GPM was performed using the B data set. This data set was obtained under the same conditions as the training data set; 112 student records were used after the null values were excluded. No outlier was identified. Applying Equationequation 2(2)
(2) to the testing data set resulted in a MAR and MdAR values of 17.49 and 16.53, respectively. EquationEquation 3
(3)
(3) resulted a MAR = 14.38 and a MdAR = 9.80.
Based on the need to compare the two sets of data, the Wilcoxon non-parametric test was applied to compare the models’ accuracies, since they were dependent and not normally distributed. The p-value of this test was 0.0001, meaning that the difference in accuracy is statistically significant with a 99% confidence level. These results were used to test hypotheses H0 and H1 formulated in Section 1.
Results
The GPM was more accurate than the LRM; however, EquationEquation 3(3)
(3) is quadratic, as opposed to EquationEquation 2
(2)
(2) , which corresponds to a linear model. Thus, in order to see whether the GPM performs better than a statistical quadratic model, we also generated a statistical polynomial regression (SPR) using the training data set. EquationEquation 9
(9)
(9) shows the SPR obtained with an r2 value of 0.61.
Following the procedure described in Section 5, EquationEquation 9(9)
(9) was applied to both, training and testing data sets: A MAR of 16.44 and a MdAR of 14.79 were obtained from the training data set, and a MAR of 16.86 and a MdAR of 13.80 from the testing data set.
We tested the normality of the set of differences obtained from ARs of Equation 6 and ARs of EquationEquation 9(9)
(9) . Results showed a not-normal distribution with a 99% confidence level according to the four criteria—Chi-squared, Shapiro-Wilk, Kurtosis, and Skewness.
The Wilcoxon test was applied to the set of differences, obtaining p-values of 0.1370 and 0.0000 for the training and testing data sets, respectively. Therefore, the difference between accuracies is statistically significant for the testing data set with a 99% confidence level in favor of GPM.
Results from the empirical analysis in Section 5 show that the GP model resulted in better accuracy than the LR for both training and testing data sets, thus, hypothesis H0 is accepted with 90% of confidence for training data set and with 99% of confidence for the testing data set:
H0 Prediction accuracy of the GPM is statistically not equal to that of the LR when these two models are applied for student final grade prediction using early grades in a course as the independent variable.
Moreover, the GPM resulted in better accuracy than the SPR in the testing data set too. Consequently, the following hypothesis is accepted with a 99% confidence level in favor of GPM:
H1b Prediction accuracy of the GPM is statistically not equal to that of the SPR when these two models are tested for student final grade prediction using early grades in a course as the independent variable.
Discussion
The need to prevent failure in OHE has been established in previous studies (Huang and Fang Citation2013; OECD Citation2013). In our study, we explored a GP model as an alternative for predicting FG from early grades obtained in an OHE course.
Our model was constructed with data obtained immediately after the first month (out of four) in a first semester course. All the data used in the study were obtained from the LMS platform Moodle as produced by students and teachers; the timing between data production and collection thus gives our model the earliness necessary to perform timely intervention and prevent student failure.
From the literature reviewed we confirmed FG as a valid quantitative measure of SP that is objective (Adelfio, Boscaino, and Capursi Citation2014) and reflects the value of the opinion of the teacher who grades student outputs, because it represents the teacher judgment of the overall performance of the student. Grades are in fact, a mixture of qualitative and quantitative criteria.
In concordance, by the statistical analysis of the whole set of independent variables we may conclude that the sum of points obtained by student at certain period of the course, is a good representation of the SP at this specific period since is the summary of the student achievement, knowledge acquired and participation. Therefore, our model can be considered as representative of educational phenomena in this course. For those reasons, the use of grades as dependent (FG) and independent (U1) variables, gives our model more balance between subjective and objective data and more simplicity (one independent and one dependent variable) than that of others models reviewed which required more computational time and effort.
One contribution of our study is that we introduced GP as an alternative technique that ranked well in terms of accuracy in prediction of numerical grades. Most of the studies reviewed, defined prediction in terms of classification or clustering. The use of numerical prediction of course grades have advantages over prediction in terms of classification or clustering because it is more in the interest of the students and allowed further analysis.
These results lead to the conclusion that GPM is an alternative for the prediction of SP in terms of numerical grades, when early grades in a course are taken as the independent variable: GPM improves in accuracy when compared to the LR and SPR models.
The limitations of our study are as follows:
Our study does not include other common independent variables used in studies such as demographic data (age, gender, place of residency), or related to other psychological issues such as motivation. Nevertheless, most of the studies using these type of variables required considerable data collection effort because of the use of instruments such as questionnaires and surveys, and we obtained the entire data set from the LMS.
Although we had access to other types of variables such as forum participation and general course activity, they did not correlate sufficiently with FG. However, the r and r2 values from related works using these sets of variables were lower than those we obtained with the use of U1. For instance, Romero et al. (Citation2013) obtained a higher r value of 0.74 for the “number of sentences used in messages” variable, which was not far from our r value for U1 (r = 0.76).
For future work we have identified several topics:
To explore the capabilities of GP to find models by using all the data available from the LMS as input.
To investigate what the student should or should not do in order to achieve success in the course, after being made aware of his performance in the first month.
To use the GPM as a tool to identify failure causes related to the grades first obtained early in the online course.
To apply other computing techniques and compare them for the improvement of the prediction accuracy of FG.
References
- Adelfio, G., G. Boscaino, and V. Capursi. 2014. A new indicator for higher education student performance. Higher Education 68 (5):653–68. doi:10.1007/s10734-014-9737-x.
- Agudo Peregrina, Á. F., S. Iglesias Pradas, M. Á. Conde González, and Á. Hernández García. 2014. Can we predict success from log data in VLEs? Classification of interactions for learning analytics and their relation with performance in VLE-supported F2F and online learning. Computers in Human Behavior 31:542–50. doi:10.1016/j.chb.2013.05.031.
- Allen, I. E., and J. Seaman. 2014. Grade Change. Tracking online education in the United States.
- Alstete, J. W., and N. J. Beutell. 2004. Performance indicators in online distance learning courses: A study of management education. Quality Assurance in Education 12 (1):6–14. doi:10.1108/09684880410517397.
- Castillo Merino, D., and E. Serradell López. 2014. An analysis of the determinants of students’ performance in e-learning. Computers in Human Behavior 30:476–84. doi:10.1016/j.chb.2013.06.020.
- Chen, K.-C., and S.-J. Jang. 2010. Motivation in online learning: Testing a model of self-determination theory. Computers in Human Behavior 26:741–52. doi:10.1016/j.chb.2010.01.011.
- Cheng, C. K., D. E. Paré, L.-M. Collimore, and S. Joordens. 2011. Assessing the effectiveness of a voluntary online discussion forum on improving students’ course performance. Computers and Education 56:253–61. doi:10.1016/j.compedu.2010.07.024.
- Ekwunife-Orakwue, K., and T.-L. Teng. 2014, September. The impact of transactional distance dialogic interactions on student learning outcomes in online and blended environments. Computers & Education 78:414–27. doi:10.1016/j.compedu.2014.06.011.
- Figini, S., and P. Giudici. 2009, July. Statistical models for e-learning data. ( Springer, Ed.). Statistical Methods and Applications 18 (2):293–304. doi:10.1007/s10260-008-0098-4.
- Giesbers, B., B. Rienties, D. Tempelaar, and W. Gijselaers. 2013, January. Investigating the relations between motivation, tool use, participation, and performance in an e-learning course using web-videoconferencing. Computers in Human Behavior 29 (1):285–92. doi:10.1016/j.chb.2012.09.005.
- Guo, W. W. 2010. Incorporating statistical and neural network approaches for student course satisfaction analysis and prediction. Expert Systems with Applications 37:3358–65. doi:10.1016/j.eswa.2009.10.014.
- Hachey, A. C., C. Wladis, and K. Conway (2015, October 31). Prior online course experience and G.P.A. as predictors of subsequent online STEM course outcomes. Internet and Higher Education, 25, 11–17. doi:10.1016/j.iheduc.2014.10.003
- Hastie, T., R. Tibshirani, and J. Friedman. 2009. The elements of statistical learning: Data mining, inference and prediction, 2nd ed. ( Springer, Ed.) New York, USA: Springer.
- He, W., D. Gajski, G. Farkas, and M. Warschauer. 2015. Implementing flexible hybrid instruction in an electrical engineering course: The best of three worlds? Computers and Education 81:59–68. doi:10.1016/j.compedu.2014.09.005.
- Hu, Y.-H., C.-L. Lo, and S.-P. Shih. 2014. Developing early warning systems to predict students’ online learning performance. Computers in Human Behavior 36:469–78. doi:10.1016/j.chb.2014.04.002.
- Huang, S., and N. Fang. 2013, February. Predicting student academic performance in an engineering dynamics course: A comparison of four types of predictive mathematical models. ( Elsevier, Ed.) Computers & Education 61:133–45. doi:10.1016/j.compedu.2012.08.015.
- Hussar, W. J., and T. M. Bailey (2013). Projection of education statistics to 2021. Institute of Education Sciences. Washington, DC: National Center for Education Statistics. Retrieved Noviembre 14, 2013, from http://nces.ed.gov/programs/projections/projections2021/index.asp
- Kalles, D., and C. Pierrakeas. 2006. Analyzing student performance in distance learning with genetic algorithms and decision trees. Applied Artificial Intelligence 20 (8):655-674. doi: 10.1080/08839510600844946.
- Kardan, A. A., H. Sadeghi, S. S. Ghidary, and M. R. Fani Sani. 2013. Prediction of student course selection in online higher education institutes using neural network. ( Elsevier, Ed.) Computers & Education 65:1–11. doi:10.1016/j.compedu.2013.01.015.
- Kerr, M. S., K. Rynearson, and M. C. Kerr. 2006. Student characteristics for online learning success. The Internet and Higher Education 9:91–105. doi:10.1016/j.iheduc.2006.03.002.
- Kim, J., A. Lee, and H. Ryu. 2013. Personality and its effects on learning performance: Design guidelines for and adaptive e-learning system based on a user model. International Journal of Industrial Ergonomics 43:450–61. doi:10.1016/j.ergon.2013.03.001.
- Kotsiantis, S., C. Pierrakeas, and P. Pintelas. 2004. Predicting students' performance in distance learning using machine learning techniques. Applied Artificial Intelligence 18 (5):411-426. doi: 10.1080/08839510490442058.
- Kotsiantis, S., K. Patriarcheas, and M. Xenos. 2010. A combinational incremental ensemble of classifiers as a technique for predicting students’ performance in distance education. ( Elsevier, Ed.) Knowledge-Based Systems 23:529–35. doi:10.1016/j.knosys.2010.03.010.
- Koubek, R. J., W. K. LeBold, and G. Salvendy. 2007. Predicting performance in computer programming courses. Behaviour & Information Technology 4 (1985):113–29. doi:10.1080/01449298508901793.
- Koza, J. R. 1994, June. Genetic programming as a means for programming computers by natural selection. ( C. &. Hall, Ed.) Statistics and Computing 4 (2):87–112. doi:10.1007/BF00175355.
- Koza, J. R. 1998. Genetic programming: On the programming of computers by means of natural selection. Cambridge: The MIT Press.
- Koza, J. R., and P. Riccardo (2005). Genetic programming. In J. R.Koza, R.Poli, E. K.Burke, & G.Kendall (Eds.), Search methodologies: Introductory tutorials in optimization and decision support techniques (pp. 127-164). Nottingham: Springer.
- Kuo, Y.-C., A. E. Walker, K. E. Schroder, and B. R. Belland. 2014. Interaction, Internet self-efficacy, and self-regulated learning as predictors of student satisfaction in online education courses. The Internet and Higher Education 20:35–50. doi:10.1016/j.iheduc.2013.10.001.
- Lara, J. A., D. Lizcano, M. A. Martínez, J. Pazos, and T. Riera. 2014, March. A system for knowledge discovery in e-learning environments within the European Higher Education Area. Application to student data from Open University of Madrid, UDIMA. ( Elsevier, Ed.) Computers & Education 72:23–36. doi: 10.1016/j.compedu.2013.10.009.
- Lokan, C., and E. Mendes. 2009October02.Investigating the use of chronological split for software effort estimation. (IET, Ed.). IET Software 35: 422–34.doi:10.1049/iet-sen.2008.0107
- Lykourentzou, I., I. Giannoukos, G. Mpardis, V. Nikolopoulos, and V. Loumos. 2009, February. Early and dynamic student achievement prediction in E-Learning courses using neural networks. ( Willey, Ed.) Journal of the American Society for Information Science and Technology 60 (2):372–80. doi: 10.1002/asi.20970.
- Macfadyen, L. P., and S. Dawson. 2010. Mining LMS data to develop and “early warning system” for educators: A proof of concept. Computers and Education 54:588–99. doi:10.1016/j.compedu.2009.09.008.
- Natek, S., and M. Zwilling. 2014. Student data mining solution-knowledge management system related to higher education institutions. Expert Systems with Applications 41:6400–07. doi:10.1016/j.eswa.2014.04.024.
- OECD. 2013. Education at a glance 2013. OECD Indicators. Paris: OECD. doi: 10.1787/eag-2013-en.
- Poli, R., W. B. Langdon, and N. F. McPhee. 2008. A field guide to genetic programming. England: http://lulu.com. Retrieved from http://www0.cs.ucl.ac.uk/staff/w.langdon/ftp/papers/poli08_fieldguide.pdf
- Ransdell, S. 2010. Online activity, motivation, and reasoning among adult learners. Computers in Human Behavior 26:70–73. doi:10.1016/j.chb.2009.09.002.
- Romero, C., M. I. López, J. M. Luna, and S. Ventura. 2013. Predicting students’ final performance from participation in online discussion forums. Computers and Education 68:458–72. doi:10.1016/j.compedu.2013.06.009.
- Romero, C., P. González, S. Ventura, M. J. Del Jesús, and F. Herrera. 2009. Evolutionary algorithms for subgroup discovery in e-learning: A practical application using Moodle data. ( Elsevier, Ed.) Expert Systems with Applications 36:1632–44. doi:10.1016/j.eswa.2007.11.026.
- Romero, C., P. G. Espejo, A. Zafra, J. R. Romero, and S. Ventura. 2010. Web usage mining for predicting final marks of students that use moodle courses. Computer Applications in Engineering Education 21 (1):135-146. doi: 10.1002/cae.v21.1.
- Romero, C., S. Ventura, and P. De-Bra. 2004, December. Knowledge discovery with genetic programming for providing feedback to courseware authors. ( Springer, Ed.) User Modeling and User-Adapted Interaction 14:425–64. doi:10.1007/s11257-004-7961-2.
- Ross, S. M. 2004. Introduction to Probability and Statistics for Engineers and Scientists. Burlington, MA: Elsevier Press.
- Schoor, C., and M. Bannert. 2011. Motivation in a computer-supported collaborative learning scenario and its impact on learning activities and knowledge acquisition. Learning and Instruction 21:560–73. doi:10.1016/j.learninstruc.2010.11.002.
- Sette, S., and L. Boullart. 2001, December. Genetic programming: Principles and applications. ( Elsevier, Ed.) Engineering Applications of Artificial Intelligence 14 (6):727–36. doi:10.1016/S0952-1976(02)00013-1.
- Solimeno, A., M. E. Mebane, M. Tomai, and D. Francescato. 2008. The influence of students and teachers characteristics on the efficacy of face-to-face and computer supported collaborative learning. Computers and Education 51:109–28. doi:10.1016/j.compedu.2007.04.003.
- Taylan, O., and B. Karagözoglu. 2009. An adaptive neuro-fuzzy model for prediction of student’s academic performance. ( Elsevier, Ed.) Computers & Industrial Engineering 57:732–41. doi:10.1016/j.cie.2009.01.019.
- Tempelaar, D. T., A. Niculescu, B. Rienties, W. H. Gijselaers, and B. Giesbers. 2012. How achievement emotions impact students’ decisions for online learning, and what precedes those emotions. The Internet and Higher Education 15 (3):161–69. doi:10.1016/j.iheduc.2011.10.003.
- Ulloa-Cazarez, R. L., and C. Lopez-Martin. 2013. A fuzzy logic model for predicting the number of course needed from the number of students enrolled. FECS’12 211–15. WorldComp, Las Vegas.
- Varela, O. E., J. J. Cater III, and N. Michel. 2012. Online learning in management education: An empirical study of the role personality traits. Journal of Computing in Higher Education 24 (3):209–55. doi:10.1007/s12528-012-9059-x.
- Wang, Y.-H., and H.-C. Liao. 2011. Data mining for adaptive learning in a TESTL-based e-learning system. ( Elsevier, Ed.) Expert Systems with Applications 38:6480–85. doi:10.1016/j.eswa.2010.11.098.
- Wanli, X., G. Rui, P. Eva, and G. Sean. 2015. Participation-based student final performance prediction model through interpretable Genetic Programming: Integrating learning analytics, educational data mining and theory. Computers in Human Behavior 47:168–81. doi:10.1016/j.chb.2014.09.034.
- Xu, D., and S. Smith Jaggars. 2013, December. The impact of online learning on students’ course outcomes: Evidence from a large community and technical college system. ( Elsevier, Ed.) Economics of Education Review 37:46–57. doi:10.1016/j.econedurev.2013.08.001.
- You, J. W. 2015. Examining the effect of academic procrastination on achievement using LMS data in e-learning. Educational Technology & Society 18 (3):64–74. Accessed October 04, 2015.
- Zafra, A., C. Romero, and S. Ventura. 2013. DRAL: A tool for discovering relevant e-activities for learners. ( S. Link, Ed.) Knowledge and Information Systems 36(1):211–50. doi:10.1007/s10115-012-0531-8.
- Zafra, A., and S. Ventura. 2012. Multi-instance genetic programming for predicting student performance in web based educational environments. ( Elsevier, Ed.) Applied Soft Computing 12:2693–706. doi:10.1016/j.asoc.2012.03.054.