
 ?Mathematical formulae have been encoded as MathML and are displayed in this HTML version using MathJax in order to improve their display. Uncheck the box to turn MathJax off. This feature requires Javascript. Click on a formula to zoom.
ABSTRACT
The financial creditability of the customer needs to be verified by the lender/bank before issuing a credit card. This involves assessment of factors like the economic, social or social-economic background of the person. Thus, the features incorporated into the analysis are mixed data type ex. Income (numerical) and Property Owned (Categorical). In this manuscript, a credit card lending model is designed using a recently proposed parallel social spider algorithm by Shukla and Nanda in 2016. Suitable modifications have been introduced in the coding scheme and mating procedure to efficiently solve the credit assessment problem. Experiments are carried out on various standard credit card data available like German, Australian and Japanese credit card datasets. The superior performance of proposed algorithm is reported as compared to that achieved by K-means, parallel real genetic algorithm and parallel particle swarm optimization (PPSO). The Silhouette Index obtained by various algorithms specifically for Germen dataset are 0.56% by K-means, 0.86% by parallel Real Coded Genetic algorithm, 0.71% by PPSO and 0.84% by proposed method.
The finance industry is one of the prominent digitally growing sector. With increasing market competition and growth in credit card industry, need for identifying the person creditworthiness has become a challenge. This leads to search for an efficient and reliable financial data analysis model. Through this model, the lenders can determine risk involve in lending, thus helps in taking a decision which results in minimal loss (Luhn Citation1958). The usage of credit card has increased exponentially over the time. Credit card score is actually a mathematical model that provides a quantitative estimation or probability that a customer will be defaulter or bankrupt with respect to its current credit position. This model is built and optimized by evaluating the previous datasets of defaulters consisting of various parameters associated with them through statistical approach.
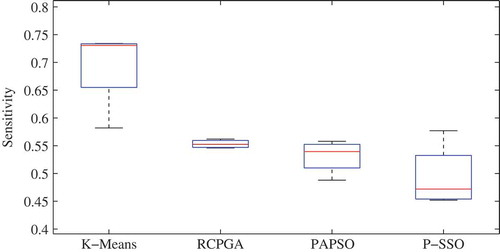
Figure 7. Box plots representing the distribution of the sensitivity obtained by the proposed P-SSO along with K-means, PRGA and PPSO clustering algorithms.
The literature has a wide variety of methods employed to design a model for various types of financing frauds. The methods like Kohonen’s self-organizing feature map (SOM) were employed for automobile bodily injury claims fraud analysis (Brockett, Xia, and Derrig Citation1998). The application of fuzzy logic to account suspicious behavior in healthcare claims (Cox Citation1995). Even there has been a lot of work done based on classification and clustering modeling of finance. The application of K-means along with supervised method for insurance risk (Williams and Huang Citation1997). Hierarchical clustering for automobile insurance risk (Yeo et al. Citation2001). There has been many efforts made till date in order to improve the cluster analysis techniques (Chen et al. Citation2012, Martins and Cardoso Citation2008).
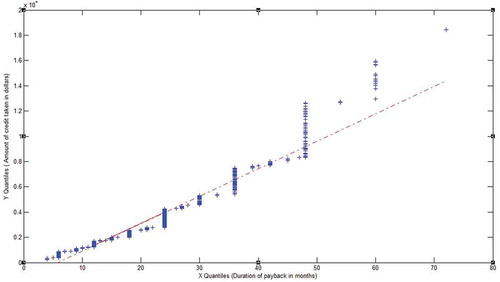
The methods employed still needs refinement in terms of understanding the inherent relation within the dataset and its characteristics. exhibits a relation between credit amount and duration for which it is lent. There is a linear relation between two features. It showcase, that as the amount of credit increases, duration of payback also increases as the earning of person is constant. Also, in such datasets, the clusters are indispensable. There is a small window of overlap among the dataset.
Figure 1. Quantile-quantile plot for German credit card dataset. Representing relation between credit amount and duration of payback.
The credit card data is a good mixture of numeric and categorical entries. The traditional way of clustering treats categorical attributes as numeric does not always produce meaningful results because many categorical domains are not ordered. The reason is that traditional clustering algorithms optimize a cost function which is defined based on the Euclidean distance measure between data points and means of clusters, thereby providing with many times incorrect partitions. In this article, mixed data type clustering has been employed using nature inspired algorithms. The utilization of such algorithms leads to an optimal partition that is both accurate and (Nanda and Panda Citation2014) as compared to the other methods present in the literature.
The algorithms employing framework for both numeric and another type of data work has been reported like: genetic algorithm (Zheng et al. Citation2010) and clonal selection algorithm (Jie, Xinbo, and Li-Cheng Citation2004). However, these inspired by nature (Nanda and Panda Citation2013) provide accurate results but they are computationally complex in nature (Kim Citation2009). Therefore, it is essential to implement them such that their complexity reduces. One of the ways is to implement them in a parallel form. Through literature, three main strategies identified for parallelism are (1) Independent parallelism: where each processor has accesses to the whole data but there is no communication among them (2) Task parallelism: where each processor runs different algorithms for the given data set. (3) SPMD (Single Program Multiple Data) parallelisms where multiple processors are made to execute the same algorithm on different subsets of data and partial results are exchanged (Talia Citation2002).
The survey done by TranUnion Cibil has shown that India tops the rank in terms of credit card holders and they often make payment in excess of their minimum due for resolving debt each month as compared to other countries. At present India has about 2.7 crore credit cards in the system. With this existing scenario there is need for a model that could emulate prediction of person as noncredit worthy in form of a clustering problem. The designed method is formulated to model the above issue. Through a heuristics approach, modifications are done in coding, fitness function and mating procedure. As uniformly samples need to be picked from each category this coding scheme is utilized. SBX (simulated binary crossover) is employed as mating rule as the method is suitable for problems with multiple optimal solution having narrow global basin also, when the lower and upper global bound are unknown. The task parallelism is included as the original SSO algorithm proposed performs position updated of each agent sequentially; however, here they are executed in parallel.
The organization of paper is as follows. The article begins with the formulation of risk involved in credit card lending system and the designing of it as a clustering optimization problem. Then, in Section III a brief overview of the original social spider algorithm along with new designed algorithm are presented. Here, the objective function and the mating procedure are reformulated in order to suit the problem. Results and its discussion are presented in Section IV, along with details of simulation platform and the datasets. The article is concluded on the note of analysis achieved by the designed algorithm.
Formulation of credit card risk assessment as a clustering problem
Credit card is an important element in our day to day life. It increases the purchasing power, liquidity and thereby, introducing competition among lending firms. These all factors have led to the penetration of ‘risk’ in the retrieval of credit from its creditors. The other dimension is the cost involved when a good client is denied credit. In both the cases employing a right methodology to segregate an individual as bankrupt or non-bankrupt, credit-worthy or noncredit-worthy is mandatory.
A common thing noticed about any credit card detail is that it is a mixed bag of features. There are vast varieties of information gathered from various aspects of daily life. It could be economic, social or socio-economic. In this situation employing traditional methodology of classification fails due to two major reasons. The unavailability of labels in the data, which compels to look out for unsupervised methods and the other is a variety of features ‘numerical’, ‘categorical’ and ‘continuous’ etc. In such situations analysis of features become complex and challenging. A method for interpreting such feature vector was initially given by Huang (Citation1997). This is designed for partitional clustering of mixed data sets. The metric of closeness is amalgamation of both K-means and K-mode algorithm. The similarity measure was employed:
here, and
are the number of features in numeric and categorical type, respectively. The
are initialized centers and
are the patterns present in the dataset.
and
are
numeric part of center and pattern, respectively. Similarly,
and
are
categorical part. The
is a weight factor taken as 0.45.
The represents comparative mode. K-prototype designed is a mixture of both mean of the data and a factor of similarity or measure of frequency. Such types of algorithms are fast and efficient, although they are highly sensitive to initial condition and at many times become NP-hard problems (Camacho Citation2015). Thereby many times resulting in incorrect partitions.
All these shortcoming compels researchers to look out for new methods in order to overcome such a scenario. In this article, author has employed evolutionary algorithms to optimize defined in (1). The aim is to determine, how many people are credit worthy or not. This is done by grouping the whole dataset using the factor of similarity among features exhibited by an individual. The whole process begins with a pre-processing step which includes the data interpretation (data format in the original dataset is of symbolic or character type which needs to be converted into a suitable format) such that computer can infer the data, missing values are filled through spline interpolation technique. After, this clustering is applied on the dataset. The results are validated in terms of nine quantitative measures by the different standard existing comparative algorithms.
Parallel social spider algorithm for clustering
Social spider optimization algorithm
Inspired by the concept of swarm intelligence, a new novel algorithm has been designed by (Cuevas et al. Citation2015) known as social spider algorithm. This is motivated by the social behavior of spiders dwelling in huge colonies. There are two type of forging agents: males and females. These agents play their respective roles for survival and overall development of the colony. It is a female dominated territory. The males have been further categorized into two: dominant and nondominant males. The role of each agent is governed by a set of specific operators. The mode of communication is through vibrations produced by a spider on the web. These vibrations impart information like prey, size, danger and mating desire etc. Mating is an integral part of evolution. Here, females and dominant males mate to produce baby spiders through roulette wheel selection procedure in a mating radius. The flowchart of algorithm is shown in . The detailed information regarding original algorithm can be obtained from Cuevas and Cienfuegos (Citation2014).
Figure 2. Flowchart of the original social spider optimization algorithm.
Proposed methodology
In this section a detail implementation of parallel version of mixed data clustering algorithm is discussed. The parallel version of the algorithm has been recently proposed by Shukla and Nanda (Citation2016). In this article, a new methodology for initialization, fitness function and mating is developed to solve the problem of credit accessibility.
Coding scheme and fitness function
In the initialization phase, each of the individuals is composed of both numeric and categorical part. The length of each spider is . They serve as an initial set of centers for the clustering to begin. The coding scheme for four agents is shown in these entries are randomly picked from German credit card dataset. The first four entries
to
are from dataset for numerical part, the rest are for categorical part
to
. The total length will be equivalent to the dimensionality of dataset. Through, credit card dataset one has to infer that the person is credit worthy or not. The segregation of points is done to achieve minimum intra-cluster distance given by
Figure 3. Coding scheme for each spider in mixed data set application. (,
,
,
,
,
,
).
where is the fitness of a spider. The
is number of clusters present. The person who is credit worthy would share similar characteristics to other credit worthy person. The quotient of similarity between a credit worthy and other credit worthy would be more as compared to noncredit worthy e.g. identical in employment pattern (years), savings (in form of bonds, etc) and owing some property (number may vary).
Main loop
(1) Initialization: A swarm of spiders is configured using above coding scheme. The size of population (P) along with a number of iterations (T), generations (G) and probability factor (PF) are input from the user.
(2) Fitness evaluation: Each spider’s fitness is computed and arranged in ascending order of their fitness.
(3) Gender biasing: Here, out of (P) population size, 80% are considered as females and rest are males .
(4) Mass and male division: The mass of any spider plays an important role for its growth and significant activities it plays on web. A heavier mass male spider is subjected to be least efficient agent. Thus, it is a slow invading agent.
where is the mass of
spider. The
and
are the minimum and maximum value of fitness, respectively.
Will be least for the most fittest spider. The male spiders are divided on basis of above mass.
where is dominant male agent having minimum fitness over nondominant agent
. But, mass of
is more which forces them to move slow and provide the scope of adaptivity in algorithm. The division is based on median as the values remain unaffected by the outliers present in the data.
(5) Position update: Each agent has their own way of living in web. Different operators are utilized to translate their actual co-operative behavior into a mathematical formulation. Each spider position resembles center of clusters in formulation.
(a) Female position update: The movement of female agents depends on their mood. They are normally found in two states: socializing or being isolated. This behavior is governed by factors like reproduction cycle, curiosity etc. The position of female agents is updated based on PF:
where, and
are randomly picked from uniform distribution between [0,
]. Here, information exchange between (local) agent
and communicator is carried out as
In similar fashion, exchange of message among (global) that symbolizes agent with best fitness but least mass is
In both the cases mass and distance plays an important role. is the Euclidean distance function.
(b) Dominant male position update: The main characteristic of these dominant male agents is that they are accustomed to direct themselves toward female spiders for reproduction. Their position update is carried out as:
They receive information from female spider which is formulated using the following logic:
(c) Nondominant male position update: As these agents posses maximum mass, they move slowly. This concept has been conceived using inclusion mean of mass () in their behavior which is modeled as:
In each of the above case, after position updation of each spider is fragmented into a numeric and categorical part. Then each of the parts is delimited by the maximum and minimum value. The movement of spiders resembles the shifting of centers toward the middle of a denser area such that distance between center and points within the radius is minimum.
(6) Mating: In this process, only dominant male agents can participate. A radius is calculated which dependents on the upper and lower limit of dataset and is given by
Within this radius, if no female is present then mating is canceled otherwise the brood is formed. Crossover between dominant male and females present is carried out.
In crossover, numerical part has been applied with SBX (Agrawal, Deb, and Agrawal Citation1995, Deb, Sindhya, and Okabe Citation2007) method and in case of categorical part as the dimensionality is more so two-point crossover is applied. A ordinated is assessed () such that area under probability curve is equal to a random number (
) generated between [0,1].
The parameter distribution for child solution generated is represented by
where acts as a controlling parameter. The higher value of
fetches child to be identical to the parent. The baby spider produced are:
where and
are parents for
generation.
and
are two baby spider produced in that generation. showcases formation of baby spiders for two parent pairs. The parameters for SBX taken are
and
. In case of categorical features, points 1 and 3 are taken.
Figure 4. Mating procedure showcasing brood formation.
Figure 5. Running time of four algorithms on different credit card datasets.
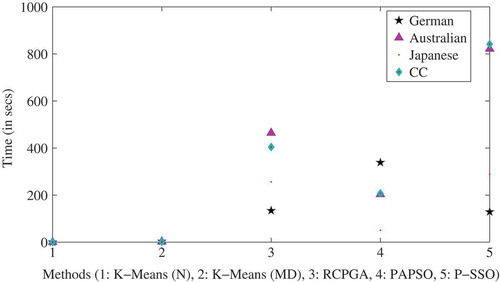
The total population formed include original and new formed by updating and mating are evaluated using fitness Equation (3). The fittest agents are retained to form population for next generation. The spider with a minimum value of fitness represents best optimal cluster center.
The termination criterion for the algorithm designed is a fixed number of generations until desired convergence is achieved. The metric of convergence is when the center heads movement become constant over the iterations.
Parallel SSO for improved clustering (P-SSO)
The objective over here is to reduce run-time of the original SSO algorithm. In O-SSO algorithm position update for spiders are in sequential mode. In the proposed algorithm, the original version has been modified to achieve parallel programming using independent parallelism. It’s is carried out on MATLAB platform using para for looping. Here, each execution of the instruction within a loop is an iteration. There is a local profile consists a pool of MATLAB workers which evaluate these iterations in no particular order, and work independently of each other. Each worker is assigned one iteration of the loop. If there are more iterations than workers, some perform more than one loop iteration; in that case, a worker might receive multiple iterations at once to reduce communication time. The system on which it’s implemented consisted of eight workers in the local pool. The three types of position updates: Female update presented in (6), Dominant-male update shown in (9) and the last for Nondominant male update in (11) are made to run in parallel.
Experimental results and discussion
Comparative algorithms
The performance of the proposed P-SSO is compared with other evolutionary clustering algorithms: Parallel real coded genetic algorithm (PRGA) (Vali Citation2013), parallel particle swarm optimization (PPSO) (Fan and Chang Citation2009). The performance is also compared with K-means (numeric) (Kou, Peng, and Wang Citation2014) and K-means for mix data type. All these are implemented on the same platform with the parameter setting provided in .
Table 1. Parameter settings for various algorithms.
Datasets for analysis
Performance of the proposed model is tested on four real-world credit data sets described in . The datasets are available in UCI Repository of Machine Learning Databases.
Table 2. Real world credit card data set (C = Categorical, F = features, O = observations, CC = credit card).
(1) German credit dataset: This dataset is unbalanced and consists of 700 instances of credit-worthy applicants and 300 instances where credit should not be extended. For each applicant, 24 input variables are considered as a feature vector that includes credit history, account balances, credit purpose, credit amount, employment status, personal information, age, housing, and job title etc. This dataset is contributed by Professor Hans Hofmann, Institut for Statistik and Okonometrie University at Hamburg. This dataset has been a part of following researchers (Ekin et al. Citation1999)-(Eggermont, Kok, and Kosters Citation2004)
(2) Australian credit dataset: This data consists of 307 instances of credit-worthy applicants and 383 instance where credit is not credit-worthy. The source is kept confidential at UCI and no information regarding the parameters of assessment are available. This has been involved in work like (Duch, Grudzinski, and Stawski Citation2000).
(3) Japan credit dataset: This dataset represents positive and negative instances of people who were and were not granted credit. This dataset is contributed by Chiharu Sano. It was generated by collecting the information from each individual at a Japanese company that grants credit.
(4) Credit card approval dataset: This dataset is interesting because there is a good mixture of attributes being continuous, nominal with small and large values. There are also a few missing values. The class distribution is 303 and 307, respectively. The source of the dataset is kept confidential by UCI.
Performance measures
In this paper, to get a comprehensive evaluation of all the comparative algorithms, nine performance criteria have been included. It is a mixture of both internal and external validation techniques. The internal includes Dunn’s index (DI), defines compactness of any cluster. The larger value betters the cluster. Next, is Rand index it comprehends the similarity between clusters. The last is Silhouette , it estimates the extend to which an object lies within a cluster. The value close to 1 resembles a good cluster. The rest five are external measures. The accuracy compares the labels. Better the match best is algorithm. The precision, Recall and F-measure revolves around the notion of percentage of cluster containing correct labeled objects, rate of correct labels and harmonic mean of recall, respectively. The last is computational complexity captured in terms of CPU time in seconds.
Simulation environment
The whole designed setup is carried out on MATLAB version R2015a on Intel core(™) i7 processor 2.40 GHz CPU along with 8 GB of inbuilt RAM in Windows-8 (64-bit).
Results and discussion
The weight factor in objective function plays an important role in the results achieved. In order to study it’s prominent effect on the results variables
is taken over a range and
values are reported for German dataset in . Through, results one can observe that
ranging from 0.15 to 0.45 provides better performance. Thus, in this work the value of
is taken 0.45 under study.
Table 3. Analysis of weight factor in terms of Sil parameter for German dataset.
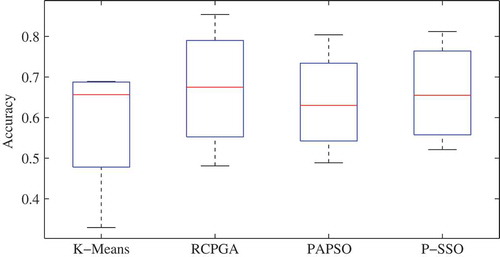
There are only two inherit clusters present in each of the dataset under consideration. The analysis is carried out using above performance measures discussed and results obtained for the four datasets are included in –. The results for German and Australian datasets are compared with that reported in Kou, Peng, and Wang (Citation2014). The author had applied a numerical fitness metric to segregate clusters. In the case of German dataset, results are tabulated in . Sil index is high, this exhibits that objects are well within the limits of cluster boundaries. But, DI is only 50% that shows the clusters are not far apart. There is an overlapping characteristic. Thereby, accuracy is low. While in the case of the results are better. There is a comparative fall in accuracy for last two datasets results in and 8. This could be due to missing value effect. The clusters in these datasets are irregular in shape. They are random and overlapping in nature. Thus, based on these measures one can say that labels are correctly assigned but to obtain two distinct set of clusters is not approachable. The time complexity of all algorithms has been shown in for different datasets. P-SSO has taken maximum time for analysis. The variation in performance of a clustering algorithm has been captured using box plots for sensitivity in and accuracy in . Through these plots, it is evident that accuracy as well as sensitivity achieved by proposed method is high as compared to other methods reported. As the model designed is unsupervised in nature, data of any new applicant can be added to the existing database and lender could easily get a label assigned which helps the lenders to bifurcate the applicant as credit worthy or not.
Table 4. The results obtained with nine performance measures for German data set. (N = numeric and MD = mixed data).
Table 5. The results obtained with nine performance measures for Australian data set (N = numeric and MD = mixed data).
Table 6. The results obtained with nine performance measures for Japanese data set.
Table 7. The results obtained with nine performance measures for credit card approval data set.
Figure 6. Box plots representing the distribution of the accuracy obtained by the proposed P-SSO along with K-means, PRGA and PPSO clustering algorithms.
Conclusion
In this article, parallel SSO algorithm based on swarm intelligence is designed for clustering mixed data. The designed approach is further tested on real life application, i.e. obtaining credit card score of an individual. The original SSO is modified in terms of coding scheme, fitness function, mating and inherent parallelism is exploited for enhancing speed of operation. The validation of model is done by employing nine internal and external measure by comparing various standard algorithms. As, the data is already pre-labeled, a mixture of various validation measures are included. Through results it’s evident that for datasets like Germen, outcome is only 25% with numeric and with mixed data 80% of index. The analysis of weight factor
in objective function for Germen dataset is done. Through results, one can infer that, there are low values of internal validation measures reported in most Australian data set. This showcases the inherent characteristics of dataset being overlapping in nature. Thus, to obtain a clear demarcated set of two is next to impossible. In future, the authors would like to explore characteristic of dataset and target to obtain large credit card dataset, especially in Indian context.
Additional information
Funding
References
- Agrawal, R. B., K. Deb, and R. Agrawal. 1995. Simulated binary crossover for continuous search space. Complex Systems 9:115–48.
- Brockett, P. L., X. Xia, and R. A. Derrig. 1998. Using Kohonen’s self-organizing feature map to uncover automobile bodily injury claims fraud. The Journal of Risk and Insurance 65:245–74. doi:10.2307/253535.
- Camacho, D. 2015. Bio-inspired clustering: Basic features and future trends in the era of big data. Cybernetics (CYBCONF), 2015 IEEE 2nd International Conference, Poland, 1–6. IEEE.
- Chen, W., G. Xiang, Y. Liu, and K. Wang. 2012. Credit risk evaluation by hybrid data mining technique. Systems Engineering Procedia 3:194–200. doi:10.1016/j.sepro.2011.10.029.
- Cox, E. 1995. A fuzzy system for detecting anomalous behaviors in healthcare provider claims. Intelligent Systems for Finance and Business :111–34.
- Cuevas, E., and M. Cienfuegos. 2014. A new algorithm inspired in the behavior of the social-spider for constrained optimization. Expert Systems with Applications 41:412–25. doi:10.1016/j.eswa.2013.07.067.
- Cuevas, E., M. Cienfuegos, R. Rojas, and A. Padilla. 2015. A computational intelligence optimization algorithm based on the behavior of the social-spider. Computational Intelligence Applications in Modeling and Control, 123–46. Springer.
- Deb, K., K. Sindhya, and T. Okabe. 2007. Self-adaptive simulated binary crossover for real-parameter optimization. Proceedings of the 9th annual conference on Genetic and evolutionary computation, 1187–94. London, UK: ACM.
- Duch, W., K. Grudzinski, and G. Stawski. 2000. Symbolic features in neural networks. Proceedings of the 5th Conference on Neural Networks and Their Applications. Belgrade, Yugoslavia: Citeseer.
- Eggermont, J., J. N. Kok, and W. A. Kosters. 2004. Genetic programming for data classification: Partitioning the search space. Proceedings of the 2004 ACM symposium on Applied computing, 1001–05. Nicosia, Cyprus: ACM.
- Ekin, O., P. L. Hammer, A. Kogan, and P. Winter. 1999. Distance-based classification methods. INFOR: Information Systems and Operational Research 37:337–52.
- Fan, S. K. S., and J. M. Chang. 2009. A parallel particle swarm optimization algorithm for multi-objective optimization problems. Engineering Optimization 41:673–97. doi:10.1080/03052150902752058.
- Huang, Z. 1997. Clustering large data sets with mixed numeric and categorical values. Proceedings of the 1st pacific-asia conference on knowledge discovery and data mining, (PAKDD), 21–34. Hyderabad, India: Citeseer.
- Jie, L., G. Xinbo, and J. Li-Cheng. 2004. A CSA-based clustering algorithm for large data sets with mixed numeric and categorical values. Intelligent Control and Automation, 2004. WCICA 2004. Fifth World Congress on, 2303–07. Hangzhou, China: IEEE.
- Kim, W. 2009. Parallel clustering algorithms: Survey. Parallel Algorithms, Spring.
- Kou, G., Y. Peng, and G. Wang. 2014. Evaluation of clustering algorithms for financial risk analysis using MCDM methods. Information Sciences 275:1–12. doi:10.1016/j.ins.2014.02.137.
- Luhn, H. P. 1958. A business intelligence system. IBM Journal of Research and Development 2:314–19. doi:10.1147/rd.24.0314.
- Martins, M. C. M., and M. G. Cardoso. 2008. Evaluation of clusters of credit card holders. Open University.
- Nanda, S. J., and G. Panda. 2013. Automatic clustering algorithm based on multi-objective immunized PSO to classify actions of 3d human models. Engineering Applications of Artificial Intelligence 26:1429–41. doi:10.1016/j.engappai.2012.11.008.
- Nanda, S. J., and G. Panda. 2014. A survey on nature inspired metaheuristic algorithms for partitional clustering. Swarm and Evolutionary Computation 16:1–18. doi:10.1016/j.swevo.2013.11.003.
- Shukla, U. P., and S. J. Nanda. 2016. Parallel social spider clustering algorithm for high dimensional datasets. Engineering Applications of Artificial Intelligence 56:75–90. doi:10.1016/j.engappai.2016.08.013.
- Talia, D. 2002. Parallelism in knowledge discovery techniques. International Workshop on Applied Parallel Computing, 127–36. Berlin, Heidelberg: Springer.
- Vali, M. 2013. New optimization approach using clustering-based parallel genetic algorithm, arXiv eprint arXiv:1307.5667.
- Williams, G. J., and Z. Huang. 1997. Mining the knowledge mine. Australian Joint Conference on Artificial Intelligence, 340–48. Perth, Australia: Springer.
- Yeo, A. C., K. A. Smith, R. J. Willis, and M. Brooks. 2001. Clustering technique for risk classification and prediction of claim costs in the automobile insurance industry. Intelligent Systems in Accounting, Finance and Management 10:39–50. doi:10.1002/isaf.196.
- Zheng, Z., M. Gong, J. Ma, L. Jiao, and Q. Wu. 2010. Unsupervised evolutionary clustering algorithm for mixed type data. Evolutionary Computation (CEC), 2010 IEEE Congress on, 1–8. Barcelona, Spain:IEEE.