
ABSTRACT
Given the magnitude of monetary transactions at auction sites, they are very attractive to fraudsters and scam artists. Shill bidding (SB) is a severe fraud in e-auctions, which occurs during the bidding period and is driven by modern-day technology and clever scammers. SB does not produce any obvious evidence, and it is often unnoticed by the victims. The lack of availability of training datasets for SB and the difficulty in identifying the behavior of sophisticated fraudsters hinder research on SB detection. To safeguard consumers from dishonest bidders, we were incentivized to investigate semi-supervised classification (SSC) for the first time, which is the most suitable approach to solving fraud classification problems. In this study, we first introduce two new SB patterns, and then based on a total of nine SB patterns, we build an SB dataset from commercial auctions and bidder history data. SSC requires the labeling of a few SB data samples, and to this end, we propose an anomaly detection method based on data clustering. We addressed the skewed class distribution with a hybrid data sampling method. Our experiments in training several SSC models show that using primarily unlabeled SB data with a few labeled SB data improves predictive performance when compared to that of supervised models.
Introduction
Unquestionably, e-commerce has taken the world by storm. In 2017, this sector accounted for over 2.3 trillion dollars in sales with an expected increase to 4.5 trillion by 2021 (statista.com Citation2019). Several factors are driving the demand for e-commerce transactions, including 24/7 ac- cessibility, product availability and variety, detailed product descriptions, and friendly return policies. One segment of this economic activity is the lucrative auction marketplace. Given the magnitude of monetary transactions, auction sites are very attractive to fraudsters and scam artists. According to the Internet Crime Complaint Center, in 2015, 21510 complaints related to auction fraud were recorded along with a financial loss estimated at $19 million (I. C. C. Center-IC3 Citation2015). Fraudulent activities in e-auctions typically occur within one of three time frames: pre-auction (e.g., misrepresented items and black-market items), in-auction (e.g., shill bidding and bid shielding), and post-auction (e.g., non-delivered items) (Ford, Xu, and Valova Citation2012). Pre- and post- auction crimes can be documented by buyers, as they are supported by physical evidence. However, in-auction fraud, which occurs during the bidding period, does not produce any obvious evidence, and it is often unnoticed by the victims, namely the win- ning buyers (Xu, Bates, and Shatz Citation2009). Shill bidding (SB) is a pernicious online activity that plagues the auction industry. Shill bidders are merely “fakes” who compete in consort with accomplice sellers. Their sole purpose is to artificially elevate the prices of the items (goods and services) (Ganguly and Sadaoui Citation2018). To date, there are no solid statistics measuring the financial impact of this type of fraud. Yet, the eBay community (ebay.com Citation2017) reveals numerous complaints from buyers along with their monetary losses. SB fraud may undermine the confidence of bidders, buyers, and even sellers as explained below:
Bidders attempt to detect SB independently by tracking the behavior of their competitors and communicating their suspicions to eBay. Very recently, the bidders’ IDs and history became unavailable on eBay. We believe that this new policy of blocking the bidding history is aimed at preventing the discovery of SB activitie.
Buyers are the most affected by SB, as the price they pay for items is vastly inflated. The price is driven up by disingenuous bidders with no intention of ever “winning the bid”. For instance, NBC News disclosed that on eBay, a bidder paid $1,825 for a collection of ”1959 Topps baseball cards” (nbcnews.com Citation2019). However, two undercover detectives determined that the purchaser ended up paying an extra $531 because SB was conducted by the seller using an alternate identity.
Sellers complain that their auctions get less attention from bidders because they do not participate in shilling activities, while sellers who do actually engage in SB go unrecognized and unpunished. Indeed, to avoid being detected, a shill may mimic normal bidding behavior, or use phony accounts, or hire fake bidders anywhere in the world to participate in the scam.
Given the large volume of auctions conducted every day at a commercial site like eBay, it is very challenging to monitor the behavior of bidders in order to detect SB fraud in real time, especially when the auctions involve many users and are of long durations, e.g., seven and ten days. Machine-learning algorithms (MLAs) may prove crucial in meeting this chal- lenge. To date, the application of MLAs to auction fraud has been limited, in contrast with their application to fraud detection in other industrial sectors. In addition to the difficulty in identifying relevant SB patterns, research has been hindered by the absence of training data required to develop SB classification models. The availability of authentic data denoting the real behavior of bidders, is essential for building robust fraud detection models. Nevertheless, obtaining SB data is a very laborious task, as demonstrated in this study. In fact, we first need to scrape a large amount of data from a commercial auction site and the bidder history as well, preprocess the raw data collected, implement algorithms to quantify the SB patterns, and finally evaluate each SB metric for each participant in each auction in order to produce the SB training data. In this present work, we tackled the fraud detection problem using the semi-supervised classification (SSC) that has proven effective in applications where it is challenging to obtain labeled training data. SSC is capable of learning efficiently with relatively few labeled data (Klassen et al. Citation2018). To this end, we first propose a strategy to select the SB samples to be labeled, and then, to facilitate the labeling task, we applied and validated several data clustering techniques to generate high-quality clusters of bidders. Additionally, we introduced an approach for detecting anomalies, i.e., fraudulent samples in the clusters. However, the labeled subset produced was imbalanced, and we solved this problem by applying a hybrid data sampling technique. Lastly, we developed several SSC-based SB detection models, and compared their predictive performance based on several quality metrics. Our aim was to determine the optimal SB classifier, which will
be the key to distinguishing between genuine and fraudulent bidders. Below, we highlight the main contributions of our research over past studies:
After an extensive examination of the eBay policies as well as the auction and bidder data we scraped, we introduced two new SB strategies and defined algorithms to quantify them. Moreover, we implemented and improved the metrics of seven other SB patterns from the literature.
To label the training data, we propose a new approach to detect anomalies in the clusters by combining the SB scores of bidders and the three sigma rule.
This is the first time, as far as we know, that SSC is investigated for SB detection. This method is the most suitable for our fraud classification problem based on the lack of labeled data. As SSC requires few labeled samples, we are able to check the ground truth before the classification task and build more accurate fraud classifiers.
Our empirical data analysis employs the most recent fraud data. In fact, from the eBay site, we crawled a large number of auctions involving a particularly hot product as well as the bidder history. Note that this is the first time that the bidder history has been utilized to measure SB patterns. In addition, the preprocessing of the two raw datasets is very difficult and requires a deep understanding of the bidding behavior. We aim to share the auction and bidder history datasets as well as the SB training dataset with the research community.
This work also investigates the effect of having many unlabeled data along with few labeled ones on classification performance. It assesses whether SSC can optimize the accuracy of supervised classifiers for our fraud dataset by building six different models (supervised and semi-supervised) and compares their performance using the most common metrics in the fraud domain.
Related Work
Numerous studies have applied SSC to the field of fraud detection and have led to a highly satisfactory classification outcome. In this section, we examined a very recent work published in 2018. For instance, to detect fraud in tweets, Sedhai and Sun (Citation2018) proposed an adaptive SSC framework consisting of two parts: a batch mode and a real-time mode. In the batch mode, the detection model is updated by capturing new spamming behaviors and vocabu- lary. The authors produced training data based on an old dataset containing a large number of tweets from 2013. In the original dataset, instances come with labels obtained manually or automatically. The authors randomly selected some of the data labeled automatically and manually relabeled them in order to expand the ground truth. For training, they only used 6.6% of the tweets and the remainder was used for testing. They compared the proposed system called S3D, which updates after each time window, to four other classifiers: random forest, naive Bayes, logistic regression, and S3D-Update (without batch update). Based on three quality metrics, S3D was shown to be superior to the four classifiers and demonstrated a strong capability to learn new patterns and vocabulary. However, this study focuses on detecting spam tweets, not suspicious users. The identification of fraudsters is a challenging task, yet an important one, as users can continue conducting fraud as long as they are not suspended. The Irish commission for energy regulation released a dataset collected in 2009 and 2010 of approximately 5,000 Irish households. Very few samples of the dataset were manually labeled after inspections, as almost 90% of the data was unlabeled because of the difficulty of the inspections. Viegas, Cepeda, and Vieira (Citation2018) took advantage of the few labeled data and used them for SSC in order to detect electricity fraud by consumers. The labeled data was imbalanced, so they added simulated data to overcome the problem. Random forest (RF) co-training was employed to develop the classification models by varying the percentages of labeled data: 10%, 20%, and 30%. More precisely, the authors trained the random forest classifier on 10% of the labeled data. Then, they gradually added the samples that the model can predict with greatest confidence. Their results showed that using 90% unlabeled samples yielded the best accuracy. RF, which creates a bagging ensemble of decision tree classifiers, was used as a base (supervised) classifier. They demonstrated that SSC is superior to supervised classifiers. Yilmaz and Durahim (Citation2018) proposed a framework for spam review detection. The framework combines data extracted from reviews and a reviewer-product net- work structure. This work used labeled datasets from three reviews involving restaurants and hotels (one from 2013, and two from 2015). The authors applied three models to review the data and examine the accuracy of the vector representations: 1) Node2vec to learn from the reviews; 2) Doc2vec to learn from the products and reviewer-network structure, and 3) SPR2EP = Node2vec + Doc2vec to learn from the reviews, products, and reviewers. The hy- brid model achieved the best performance. Social networking services (SNSs) are continually targeted by social bots, which are phony users mimicking genuine behavior. To detect botnets in a Twitter-like SNS, Dorri, Abadi, and Dadfarnia (Citation2018) developed an SSC technique that merges the data on the social graph and the data on the social behavior of users. They used a popular training dataset consisting of the information of legitimate users, spammers, and tweets. They also used two random graph generators to model users’ social interactions, in- cluding genuine social bot regions. To determine the initial anomaly scores of the unlabeled data, a 1-class support vector machine (SVM) classifier was first trained with a social graph of users and a subset of labeled genuine users. Then, to detect social bots, the anomaly scores were revised by modeling the social interactions of users as a Markov random field (MRF) and implementing the belief propagation in the MRF. Furthermore, for testing purposes, 500 unlabeled social bots and 9,000 unlabeled genuine users were used. The experiments showed that the proposed system was able to discover social bots with low false positives in a sat- isfactory processing time. Salazar, Safont, and Vergara (Citation2018) investigated the performance of SSC for imbalanced classification problems, more specifically for the detection of fraud in credit card transactions. The authors solved the class imbalance problem by generating artificial data. For this purpose, they applied the iteratively amplitude adjusted Fourier trans-form (IAAFT) algorithm. They used three binary learning algorithms on the original labeled dataset combined with the self-training SSC algorithm on the data subset. The following classifiers were used: quadratic discriminant analysis (QDA), linear discriminant analysis (LDA), and a non- Gaussian mixture-based (NGM) analysis. The focus was on measuring the effect of SSC and synthetic data as well. The actual dataset contained 40 million and 2,500 records of normal and fraudulent operations, respectively. Five subsets were chosen randomly, each one containing 20% of the legitimate transactions and a number of fraudu- lent transactions. Seven levels were implemented regarding the percentage of surrogate data: 0%, 20%, 33%, 50%, 75%, 83%, and 90%. The experiments demonstrated that SSC could improve the detection F/L ratios (ratio of the number of fraudulent transactions over legitimate ones), and proved that using surrogate data improves the detection performance. The goal by Narayan, Rout, and Jena (Citation2018) was to detect review spams based on an SSC algo- rithm called PU-learning. The latter learns from a few positive samples and unlabeled data. More specifically, the authors evaluated SSC and six other classifiers based on an old publicly available dataset from 2011, which contains 800 opinion reviews from honest and dishonest users. To build the test dataset, 160 opinions were randomly chosen, 50% being unreliable and 50% honest. The remaining opinions were employed in various sizes as training datasets, containing 40, 80, and 120 unreliable opinions. However, 520 unlabeled examples were used in all cases. Among the selected classifiers, k-nearest neighbor (KNN) was the best algo- rithm when trained with 80 examples of dishonest opinions. However, the highest accuracy obtained was only 78.12% with an F-score of 76.67. A review of the literature indicates that SSC produces strong performance in the fraud detection field although old data was used by these studies. Using the latest data and policies, as in our work, is essential to developing robust fraud detection models.
Scraping of Auction and Bidder Data
We crawled data from the eBay website for a period of three months in 2017. To do so, we employed a professional Web scraper that retrieved auctions of the popular ”iPhone 7” based on user-defined filters. Moreover, for each bidder that participated in the targeted auctions, we scraped their full history information. We conducted the following preprocessing operations on both Auction and Bidder History tables (). All details regarding the data extraction and preprocessing are given in our previous work (Elshaar and Sadaoui Citation2019).
Table 1. Statistics of before and after preprocessing raw data.
Data cleaning: we deleted duplicated records, records with missing or fully masked bidder’ IDs, and attributes that were irrelevant to our SB patterns.
Data reformatting and merging: we reformatted four attributes related to the date and time into their equivalent serial numbers. Then, we merged them into a single attribute that denotes the elapsed time between the auction starting time and the placed bid time.
Currency conversion: we converted all currencies using Kutools (an add-in tool in Excel) into US dollars based on the currency exchange rates w. r. t. the period in which the data was collected.
Attribute addition: for identification purposes, we generated a unique identifier for each auction based on two attributes,” Seller ID” and” Product URL”.
Data correction: there are some attributes that possess inconsistent values. For exam- ple, the” Number of Bids” attribute is often higher than the number of actual submitted bids. So, we replaced the invalid values with corrected ones.
SB Strategies
Sadaoui and Wang (Citation2017) investigated the literature and compiled seven SB patterns that oc- cur frequently in auctions infected with SB. The descriptions of these patterns are given in
. We assign different weights to the fraud patterns w. r. t. their behavior and importance, which are divided into three scores: Low(L), Medium(M), and High(H). We implement the seven patterns with MS SQL server 2017 based on the formulas given by Sadaoui and Wang (Citation2017). The value of a SB metric is in the range of [0, 1]; the higher the value, the more suspicious the bidder being examined. After analyzing thoroughly the eBay rules and policies, we introduce two new fraud patterns () whose algorithms and detailed descriptions are provided in the technical paper by Elshaar and Sadaoui (Citation2019).
Table 2. Description of SB strategies.
”Buyer Rating Based on Items”. On eBay, sellers can rate buyers and vice versa, but only after the transactions have been completed to make the feedback more reliable. As stated in eBay (2013): ”Few shill bidders will have any feedback. This is because they never follow through with transactions and therefore don’t have anyone to leave feedback for them”. In past research (Dong et al. Citation2012; Ford, Xu, and Valova Citation2012), the ”Buyer Rating” (i.e. the number of feedback items) was utilized as an individual SB pattern. Because the ratings can be easily manipulated, in our work, we use it together with the number of products a bidder bid upon in the past 30 days.
”Bid Retraction”. According to the eBay website, bidders can retract their bids under several conditions. If they retract more than normal, it can be a sign of fraud behavior. We employ the number of retractions of a bidder along with his activity with a specific seller during the last month. We consider that if a bidder retracts bids and has a very strong relationship with a seller, then this indicates a colluding behavior.
Outlier Filtering
To build the training dataset, we measured the values of the nine SB patterns against each bidder in each of the 1,444 auctions. As a result, we produced a tally of 11,954 SB samples. Each sample, which represents a bidder’s conduct in an auction, is a vector consisting of the Auction ID, Bidder ID, and values of the fraud patterns. Before the data labeling task, we
must first examine our SB dataset for outliers, as they can cause dire effects on the classifi- cation accuracy (Brownlee Citation2016). Outliers denote samples that are not compatible with the rest of the data, such as extreme values that are out of or at the fringes of a given range. We employed the outlier labeling method called Inter Quartile Range (IQR) (Tukey Citation1977). First, we discard all the values that are out of the range of [0, 1]. Then for the values that remain within this range, we normalize them because some attribute distributions are not Gaussian. Our goal is to prepare an SB dataset that is usable by different machine learning algorithms (MLAs), as some of them (e.g., SVM, KNN, and K-Means) require data re-scaling.
SB Subset Labeling
We now need to prepare the training dataset for the semi-supervised learning task. We propose the following strategy to obtain a proper subset of SB samples for labeling. First, we shuffle all samples, and then divide them into four subsets, each one containing approximately 25% of the dataset. We subsequently select 10% randomly from each quarter. We gather all the data selected in one subset, consisting of 964 samples (almost 10% of the dataset). In the next step, we label the SB subset with the help of data clustering techniques.
Data Clustering
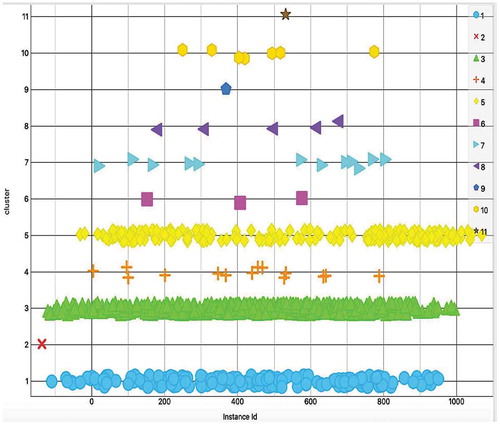
We utilize data clustering to obtain insights into the SB subset distribution and to detect anomalies. Clustering methods group instances based on their similarities. In this study, we employ X-Means and Hierarchical Clustering (HC), as they have previously been applied successfully in the domain of anomaly detection (Ahmed and Mahmood Citation2014; Wang et al. Citation2018). X-Means, an extension of K-Means, automatically estimates the number of clusters based on a pre-defined minimum and maximum numbers of clusters. This method uses the Bayesian Information Criterion to determine the optimal number of clusters and to produce the best model (Pelleg et al. Citation2000). By conducting several experiments, we obtained the best model with eleven optimal clusters. With HC, we are required to specify the linkage criterion (single, complete, average, or centroid) to compute the distance between samples. For our SB subset, we experimentally find that the Centroid Linkage performs better than the other distance functions. An important issue with data clustering is the quality of the clusters. For this purpose, as presented in and , we plotted the clusters against the optimal cluster number to determine where the errors occur. X-Means returns strong clustering results, but HC outperforms it in terms of intra-cluster minimization and inter-cluster maximization.
Figure 1. X-means clustering.
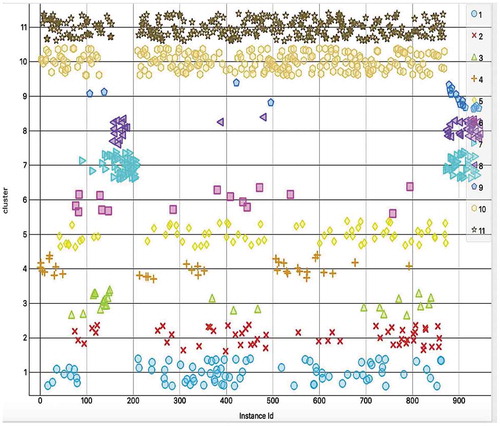
Figure 2. Hierarchical clustering.
We also employ two other validation techniques called Classes to Clusters Evaluation and Classification via Clustering. The former assigns classes to the clusters based on the majority value of the class-attributes within each cluster. The latter assesses the cluster as a classifier by building a meta-classifier that uses clustering for classification. In terms of experimental results, indicates that HC outperforms X-Means qualitatively, as it produced a higher true-positive rate and fewer false positives. However, we still took advantage of X-Means to validate the optimal number of clusters. presents the cluster statistics for HC applied with eleven optimal clusters.
Table 3. Clustering evaluation.
Table 4. Cluster distribution of SB subset.
Data Labeling
The type of data input is very important when selecting a labeling method. Our data consists of a vector of numbers representing the conduct of a bidder in a certain auction. The behavior of shills may appear quite similar to that of normal bidders. Therefore, the cluster will probably include some shills among genuine bidders, which we should not ignore. Consequently, we propose a hybrid approach to label the SB subset by combining the SB scores of the bidders with the Three Sigma Rule. This rule affirms that for many normal distributions, almost all the population lies within three standard deviations of the mean. The standard deviation (σ) measures how far the normal distribution spreads around the mean (µ). We choose it because it helps in comparing datasets with potentially the same mean but different ranges, and it is well known in anomaly detection applications. By contrast, the SB score of a bidder is the total value of the nine fraud patterns in a given cluster. A bidder is a defrauder if his SB score is above the threshold. This means that the fraud score deviates by (µ + σ) from the mean. As an example, in cluster1, among the 170 samples, 18 fraud cases were detected in cluster1 where (µ) = 2.765, (σ) = 0.5577, and the threshold is 3.3227. The highest SB score is 4.160313, for bidder 104. We applied this method to clusters 1, 3, 4, 5, 7, 8, and 10. However, as shown in , clusters 2, 9, and 11 contain only one sample. Hence, we labeled them based on the assumption that if a bidder has three or more SB patterns equal to or greater than 0.80, and at least one of them is in a heavy or medium weight category, then the bidder is labeled as a defrauder. Here, we checked the ground truth for our labeled subset using the same assumption. We also calculated the standard deviation of the fraud class, which is 0.6 (less than 1), indicating that the samples most likely belong to the same category. We randomly chose several instances to examine the validity of their labels. displays examples of frauds labeled by our proposed framework.
Table 5. Bidders in clusters # 2, 9 and 11.
Table 6. Some fraud examples.
Hybrid Data Sampling
As shown in , the SB subset is moderately imbalanced with a ratio of 5:1, which is to be expected in the context of fraud classification problems (Anowar et al., Citation2018). Imbalanced data means that the vast majority of the data belongs to the ”Normal” class and the minority to the ”Fraud” class. Even though the trained classification models yield excellent accuracy, this is deceiving, because all the data will be predicted to be in the majority class while the minority class is ignored. To solve this problem, we apply a hybrid method of data over- and under- sampling. We employ the popular algorithm SMOTE (Synthetic Minority Over-sampling Technique) (Chawla et al. Citation2002), which generates synthetic samples from the minority class using neighboring samples. This method adds artificial data at the end of the training dataset, which may lead to a problem when using K-fold cross vali- dation, as one fold may have a high class concentration. To avoid this issue, we randomly re-order the samples in the SB subset. As mentioned in the original SMOTE paper (Chawla et al. Citation2002), it is better to combine SMOTE with under-sampling (removing data from the majority class). We therefore apply the SpreadSubSample method and set the distribution spread to ”1” to cause both classes to be equal.
Table 7. Balanced SB subset.
SSC-based SB Detection
On the one hand, SSC achieved satisfactory performance; on the other hand, it can optimize supervised classifiers in general. Indeed, previous studies emphasized that having unlabeled data during the training stage helps attain better performance, as shown in the Related Work section. First, we perform SSC based on the “Yet Another Two-Stage Idea”, the Yatsi algorithm (Driessens et al. Citation2006), which carries out the classification in two steps: 1) It builds a model using a binary classifier trained with the labeled data, and 2) it uses the learned model to convert the unlabeled data into weighted data (pre-labeled data with a label and a weight). A KNN is utilized to predict actual labels for the pre-labeled data using a set of Nearest Neighbors (NNs). For each class within the set of NNs, the algorithm sums the weights of each sample belonging to that class, and then labels the sample with the class that has the largest sum of weights.
Setup of the Experiment
Our SB dataset consists of 10,013 samples, 1232 labeled and 8781 unlabeled. To assess the accuracy of the semi-supervised classifiers, we employ the WEKA Workbench. However, as it does not have SSC capability, we plugged in a collective package containing SSC algorithms including Yatsi. We downloaded the package provided through fracpete.github and installed it via the package manager in WEKA 3.8.1. In the first stage, we choose three binary classification algorithms commonly used in the field of fraud detection: IBK (implementation of K-Nearest Neighbors), J48 (implementation of C4.5 Decision Trees), and Naive Bayes. We evaluate the classifiers’ accuracy with 10-fold cross validation (CV). In the second stage, the Yatsi experiments are conducted with the number of NNs (K) set to five, as we obtained the lowest error rate for IBK(6.41%) when K = 5. To speed up the NN search, we chose the KDTree search algorithm and Euclidean distance function. After several experiments, the weighting factor for the unlabeled samples was set to 1.0 (the default value). J48 has two hyper-parameters: M the minimum number of samples per leaf, and C the confidence factor for pruning the trees. shows the parameters, and we found two optimal values for C (0.75 and 0.50) and one for M (2). We chose 0.50 over 0.75 in favor of a smaller tree size.
Table 8. J48 parameters with corresponding incorrectly classified samples.
Performance Evaluation
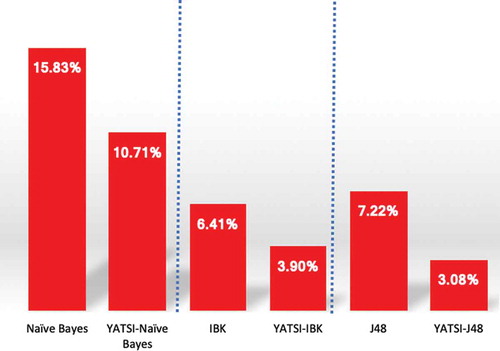
We are interested in evaluating the fraud classifiers regarding their capability to detect SBs rather than normal bidders. We choose the most common metrics used in the fraud domain: precision, recall, F1-score, and area under the curve (AUC). As our labeled training subset is balanced, we also consider the accuracy and error rate to gain a more comprehensive view of the overall performance of each classifier. Overall, the experimental results demonstrate that Yatsi can optimize the supervised classification of our SB data. indicates that the accuracy of the baseline classifiers improved following the application of the Yatsi. The most improved classifier is the Naive Bayes with accuracy increasing by 5%, followed by J48 and IBK, with increases of 4%, and 2.5%, respectively. Furthermore, the error rates were reduced, shown in . However, the results show that certain base clas- sifiers provided better results than some of the SSCs. For example, J48 had better accuracy than Yatsi-Naive Bayes. Here, we emphasize that our focus is on whether SSC can optimize supervised classification; we do not claim that Yatsi is the best classifier among those chosen. In other words, although J48 outperformed Yatsi-Naive Bayes, Yatsi was still able to improve the performance of the Naive Bayes approach. We can see in that Yatsi led to improvements on all base classifiers in terms of precision, recall, F-Measure, and AUC; the slight exception was that Yatsi-IBK was not able to generate a better AUC than standard IBK. As presented in , among the six classifiers, Yatsi-J48 performed the best in terms of precision, F-measure and AUC. However, IBK generated the same AUC as Yatsi-J48. In ad- dition, to decide which SSC model was significantly better, we performed a T- test, which is widely used in comparing classifiers performance. In the Weka-experiment environment, we apply the “paired T-tester-corrected” (the last version available). At the 0.05 level of significance, the Yatsi-Naive Bayes is the worst, and there is no significant difference between Yatsi-J48 and Yatsi-IBk based on their recall. In other words, Yatsi-IBk is significantly better than J48 and Yatsi-Naive Bayes, outperforming them by 5% when detecting suspicious bidders. In conclusion, applying SSC led to an improvement of up to 6%. This gap is very significant in the context of fraud detection.
Table 9. Classifier performance comparison.
Figure 3. Accuracy of Supervised and Semi-supervised Models.
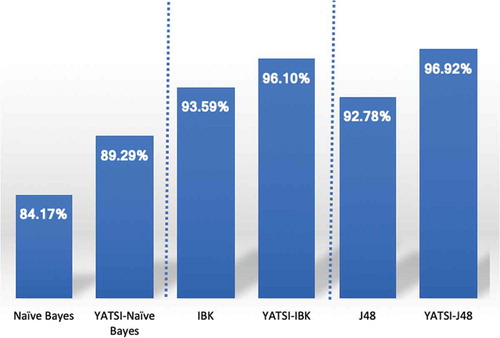
Figure 4. Error Rate of Supervised and Semi-supervised Models.
Conclusion
The difficulties in identifying SB strategies, and the lack of training data, have limited empirical analysis of the detection of bidding fraud in e-auctions. In this study, we first introduced two new SB patterns and then built a high-quality SB training dataset based on nine fraud patterns using both commercial auctions and bidder history. The raw data preprocessing and the computation of the SB patterns were very challenging. To develop the SB classifiers, we employed a semi-supervised learning approach that has been proven effective in classification problems, where labeling multi-dimentional data is challenging. To label a portion of the SB dataset, we properly utilized hybrid clustering method and defined an anomaly detection approach. Next, we used data over-sampling and under-sampling to handle the class imbalance issue. Based on experimental results, the trained SB models could differentiate between normal bidders and fraudsters accurately, and the supervised classifiers were optimized in terms of several quality metrics.
References
- Anowar, F., S. Sadaoui, and M. Mouhoub 2018. “Auction Fraud Classification Based on Clustering and Sampling Techniques”. IEEE 17th International Conference on Machine Learning and Applications, ICMLA, Dec. Orlando, FL, USA. doi: doi:10.1109/ICMLA.2018.00061
- Ahmed, M., and A. N. Mahmood. 2014. Network traffic analysis based on collective anomaly detection.2014 9th IEEE Conference on Industrial Electronics and Applications, Hangzhou, China, 1141–46.
- Brownlee, J. 2016. Master machine learning algorithms: discover how they work and implement them from scratch. https://books.google. ca/books?id=PdZBnQAACAAJ.
- Chawla, N. V., K. W. Bowyer, L. O. Hall, and W. P. Kegelmeyer. 2002. Smote: Synthetic minority over-sampling technique. Journal of Artificial Intelligence Research 16:321–57. doi:10.1613/jair.953.
- Dong, F., S. M. Shatz, H. Xu, and D. Majumdar. 2012. Price comparison: A reliable approach to identifying shill bidding in online auctions? Electronic Commerce Research and Applications 11 (2):171–79. doi:10.1016/j.elerap.2011.12.003.
- Dorri, A., M. Abadi, and M. Dadfarnia. 2018. Socialbothunter: Botnet detection in twitter- like social networking services using semi-supervised collective classification. 2018 IEEE 16th Intl Conf on Dependable, Autonomic and Secure Computing, 16th Intl Conf on Pervasive Intelligence and Computing,4th Intl Conf on Big Data Intelligence and Computing and Cyber Science and Technology Congress (DASC/PiCom/DataCom/Cy- berSciTech), Greece, Athens. IEEE, 2018, 496–503.
- Driessens, K., P. Reutemann, B. Pfahringer, and C. Leschi. 2006. Using weighted nearest neighbor to benefit from unlabeled data. Pacific-Asia Conference on Knowledge Discovery and Data Mining. Springer, 60–69.
- Elshaar, S., and S. Sadaoui. 2019. Building High-quality Auction Fraud Dataset. Computer and Information Science; Vol. 12, No. 4; 2019, ISSN 1913-8989, E-ISSN 1913-8997, Canada. doi:10.5539/cis.v12n4p1
- Ford, B. J., H. Xu, and I. Valova. 2012. A real-time self-adaptive classifier for identifying suspicious bidders in online auctions. The Computer Journal 56 (5):646–63. doi:10.1093/comjnl/bxs025.
- Ganguly S., Sadaoui S. 2018. Online Detection of Shill Bidding Fraud based on Machine Learning Techniques. 31st International Conference on Industrial, Engineering & Other Applications of Applied Intelligent Systems LNCS, Springer, Montreal, Canada. doi:10.1007/978-3-319-92058-0_29.
- I. C. C. Center-IC3. 2015. 2015 internet crime annual report. [Online]. Accessed 04, 2017. https://pdf.ic3.gov/2015_IC3Report.pdf.
- Klassen, S., J. Weed, D. Evans, and M. D. Petraglia. 2018. Semi-supervised machine learning approaches for predicting the chronology of archaeological sites: A case study of temples from medieval Angkor, Cambodia. PloS One 13 (11):e0205649. doi:10.1371/journal.pone.0205649.
- Narayan, R., J. K. Rout, and S. K. Jena 2018. Review spam detection using semi-supervised technique. Progress in Intelligent Computing Techniques: Theory, Practice, and Applications, 281–86. Springer.
- Nbcnews, “Cautionary tales of two auctions”. Accessed 02, 2019. http://www.nbcnews.com/id/3078735/ns/technology_and_science-tech_and_gadgets/t/cautionary-tales-two-auctions/#.XL_SvZNKgch.
- Pelleg, D., A. W. Moore, et al. 2000. X-means: Extending k-means with efficient estimation of the number of clusters. In Icml 1:727–34.
- statista.com, Retail e-commerce sales worldwide from 2014 to 2021. Accessed 01, 2019. https://www.statista.com/statistics/379046/worldwide-retail-e-commerce-sales/.
- Sadaoui, S., and X. Wang. 2017. A dynamic stage-based fraud monitoring framework of multiple live auctions. Applied Intelligence 46 (1):197–213. doi:10.1007/s10489-016-0818-7.
- Salazar, A., G. Safont, and L. Vergara. 2018. Semi-supervised learning for imbalanced classification of credit card transaction. 2018 International Joint Conference on Neural Networks (IJCNN), Budapest, Hungary. IEEE, 1–7.
- Sedhai, S., and A. Sun. 2018. Semi-supervised spam detection in twitter stream. IEEE Trans- Actions on Computational Social Systems 5 (1):169–75. doi:10.1109/TCSS.2017.2773581.
- The eBay community. Accessed 01, 2017. https://community.ebay.com/.
- Tukey, J. 1977. Exploratory data analysis, ser. Addison-Wesley series in behavioral science. Boston, USA: Addison-Wesley Publishing Company. https://books. google.ca/books?id=UT9dAAAAIAAJ.
- Viegas, J. L., N. M. Cepeda, and S. M. Vieira. 2018. Electricity fraud detection using committee semi-supervised learning. 2018 International Joint Conference on Neural Networks (IJCNN), Rio, Brazil. IEEE, 1–6.
- Wang, Y., K. Qin, Y. Chen, and P. Zhao. 2018. Detecting anomalous trajectories and behavior patterns using hierarchical clustering from taxi GPS data. ISPRS International Journal of Geo-Information 7 (1):25. doi:10.3390/ijgi7010025.
- Xu, H., C. K. Bates, and S. M. Shatz. 2009. Real-time model checking for shill detection in live online auctions. Software Engineering Research and Practice. 134–40. doi:10.1177/17531934097488.
- Yilmaz, C. M., and A. O. Durahim. 2018. Spr2ep: A semi-supervised spam review detection framework. 2018 IEEE/ACM International Conference on Advances in Social Networks Analysis and Mining (ASONAM), Barcelona, 306–13. doi:10.1142/S2424835518400015.