
 ?Mathematical formulae have been encoded as MathML and are displayed in this HTML version using MathJax in order to improve their display. Uncheck the box to turn MathJax off. This feature requires Javascript. Click on a formula to zoom.
ABSTRACT
Lignite is one of the most important energy sources. An important problem in the economic and technical evaluation of lignite reserves is to measure lignite quality. The quality of lignite depends on some parameters such as moisture, ash, sulfur, and calorific values. The assessment of the parameters has a critical importance. The lignite data obtained from Kalburçayı area of the Sivas-Kangal Basin (SKKB) and the dataset in the Turkey Lignite Inventory (TLI) were used in this article. In addition to the average values given in TLI, another set (SKKB), which beyond the inventory, has been employed. By this way, comparable data were created for performing the modeling and classification work. To make lignite quality classification, a study was performed in five steps. In the first step, the calorific values have been used for verification by the k-means method. The coal lignite data are seperated into two groups, low and high quality. In the second step, wavelet families have been applied to the properties of moisture, ash, and sulfur regulated in the first step. The applied wavelet families such as haar, daubechies, symlet, biorspline, and reversebiorspline were used and the approximate coefficients produced by wavelet families have been obtained. In the third step, the features obtained in the second step have been given to random forest, discriminant analysis, and decision tree classifiers as input. In the next step, the quality classification performances have been compared for lignite coal data derived from SKKB and TLI. While the highest quality classification performance of lignite coals in the SKKB area has been found as 93.75%, the highest quality classification performance for lignite coals obtained from TLI has been found about 100%. In the final step, the success rates provided in this study have been compared with the conventional applications in literature. The results showed that the success rates of classification recorded by the proposed method better performs than the studies used for the comparison. Because this study addresses a hybrid work, more transparent and flexible classification structures can be provided. Making an effective and reliable classification between high and low lignite calorifics can provide some possibilities for decision-makers.
Introduction
Variables such as moisture, ash, and sulfur that affect lignite quality have a vital importance in power plants, other areas, and energy production. Therefore, modeling of these variables is helpful for investment decisions (Moon and Whateley Citation2006; Korkmaz and Esmeray Citation2018; Tutmez, Hozatli, and Cengiz Citation2013). Most of the low calorific value of lignite deposits in Turkey has a high ash, moisture, sulfur contents, and volatile matter. Most of the low calorific value of lignite deposits in Turkey has a high ash, moisture, sulfur contents, and volatile matter (Korkmaz and Esmeray Citation2018; Senguler Citation2010; Tutmez, Hozatli, and Cengiz Citation2013). Lignite coal reserves are found in many countries of the world. According to information received from the International Energy sources, Turkey’s lignite production is about 65.0 million tons and the most important countries lignite resources in the world are in Turkey (Korkmaz and Esmeray Citation2018; Tutmez, Hozatli, and Cengiz Citation2013). Lignite coal provides significantly contribute to the growth of the Turkey national product. Numerous experimental and mathematical/statistical techniques have been used in the literature to classify and model the relationship between lignite quality parameters (Korkmaz and Esmeray Citation2018; Galetakis, Theodoridis, and Kouridou Citation2002; Tutmez, Hozatli, and Cengiz Citation2013).
In one study, a classical clustering technique the K-Means Clustering that known as Artificial Intelligence-Based (AI) and Self-Organizing Map (SOM) methods has been used to classify Indian coal for the first time. Seventy-nine Indian coal samples have been used. This study has suggested that SOM and K-means-based classification results have shown that similarity in 75% of lignite coal samples (Korkmaz and Esmeray Citation2018; Pandit et al. Citation2011). In another article, 51 coal samples from different areas with low and high sensitivity have been collected from big coal fields of India. An approach has been suggested using the fuzzy k-methods for the classification of these coal. With this approach, the suggested algorithm is applied using the parameters of moisture content, ash content, and transition point temperature of coal samples to distinguish coal ends from three different categorizations. This classification provides planners and site engineers with information that it would be useful to take precautionary measures to prevent mine fires. The classification rate of the coal is found at 85.45% (Korkmaz and Esmeray Citation2018; Sahu, Mahapatra, and Panigrahi Citation2012). In another article, 29 coal samples have been taken from various classes with high and low sensitivity ratings from coal regions in India. It has been applied the discrete particle swarm optimization approach to present the clustering problem as a linear model and to classify the coal veins. The objective function value has been obtained as 89.59% (Korkmaz and Esmeray Citation2018; Sahu et al. Citation2011). In a study, a remote sensing-based methodology is suggested for quantifying the effect of surface mining activity and reclamation from a watershed to local scale. The method is based on a support vector machines (SVMs) classifier combined with multi-temporal change determination of Landsat TM imagery. The performance of the technique has been obtained for selected open mining sites located in the island of Milos in Greece. Data row number has been taken as 34. Evaluation of the mining effect in the studied areas has been based on the confusion matrix statistics, supported by co-orbital QuickBird-2 very high spatial resolution imagery. Overall classification success of the thematic land cover maps produced has been obtained over 90% (Petropoulos, Partsinevelos, and Mitraka Citation2013). In another paper is presented the implementation of three regression models, SVM, alternating conditional expectation (ACE), and backpropagation neural network (BPNN) to estimate the gross calorific value (GCV) of coals based on proximate analysis information. Analytical data of 76 Chinese coal samples, with a great diversity in rank, have been acquired and used as input into these models. The highest calorific classification rate has been found with SVM. Success rate obtained with SVM is 94.5%. Success rate obtained with ACE is 91.2%. Success rate obtained with BPNN is 87.6% (Feng et al. Citation2015). In another study, relationships among ultimate and proximate analyzes of 6,339 US coal samples from 26 states with GCV have been researched by random forest (RF) and multivariable regression (MVR) models. Models have indicated that the ultimate analysis parameters are the most suitable estimators for GCV and that RF can estimate GCV quite satisfactory. Similar results have been obtained with RF and MVR methods. And the result is obtained as 97% (Matin and Chehreh Chelgani Citation2016). The results of proximate analysis of University of Kentucky Center coal samples for Applied Energy Research have been used to predict Free Swelling Index using Adaptive Neuro Fuzzy Inference System (ANFIS) and MVR. A number of the coal samples are 800. Moisture, ash, and volatile matter feature of coal are used for input. Success rate obtained with MVRis 83.81%. Success rate obtained with ANFİS is 98.78% (Khorami et al. Citation2011).
However, some of the problem structures used in geo-systems, in general, may include differences in outcome variables rather than continuous responses familiar to the linear regression. For this reason, in some cases, some analysis should be done for outcomes rather than conventional approaches. Under these conditions, k-means, wavelet transform and RF, decision trees (DTs), discriminant analysis (DA) classification methods can be used together to provide information about the relationship and strengths of the variables.
K-means, Wavelet Transform Families, RF, DTs, and DA methods are some of the well-known data mining techniques. Generally, they are used by the researchers independently. However, these techniques can be combined via an ensemble learning procedure for improving the classification accuracy. In data mining operation, one of these methods is connected to the others. Under these conditions, k-means, wavelet transform, RF, DTs, and DA classification methods can be used together to provide information about the relationship and strengths of the lignite data. A successful data mining work generally consists of three stages. These stages are called preprocessing, feature reduction, and classification. First stage: The pre-processing phase is important for the success of the data mining. At this stage, the data are made available for later use. The success of the pre-processing stage is directly affected by the success of the result. The k-means method is used for the preprocessing stage. It is clustered as calorific value verification data by k-means method. And lignite coals are divided into two groups high quality and low quality according to calorific values. Second stage: The data to be used in order to obtain useful and correct results from the data should be reduced. A large part of the data in the hand is not available to be used at later stages, even if it has passed through the pre-processing phase. Therefore, it must be reduced to a usable stage. For the feature reduction stage, Wavelet Transform Families are used. In this method, new property values are obtained by the Wavelet Transform Families. Haar, daubechies, symlet, coiflet, and biorspline wavelet types are used from Wavelet Transform Families. The third stage: The classification phase is the last phase of data mining. RF, DTs, and DAmethods have been used for classification stage. When only one of these methods is used, high performance is not obtained to measure lignite quality.
The main purpose of this study is to focus on lignite quality parameters and making reliable classification by using machine learning algorithms. By this way, instead of the empirical and traditional methods, a hybrid methodology has been proposed. The lignite quality observations derived from two datasets (Turkey Lignite Inventory (TLI) (MTA Citation2010; Tutmez, Hozatli, and Cengiz Citation2013), Sivas-Kangal Basin (SKKB) (Tercan and Karayiğit Citation2001; Tutmez, Hozatli, and Cengiz Citation2013; Tutmez and Kaymak Citation2013)) have been considered and a series applications have been performed. This study covers some contributions. By combining k-means, wavelet families, RF, DT, and DA methods, a hybrid methodology has been proposed to classify the lignite quality. As a result, a robust, transparent, and flexible model structure have been provided. Also, a new synergy has been created and the reliability of the classification has been increased by this approach.
In the next section, the methodology of the paper will be stated. After that, the implementation and a brief discussion section will be given. Section 4 will summarize and conclude the paper.
Methodology
Problem Statement
Lignite is one of the most important energy sources. An important problem in the economic and technical evaluation of lignite reserves is to measure lignite quality. The quality of lignite depends on parameters such as moisture, ash, sulfur, and calorific. For this reason, the modeling of these variables is important from many ways. Although there are large lignite reserves in some regions, low calorific lignite can be obtained (Chelgani, Mesroghli and Hower Citation2010). Carbon monoxide gas arises with the use of low calorific lignite. Carbon monoxide gas affects human health negatively and it causes air pollution. Also, making a lignite quality classification has critical importance for energy plants, other areas, investment decisions, and energy production. Because if investors and business owners can determine the quality of the lignite reserves, the financial gain they have achieved will increase in that proportion. Although there are many methods to make an effective lignite classification, use of machine learning algorithm for this purpose is very limited. However, because of flexibility and accuracy, these algorithms are preferred in the classification works on uncertain (heterogeneous) systems like geological process.
In this article, the proposed system for determining the quality class of lignite as high and low quality is shown in . In , lignite quality classification has been performed in five steps. In the first step, calorific values have been used as verification data using the k-means method. In this step, the coal lignite data are seperated into two groups, low and high quality. Low- and high-quality lignite coal is clustered by k-means. However, according to the low and high-quality grades, moisture, ash, and sulfur data are regulated. Some of the regulated moisture, ash, and sulfur data have been used for training purposes and others have been used for testing purposes. And after this step, it is performed to quality determination using only moisture, ash, and sulfur data. In the second step, wavelet families have been applied to the properties of regulated moisture, ash, and sülfür. The applied wavelet families are haar, daubechies, symlet, biorspline, and reversebiorspline. In this step, approximate coefficients produced by wavelet families have been obtained. In the third step, the features obtained in the second step have been given to RF, DA, and DT classifiers. In the fourth step, quality classification performances have been compared for lignite coal data obtained from SKKB and TLI. While the highest quality classification performance of lignite coals in the SKKB area has been found as 93.75%, the highest quality classification performance for lignite coals obtained from TLI has been found as 100%. In the fifth step, success rate of this study has been compared with other studies in the literature. The success rate of classification obtained by this study is higher than other studies in the literature.
Figure 1. Proposed approach steps for quality determination of lignite coal data.
Machine Learning Approach
K-means Method
The k-means method that be a multivariate statistical technique is used to classify homogeneous subgroups according to their similarity. One of the best-known clustering methods is the k-means method. The k-means method that has a nonhierarchical structure has the feature of separating and classifying the n parts of variables of a T data set and B parts of P feature vectors (Korkmaz and Esmeray Citation2018; Muda et al. Citation2011). In this method, pre-determined cluster nodes start with the identification of P set. And each variable factor is appointed to the nearest cluster center with the help of the similar criteria (Korkmaz and Esmeray Citation2018; Ozcift and Gulten Citation2008). After appointing each variable to a set of input data set, the cluster center is recalculated for each cluster, and the variables are appointed to different new clusters depending on the location of these new cluster centers. This process is recurrence until there is no exchange in cluster memberships. In a studied problem, P set is described as a feature vector and a T data set with n variables . In this data set, k. feature vector is written as,
,
(Fırat et al. Citation2012; Korkmaz and Esmeray Citation2018; Muda et al. Citation2011). In EquationEquation (1)
(1)
(1) , it is the main target to divide the smallest data set of the objective function into subgroups when the subgroup is divided. The objective function in this equation is to obtain the smallest set of functions is gathered in the same cluster. The euclidean distance given in EquationEquation (2)
(2)
(2) is usually used to calculate the distance measurement (Fırat et al. Citation2012; Korkmaz and Esmeray Citation2018; Leśniak and Isakow Citation2009).
The given in EquationEquation (1)
(1)
(1) is described as below.
Discrete Wavelet Transform Families
Discrete wavelet transform is a widely used method for feature extraction in many different fields such as signal processing, biomedical signal processing, and data mining (Korkmaz and Esmeray Citation2018; Korkmaz and Poyraz Citation2014). The discrete wavelet transform (DWT) is the sum of the signal that is multiplied by its offset values and scaled over the time domain of the wavelet. The DWT function is used at the wanted level for the signal and image (Korkmaz and Esmeray Citation2018; Korkmaz and Poyraz Citation2014). The DWT method allows to obtain the distinguishing characteristics of the signal by analyzing the low-frequency component at a lower band gap and the higher frequency component in a narrow range. The mathematical expression of the subbands obtained using DWT is indicated in Equation (4) (Karhan and Ergen Citation2016; Korkmaz and Esmeray Citation2018).
where in the decomposition process of these subbands, CA expresses the approximate coefficients of the operation, while YA, AY, YY expresses the detail coefficients of the operation (Karhan and Ergen Citation2016; Korkmaz and Esmeray Citation2018; Sengur, Turkoglu, and Ince Citation2007, Citation2008). Detail coefficients are horizontal, vertical, and diagonal. DWT can be resumed by decomposing the approach data again in a similar way. The approximate coefficients have been used in this article.
There is no algorithm in determining the family of wavelets that should be selected in the studies. In the time domain, the main wavelet is more visually similar to the signal to be worked on, resulting in a greater efficiency from the wavelet transform method of choice. But it seems almost impossible to make a choice in this way. For this reason, all wavelet family types should be tried. The general purpose wavelet is Daubechies. The differential operator haar wavelet is the same as daubechies1, symlet1, coiflet1, and biorspline1.1 wavelet families (Korkmaz and Esmeray Citation2018; Sengur, Turkoglu, and Ince Citation2008).
Decision Tree (DT)
DT has begun from a root and operation at decree loops and finally finished in labeled let a classifier and inspected learning certainment. In the best case, for n number nodes decide reached the result (AKI Citation0000; Özkan Citation2008). The function
in EquationEquation (5)
(5)
(5) has been expressed as entropy in the form of the amount of all the probabilities in a R unit.
The R unit in the equation denotes the class property and entropy is used for the R class property. As shown in EquationEquation (6)(6)
(6) , weighted averages of each classified feature are calculated.
Here, entropy is calculated for each W characteristic of R class. The entropy value calculated for the i value of R is the number of values , which is the total number of R values. The information gain calculated for each property is shown in EquationEquation (7)
(7)
(7) .
In this way, the feature that capacity the highest gain is evaluated as the root node of the tree. The remaining values are recalculated to form the other nodes and branches of the DT, and each sub-node is added as the highest earning property. While the ID3 algorithm only implements to category-based classification, the C4.5 algorithm, which is the developed version of the same algorithm, allows the use of properties with digital values in decision nodes. The threshold value is used in decision mechanisms in which numerical features are used. DTs are obtained by calculating gains separately for divided values (Özkan Citation2008).
Random Forest (RF)
RF is a collection of tree-type classifiers. The Gini index is used in RF classifier. The division position according to the smallest Gini index is determined by Gini measurements. To generate a tree with the RF classifier, two external parameters must be entered. These parameters are m and N parameters. m is the number of variables used in each node. N is the number of trees that will be developed to determine the best partition (Iakovidis et al. Citation2005; Korkmaz and Binol Citation2018). The start m value is entered randomly from the outside. Subsequent m’s are reduced or increased relative to the overall error rate. Classification accuracy is understood by generalized error data. P new training data are generated from D training data. Tree-type classifiers in the RF classifier are used in the type. where, x is the input data;
indicates the random vector. The
classifier is constructed using the new training data set. The x and y are not found in
. When a random pixel is selected for a given training D data set, this pixel belongs to class
. Therefore, the Gini index is expressed as below.
Here, D is the training data set, is the class to which a randomly selected pixel belongs,
indicates the possibility of belonging to the
class of the selected example.
Discriminant Analysis (DA)
The analysis used in the derivative of the Fisher Discriminant is extended to find a subspace which is observed to contain changeability belonging to all classes if there are more than one class. Let us assume that each class a has a mean of one μ and the same Σ covariance. Class variability is described as the example covariance of class averages.
where “μ” is the average of the class averages. The “z” r-oriented class distinction is expressed as follows.
The eigenvalue vector for is the eigenvalue corresponding to the difference between the classes. Since
rank has these nonzero eigenvalues, the features of the vectors contain a vector that describes the subspace. These vectors are used especially for vector reduction. The eigenvalues with the smallest value will be very sensitive to the good choice of the training data and may need a regulation. If classification is needed instead of size reduction, there are a number of alternative methods. For example, after classes have been separated, the standard Fisher Discriminant or DAmethod is used to classify each difference. Usually used in an example, a class is placed in a group and everything else is placed in another group and the DA is implemented (Karakitsos et al. Citation2004).
Results
Data Set
The experimental studies were performed by two data sets. The lignite quality parameters such as moisture content, ash, sulfur content, and calorific value are considered. Volatile matter and fixed carbon values have not been reported (MTA Citation2010). The first lignite coal data were derived from the TLI(MTA Citation2010; Tutmez, Hozatli, and Cengiz Citation2013). This set consisted of 96 values. The second data set derived from lignite coal data from Sivas-Kangal Kalburcayiri Basin (Tercan and Karayiğit Citation2001; Tutmez, Hozatli, and Cengiz Citation2013; Tutmez and Kaymak Citation2013) includes 67 observations.
The main characteristics and the descriptive statistics of the data sets are given in . As can be recorded in , there is a big difference between the average values of the data set. In addition, the standard deviation values indicate that the sets have different levels of variability. Therefore, identification and classification studies are performed based on heterogeneous field data. This issue corresponds some difficulties. However, there are no data conditioning and adjustment applied in this study.
Table 1. Descriptive statistics for data sets.
Implementation
For performing the first step, the calorific value and the k-means algorithm have been utilized. k-value used for the k-means method is taken as 2. Thus, the coal lignite data are seperated into two groups, low and high quality. And low- and high-quality lignite coal is clustered by k-means. The calorific values between 2,200 and 5,574 kcal/kg from TLI lignite coal data have been determined as high quality. Calorific values between 868 and 2,196 kcal/kg have been determined as low quality. It has been determined that the lignite coal validation data in the 96 borehole locations separated by 2-categories by k-means have high quality of 54 and low quality of 42. The calorific values between 1,336 and 2,060 kcal/kg from SKKB lignite coal data have been determined as high quality. Calorific values between 807 and 1,288 kcal/kg have been determined as low quality. It has been determined that the lignite coal validation data in the 67 borehole locations separated by 2-categories by k-means have high quality of 28 and low quality of 39.
For performing the second step, according to the low- and high-quality groups, moisture, ash, and sulfur data have been regulated. Some of the regulated moisture, ash, and sulfur data have been used for training purposes and others have been used for testing purposes. And after this step, it is performed to quality determination using only moisture, ash, and sulfur data. The remaining three attributes (regulated moisture content, ash, and sulfur content) have been applied the wavelet families (haar, daubechies, symlet, coiflet, and biorspline). New attributes produced by each wavelet family (haar, daubechies, symlet, coiflet, and biorspline) have been used for coal quality determination. That is, for each data group (SKKB and TLI); Total of 2 features have been obtained by using the haar family. Total of 2 × 14 features have been obtained by using the Daubechies (db1, db2, db3, db4, db5, db6, db7, db8, db9, db10, db11, db12, db13, and db14) family. Total of 2 × 8 features have been achieved for the Symlet (sym1, sym2, sym3, sym4, sym5, sym6, sym7, and sym8). Total of 2 × 5 attributes have been obtained for the coiflet (coif1, coif2, coif3, coif4, and coif5) family. Total of 2 × 14 attributes have been obtained for biorspline (bior1.1, bior1.3, bior1.5, bior2.2, bior2.4, bior2.6, bior2.8, bior3.1, bior3.3, bior3.5, bior3.7, bior3.9, bior4.4, and bior6.8) family. Total of 2 × 14 attributes have been obtained for reversebiorspline (rbio1.1, rbio1.3, rbio1.5, rbio2.2, rbio2.4, rbio2.6, rbio2.8, rbio3.1, rbio3.3, rbio3.5, rbio3.7, rbio3.9, rbio4.4, and rbio5.5) family. The numbers of attributes used in the first two steps for proposed method has been summarized in .
Table 2. Number of attributes in first two steps.
For performing the third step, m and N values obtained from RF classifier for TLI are 47 and 500. m and N values obtained from RF classifier for SKKB are 33 and 500. The attribute values obtained from the wavelet transform in are given to RF, DT, and DA classifiers. Then, the classification success results are compared to one another. The comparisons of these results are shown in , , and .
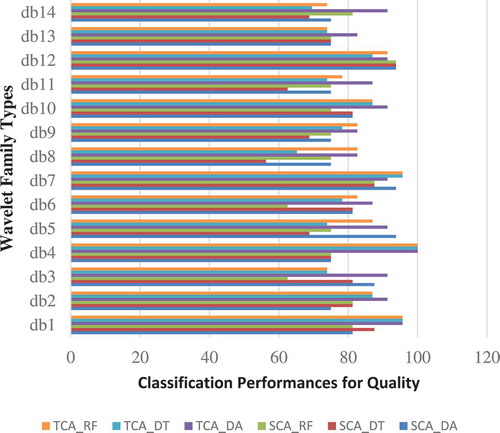
Table 3. Quality classification performances of the daubechies wavelet types for lignite coal from obtained from in the field Sivas-Kangal Kalburçayırı Basin (SKKB) and General Directorate the Turkey Lignite Inventory (TLİ).
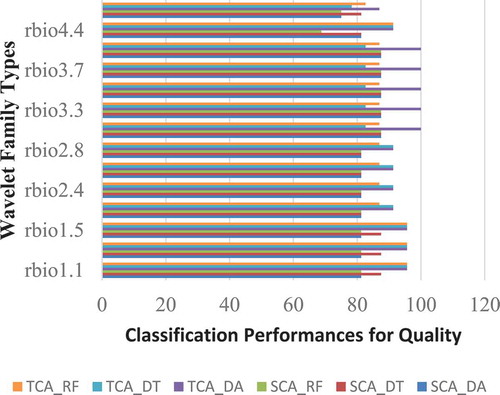
Table 4. Quality classification performances of the reversebior wavelet types for SKKB and TLI data.
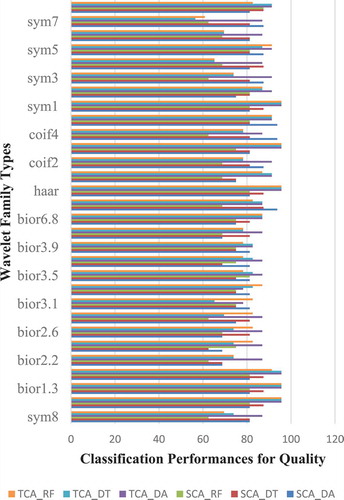
Table 5. Quality classification performances of the other wavelet types for lignite coal from obtained from in the field Sivas-Kangal Kalburçayırı Basin (SKKB) and general directorate the turkey lignite inventory (TLİ).
The SCA in is the wavelet coefficients obtained for the coal data in the Kalburçayı area of SKKB. Likewise, TCA in is the wavelet coefficients obtained for the coal data obtained from the General Directorate the Turkey Lignite Inventory. SCA_DA represents the quality classification performance obtained by the DA classifier for lignite coal data in the area of SKKB. SCA_DT represents the quality classification performance obtained by DT classifier for lignite coal data in the area of SKKB. SCA_RF represents the quality classification performance obtained by the RF classifier for lignite coal data in the area of SKKB. TCA_DA represents the quality classification performance obtained by the DA classifier for lignite coal data obtained from the General Directorate the Turkey Lignite Inventory (TLI). TCA_DT represents the quality classification performance obtained by the DT classifier for lignite coal data obtained from TLI. TCA_RF represents the quality classification performance obtained by the RF classifier for lignite coal data obtained from TLI. According to , the highest quality classification performance for the lignite coal data obtained from SKKB has been obtained with the db12 wavelet coefficient type. The quality classification performances obtained with db12 are 93.75%, 93.75%, and 93.75% for SCA_DA, SCA_DT, and SCA_RF, respectively. The highest quality classification performance for lignite coal data obtained from TLI according to and has been obtained with db4 wavelet coefficient type. The quality classification performances obtained with db4 are 100%, 100%, and 100% for TCA_DA, TCA_DT, and TCA_RF, respectively.
Figure 2. Comparison of the quality classification performances for daubechies.
The highest accuracy performances according to and have been obtained as 87.50% for SCA_DA, respectively, with rbio3.1, rbio3.3, rbio3.5, rbio3.3.7, and rbio3.9; It has been obtained as 87.50% for SCA_DT with rbio1.1, rbio1.3, rbio 1.5, rbio 3.1, rbio 3.3, rbio3.5, rbio 3.7, and rbio3.9; It has been obtained as 87.50% for SCA_RF with rbior 3.1, rbio3.3, rbio3.5, rbio3.7, and rbio3.9; It has been obtained as 100% for TCA_DA with rbio3.1, rbio3.3, rbio3.5, rbio3.7, and rbio3.9; It has been obtained as 95.65% for TCA_DT with rbio1.1, rbio1.3, and rbio1.5; It has been obtained as 95.65% for TCA_RF with rbio1.1, rbio1.3, and rbio1.5.
Figure 3. Comparison of the quality classification performances for reversebior.
The highest accuracy performances according to and have been obtained as 93.75% for SCA_DA, respectively, with dmey, coif 4, and coif 5; It has been obtained as 87.50% for SCA_DT with dmey, haar, bior1.1, bior1.3, bior 1.5, bior 5.5, sym1, sym4, and bior 5.5; It has been obtained as 87.50% for SCA_RF with bior 5.5; It has been obtained as 95.65% for TCA_DA with bior1.1, bior1.3, bior1.5, haar, coif3, and sym1; It has been obtained as 95.65% for TCA_DT with bior 1.1, bior 1.3, bior 1.5, haar, coif 3, and sym1; It has been obtained as 95.65% for TCA_RF with bior1.1, bior1.3, haar, coif3, and sym1.
Figure 4. Comparison of the quality classification performances for other wavelet family types.
Discussion
There are very different approaches in the literature for classification of coal moisture, ash, sulfur, and caloric values. In an article, RF, fuzzy inference systems, genetic algorithms, etc., and their hybrid forms have been used to develop models foreseen in recent years for estimating the required coal parameters. Determination of the GCV of coal is very important for the characterization of coal and organic materials; difficult, expensive, time consuming, and destructive. In one study, models such as MLP, RBF (complete), RBF (k-means), and RBF (SOM), which are different learning algorithms of RF, have been used to predict GCV. As a result of this article, all models have demonstrated high performance to predict GCV. Although the ANN’s four different algorithms have almost the same predictive ability, the accuracy of MLP is reported to be relatively higher than other models. (Yilmaz, Erik, and Kaynar Citation2010). In one study, moisture in lignite coal samples is detected by using near-infrared (NIR) spectra. The study model was developed by applying partial least squares regression (PLS) and DWT. Firstly, the NIR spectrum was pre-processed with DWT for assembly and compression. Then, the compressed data were used to generate a regression model with PLS to determine moisture in coal samples. Compression performance at different resolution scales has been investigated. Using the compressed data, it is stated that more accurate results are obtained from the PLS raw spectra. Also, the number of main components in the PLS model has been investigated. The results show that DWT-PLS can achieve satisfactory detection performance for moisture analysis of bituminous coal and lignite coal (Yang et al. Citation2014). In another study, an SVR model based on the online coal calorific value estimation method was performed. The coal flame radiation features were removed by wavelet transform and PCS process. The relation model between radiation characteristic variables and coal calorific value was established by SVR model. The correct SVR construction parameters are selected by grid calculation. It has been reported that the results of the experiment show good agreement between the SVR model estimate and the laboratory calorific value of the laboratory results (Cheng et al., Citation2012).
In , the results obtained with this article are compared with the other articles in the literature. According to , the differences and advantages of these articles according to other studies in the literature are as follows.
Table 6. Comparison of the proposed approach in this article with other studies in the literature.
In general, the size of the samples used in previous studies in the literature is approximately near to the number of samples used in this article. The number of samples used in reference (Sahu, Mahapatra, and Panigrahi Citation2012), (Sahu et al. Citation2011), (Petropoulos, Partsinevelos, and Mitraka Citation2013), (Feng et al. Citation2015) is even lower than the number of samples used in this article. Only a higher data set from this article is used in the reference (Matin and Chehreh Chelgani Citation2016) and reference (Khorami et al. Citation2011). As shown in , so far, the wavelet family, which is a feature reduction method, has been used for the first time to determine the class of coal quality. In addition, DA and DT methods were used for the first time to classify lignite coal data. Some of the highest classification success results according to were obtained in reference (Khorami et al. Citation2011) and this article. In addition, classification performances have been obtained using three classifiers in reference (Feng et al. Citation2015) and this article. The number of classifiers used in other references is one or two. Analyzing coal quality with more than one classifier is always more advantageous to get the right information. The success rate of classification obtained by this study is higher than other studies in the literature. And because this article is a multimodality work, success rate is more secure than other studies in the literature. The distinguishing of high- and low-quality lignite coal with high performance will benefit the investor while also benefiting lignite coal users in terms of health. The highlights of the proposed method in this article are as follows.
1) Performance of the Quality Classification of the lignite coal data the Turkey Lignite Inventory General Directorate is higher than Lignite Coal data on the Kalburçayı area of the SKKB.
2) rbio3.1, rbio3.3, rbio3.5, rbio3.7, db4, and rbio3.9 wavelet families according to calorie values have shown very high performance for quality detection of the lignite coal data the Turkey Lignite Inventory General Directorate.
3) DA, RF, and DT Classifiers according to Lignite coal calorific values are effective to classify lignite coals in different regions using data such as moisture, ash, and sulfur. db5, db7, db12, dmey, coif4, and coif5 wavelet families according to calorie values are effect for quality detection of the Lignite Coal data on the Kalburçayı area of the SKKB.
4) In general, for the classification of high-quality coal, the DAclassifier is more effective than the DT and RF classifiers.
5) While the highest quality classification performance of lignite coals in the SKKB area is found as 93.75%, the highest quality classification performance for lignite coals obtained from TLI is found as 100%.
Conclusion
This study dealt with the lignite quality classification of machine learning algorithms. One of the most important practical problems in lignite mining is to make a lignite quality classification due to heterogeneity. The quality of lignite depends on the parameters such as moisture, ash, sulfur, and calorific value and an acceptable, reliable classification mechanism is required. To make a classification, the lignite data sets derived from SKKB and TLI have been considered.
Calorific values have been used as verification data using the k-means method. Thus, the lignite data were seperated into two groups: low and high quality. Then, wavelet families have been applied to obtain the approximate coefficients from the properties of moisture, ash, and sulfur. The applied wavelet families were haar, daubechies, symlets, and reversebiorspline. After that, the approximate coefficients have been given as inputs to RF, DA, and DT classifiers. Finally, the performances of quality classification have been compared using the SKKB and the TLI data sets. The quality classification performances have been found as 93.75% and about 100% for SKKB and TLI, respectively. The performances also compared relatively with the conventional methods in the literature.
Conflicts Of Interest
Sevcan Aytaç Korkmaz declares that she has no conflict of interest.
Acknowledgments
The author would like to thank to Prof. Dr. Bülent TÜTMEZ in the Mining Engineering department of the İnönü University.
References
- Aki, M. O., 0000. Sürücü uykululuğunun gerçek Zamanlı Görüntü İşleme ve Makine Öğrenmesi Teknikleri ile Tespitine Yönelik Bir Sistem Tasarımı ve Uygulaması, Trakya Üniversitesi, Fen Bilimleri Enstitüsü.
- Cheng, Y., L. Xu, X. Li, and Z. Guo (2012, July). Online coal calorific value prediction from multiband coal/air combustion radiation characteristics. In Instrumentation and Control Technology (ISICT), 2012 8th IEEE International Symposium on,309–13, London, UK: IEEE.
- Chelgani S C, Mesroghli S H, and J. C. Hower. 2010. Simultaneous prediction of coal rank parameters based on ultimate analysis using regression and artificial neural network. International Journal of Coal Geology 83 (1):31–34. doi:10.1016/j.coal.2010.03.004.
- Feng, Q., Zhang, J., Zhang, X., & Wen, S. 2015. Proximate analysis based prediction of gross calorific value of coals: A comparison of support vector machine, alternating conditional expectation and artificial neural network. Fuel Processing Technology 129:120–29. doi:10.1016/j.fuproc.2014.09.001.
- Fırat, M., F. Dikbaş, A. C. Koç, and M. Ve Güngör. 2012. K-Ortalamalar Yöntemi ile Yıllık Yağışların Sınıflandırılması ve Homojen Bölgelerin Belirlenmesi. IMO Teknik Dergi 383:6037–50.
- Galetakis M J, K. Theodoridis, and O. Kouridou. 2002. Lignite quality estimation using ANN and adaptive neuro-fuzzy inference systems (ANFIS). In APCOM 2002: 30 th International Symposium on the Application of Computers and Operations Research in the Mineral Industry (pp. 425-431).
- Iakovidis, D. K., Maroulis, D. E., Karkanis, S. A., & Brokos, A. “A comparative study of texture features for the discrimination of gastric polyps in endoscopic video.” Computer-based medical systems, 2005. Proceedings. 18th IEEE Symposium on. Dublin, Ireland: IEEE, 2005.
- IEA. 2000. International energy annual. France. International Journal of Coal Science & Engineering (China) Energy AgencyTutmez, B., Hozatli, B., & Cengiz, A. K. (2013). An overview of Turkish lignite qualities by logistic analysis. Journal of Coal Science and Engineering (China), 19(2), 113-118.
- Karakitsos, P., T. M. Megalopoulou, A. Pouliakis, M. Tzivras, A. Archimandritis, and A. Kyroudes. 2004. Application of discriminant analysis and quantitative cytologic examination to gastric lesions. Analytical and Quantitative Cytology and Histology/the International Academy of Cytology [And] American Society of Cytology 26 (6):314–22.
- Karhan, Z., and B. Ergen (2016). Content based medical image classification using discrete wavelet and cosine transforms. 23nd Signal Processing and Communications Applications Conference (SIU), Malatya, Turkey, (pp:1445–48).
- Korkmaz, S. A., and H. Binol. 2018. Classification of molecular structure images by using ANN, RF, LBP, HOG, and size reduction methods for early stomach cancer detection. Journal of Molecular Structure, 1156, 255-263.
- Korkmaz, S. A., and F. Esmeray (2018). Quality lignite coal detection with discrete wavelet transform, discrete fourier transform, and ANN based on k-means clustering method. 2018 6th International Symposium on Digital Forensic and Security (ISDFS,1-6), Antalya, Turkey: IEEE.
- Korkmaz, S. A., and M. Poyraz. 2014. A new method based for diagnosis of breast cancer cells from microscopic images: DWEE—JHT. Journal of Medical Systems 38 (9):92. doi:10.1007/s10916-014-0092-3.
- Leśniak, A., and Z. Isakow. 2009. Space–time clustering of seismic events and hazard assessment in the Zabrze-Bielszowice coal mine, Poland. Poland. International Journal of Rock Mechanics and Mining Sciences 46 (5):918–28. doi:10.1016/j.ijrmms.2008.12.003.
- Moon C J, Whateley M K G, and Evans A M. 2006. Introduction to mineral exploration. India: Blackwell Publishing.
- Matin, S. S., and S. Chehreh Chelgani. 2016. Estimation of coal gross calorific value based on various analyses by random forest method. Fuel 177:274–78. doi:10.1016/j.fuel.2016.03.031.
- MTA. 2010. Lignite inventory of Turkey, general directorate of mineral research and exploration (MTA) in Turkey. Ankara (in Turkish).
- Muda, Z., W. Yassin, M. N. Sulaiman, and N. I. Udzir (2011, July). Intrusion detection based on K-Means clustering and Naïve Bayes classification. In Information Technology in Asia (CITA 11), 2011 7th International Conference on (pp. 1–6). Kuching, Sarawak, Malaysia: IEEE.
- Ozcift, A., and A. Gulten. 2008. Assessing effects of pre-processing mass spectrometry data on classification performance. European Journal of Mass Spectrometry 14 (5):267–73. doi:10.1255/ejms.938.
- Özkan, Y. 2008. Veri madenciliği yöntemleri. Turkey/Istanbul: Papatya Yayıncılık Eğitim.
- Pandit, Y. P., Y. P. Badhe, B. K. Sharma, S. S. Tambe, and B. D. Kulkarni. 2011. Classification of Indian power coals using K-means clustering and self organizing map neural network. Fuel 90 (1):339–47. doi:10.1016/j.fuel.2010.09.012.
- Petropoulos, G. P., P. Partsinevelos, and Z. Mitraka. 2013. Change detection of surface mining activity and reclamation based on a machine learning approach of multi-temporal Landsat TM imagery. Geocarto International 28 (4):323–42. doi:10.1080/10106049.2012.706648.
- Sahu, H. B., S. S. Mahapatra, and D. C. Panigrahi. 2012. Fuzzy c-means clustering approach for classification of Indian coal seams with respect to their spontaneous combustion susceptibility. Fuel Processing Technology 104:115–20. doi:10.1016/j.fuproc.2012.03.017.
- Sahu, H. B., S. S. Mahapatra, K. Sirikasemsuk, and D. C. Panigrahi. 2011. A discrete particle swarm optimization approach for classification of Indian coal seams with respect to their spontaneous combustion susceptibility. Fuel Processing Technology 92 (3):479–85. doi:10.1016/j.fuproc.2010.10.015.
- Senguler, I., (2010). Lignite explorations in Turkey: New projects and new reserves. 17th Annual International Pittsburgh Coal Conference, İstanbul, Turkey.
- Sengur, A., I. Turkoglu, and M. C. Ince. 2007. Wavelet packet neural networks for texture classification. Expert Systems with Applications 32 (2):527–33. doi:10.1016/j.eswa.2005.12.013.
- Sengur, A., I. Turkoglu, and M. C. Ince. 2008. Wavelet oscillator neural networks for texture segmentation. Neural Network World 18 (4):275.
- Khorami, M. T., Chelgani, S. C., Hower, J. C., & Jorjani, E. 2011. Studies of relationships between free swelling index (FSI) and coal quality by regression and adaptive neuro fuzzy inference system. International Journal of Coal Geology. 85 (1):65–71. doi:10.1016/j.coal.2010.09.011.
- Tercan, A. E., and A. I. Karayiğit. 2001. Estimation of lignite reserve in the Kalburcayiri field, Kangal basin, Sivas, Turkey. International Journal of Coal Geology 47 (2):91–100. doi:10.1016/S0166-5162(01)00033-7.
- Tutmez, B., B. Hozatli, and A. K. Cengiz. 2013. An overview of Turkish lignite qualities by logistic analysis. Journal of Coal Science& Engineering China 19 (2):113–18. doi:10.1007/s12404-013-0201-9.
- Tutmez, B., and U. Kaymak. 2013. Hybrid least-squares regression modelling using confidence bounds. In Towards advanced data analysis by combining soft computing and statistics (pp. 53-63). Springer, Berlin, Heidelberg.
- Yang, X. L., F. Wang, W. C. Wang, Y. X. Chen, and J. S. Chen. 2014. DWT-PLS regression on near-infrared spectra for moisture determination of coal. In Xianzhang Feng, Qi Luo and Tianbiao Zhang (Eds.), Advanced materials research, vol. 827, 209–12. Switzerland: Trans Tech Publications.
- Yilmaz, I., N. Y. Erik, and O. Kaynar. 2010. Different types of learning algorithms of artificial neural network (ANN) models for prediction of gross calorific value (GCV) of coals. Scientific Research and Essays 5 (16):2242–49.