
 ?Mathematical formulae have been encoded as MathML and are displayed in this HTML version using MathJax in order to improve their display. Uncheck the box to turn MathJax off. This feature requires Javascript. Click on a formula to zoom.
ABSTRACT
The reality about human behavior is that how other people think and evaluate have strong influences on our beliefs and thinking. Consumers get rich information from online reviews that may reduce their uncertainty regarding purchases. Besides, product-developing companies analyze user demands from online reviews to design market-driven product. In this study, a comparison among five major market share holder smart phone brands - Samsung, Apple, Huawei, Xiaomi, and Oppo is performed in different price categories - high, mid, and low range, based on sentiment polarity score. Online public reviews are extracted and sentiment scores of reviews are calculated to construct public sentiment polarity toward the famous brands. By examining both quantitative and qualitative methodologies, we identified the most important smart phone features or attributes that have great significance on consumer satisfaction. By experimenting and comparing five efficient machine-learning algorithms in predicting sentiment polarity and three feature selection algorithms in reducing attributes, an optimal set of 21 smart phone attributes was found those play major roles in determining customer satisfaction.
Introduction
Presently online customer reviews platform has become an important source of information for both consumers and manufacturers that has great influences on consumer choices and product sales. It allows people to express their thinking and feeling about the products. The fact about human psychology is that our beliefs are highly motivated and influenced by the thinking and evaluation of other people. While buying a product people often want to know how other people think and evaluate the product. In recent years consumers seek product reviews to determine the best product that fit their preferences (Jin, Ping, and Rui Citation2016; Sampaio, Ladeira, and Santini Citation2017) that may reduce their uncertainty regarding purchases. On the other hand, customer reviews are important to manufactures who want to keep track of customer satisfaction on their products. Companies will be aware of the prevailing customer perception (Cha and Borchgrevink Citation2019; Marakanon and Panjakajornsak Citation2017) to make more effective and accurate plans for product development.
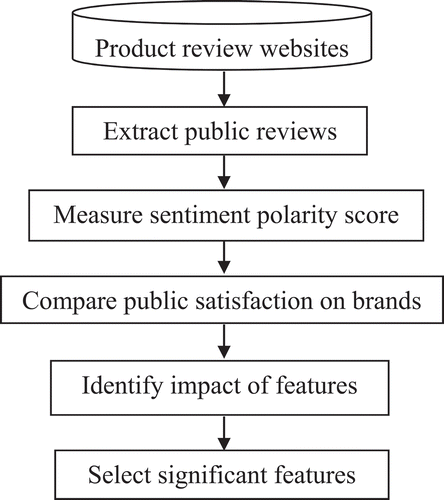
Figure 1. Process of sentiment analysis and feature selection.
With the thousands and millions of user-generated reviews available on the Internet, it is difficult for both consumers and merchants to read the reviews one by one and to extract meaningful information like public sentiment on the products. Natural Language Processing (NLP) and text mining techniques (Qi et al. Citation2016; Lakshmanaprabu et al. Citation2018) are used to extract knowledge from rapidly increasing amount of user generated reviews. Sentiment analysis (Geetha, Singha, and Sinha Citation2017; Hasan et al. Citation2018; Kolog; Montero and Toivonen Citation2018) is the task of automatically judging the polarity (positive, negative, or neutral) of the text. Sentiment analysis includes feature extraction, sentiment prediction, and sentiment classification.
Number of smart phone users is increasing rapidly day by day. Statista, a German online portal for statistics, forecasts the number of smart phone users is to grow from 2.1 billion in 2016 to around 2.5 billion in 2019. People in advanced economies are more likely to have smart phones. As a consequence, the number of consumer reviews that smart phones receive grows rapidly. We chose five top market share holder smart phone brands. According to preliminary data from the International Data Corporation (IDC) of third quarter of 2018 (3Q18), the market share of top five smart phone brands are: Samsung – 20.3%, Huawei – 14.6%, Apple – 13.2%, Xiaomi – 9.7% and Oppo – 8.4%. We have collected public comments from five renowned product review websites around the world. This study mainly focuses on how product attributes impact customer satisfaction. In this article, a research is designed to show a comparative public sentiment report on the famous smart phone brands. Additionally, we measured and compared the performance of machine-learning techniques – Support Vector Machines, Multilayer Perceptron Neural Networks, Naïve Bayes, Decision Tree algorithms (J48 and Random Forest) in predicting sentiment polarity. Further, we improved the accuracy using feature selection algorithms - Univariate Feature Selection (UFS), Principle Component Analysis (PCA) and Recursive Feature Elimination (RFE). Our attempt is to find the significance of attributes on customer satisfaction. We identified how product features or attributes affect consumer satisfaction.
Related Work
Customer Satisfaction refers to fulfillment of customers’ need and desire. To read customer perception and to acquire customer satisfaction are big challenges for merchants today. Lots of works have been done on determining customer perception and satisfaction. Sampaio, Ladeira, and Santini (Citation2017) analyzed mobile banking industry and showed the relationship between the benefits given by mobile banking and the consequences of customer satisfaction. They identified the influence of the benefits given by mobile banking industries on customer satisfaction and tools affecting the relationship between them. Marakanon and Panjakajornsak (Citation2017) employed a study using the questionnaire survey given by consumers on electronics products. They collected data from 420 consumers who use environmentally friendly electronic products like mobile, computers laptops and phones. They analyzed data using structural equation modeling and confirmatory factor analysis and found that customer trust and perceived risk have a direct effect on customer loyalty. Cha and Borchgrevink (Citation2019) analyzed customers’ sentiment in restaurant environment. They collected samples of 334 restaurant diners and measured the impact of perceived value and food safety on customer satisfaction. They also mentioned how the impact of these two attributes’ differs based on gender and restaurant type.
The impact of attributes on customer satisfaction is a prime concern for companies to make more effective plans for developing products. It is very much important to know which properties of a product have more impact on customer satisfaction. van Lierop, Badami, and El-Geneidy (Citation2017) identified the major causes of satisfaction in public transport. They found the factors like on-board cleanliness and comfort, behavior from operators, safety, punctuality and frequency of service have major contributions on customer satisfaction. Wang, Lu and Tan (Citation2018) estimated the impact of washing machines’ properties on customer satisfaction using a logistic regression model. They mentioned that properties like drainage mode, capacity, frequency, loading type, color, display, conversion have influences on customer satisfaction. Farooq et al. (Citation2018) examined Malaysia Airlines service quality and its impact on customer satisfaction. They implemented a useful sampling method to collect data from 460 customers. They found terminal tangibles, airline tangibles, personnel services, empathy and image have positive significances on customer satisfaction.
Machine-learning algorithms are now popular platform in sentiment analysis. Researchers are using machine-learning techniques in classifying online reviews of products as positive or negative to identify whether the product is recommended or not. Neethu and Rajasree (Citation2013) applied machine-learning techniques to analyze the public comments on laptops and mobiles. They used NB, SVM, ME, and Ensemble classifier to classify public opinion as positive or negative. They suggested a new feature vector. Hasan et al. (Citation2018) compared machine-learning techniques – Naïve Bayes and Support Vector Machines in sentiment analysis of sentiment of political views. Rathor, Agarwal, and Dimri (Citation2018) focused on comparing the efficiency of supervised learning methods (NB, SVM and ME) to classify Amazon reviews using a web model. Kolog, Montero, and Toivonen (Citation2018) conducted a study on life stories of text-based students by analyzing sentiment and their social influence using machine-learning techniques. They used MNB, SVM, and J48 decision tree classifiers and showed that SVM performs well in analyzing sentiment but MNB performs well in analyzing their social influences.
Feature selection in machine-learning approaches is the process that focuses on those features, which contribute most in prediction of class variable. Feature selection techniques are used to reduce the dimensionality. Thus, they reduce the complexity and help to improve the accuracy in prediction of machine-learning algorithms. Researchers work to find out efficient feature selection techniques in prediction of machine-learning approaches. Khalid, Khalil, and Nasreen (Citation2014) used feature selection techniques – mRmR, SVM-REF, PCA to analyze how these techniques can be used to improve the performance of machine-learning approaches. Eklund et al. (Citation2014) investigated the performance of different feature selection methods in silico experiments conducted using real QSAR datasets. They also extended their work by investigating the four methods together with eight machine-learning algorithms. Manek et al. (Citation2016) proposed a classifier based on Gini Index feature selection method using SVM to classify reviews on movies. They showed their proposed classifier performs well in terms of error rate and accuracy. Lakshmanaprabu et al. (Citation2018) demonstrates the strategy maintained by the most effective web-based shopping sites. They used a fuzzy c-means grouping strategy for grouping features and applied Dragonfly Algorithm to recognize the best features.
In the past, researchers focused on identifying customer sentiments from online opinions and reviews. They used different tools and techniques to find sentiment polarity. In business and management sectors, researchers studied about customer perceptions and satisfactions and determined the impact of product attributes on customer satisfaction. But very few researches were conducted on applying artificial intelligence techniques to determine the impact of significant attributes on customer satisfaction. We combined the process of identifying consumer sentiment polarity and determining significant product features that impact consumer satisfaction exploring the field of artificial intelligence.
Materials and Methods
Data Description
Data used in this study are retrieved from five popular websites. (1) www.amazon.in is now largest e-commerce website around the world. It has a rich mobile section with a huge number of consumer comments. (2) www.gsmarena.com is a Bulgarian website, which is one of the largest up-to-date mobile information provider websites. Users get latest and real-time mobile phone information from the website. (3) www.gadgets.ndtv.com is now India’s popular e-commerce site that has a good collection of public reviews on products including smart phones. (4) www.bgr.in is a popular website for mobile phone lovers that offer a huge collection of phone information. (5) www.androidpit.com, an Italian website, is the world’s largest android community. It is one of the world’s most popular sources of reviews, news, and advice about android smart phones.
We have chosen five world’s top brands in smart phone industry (). We have categorized the smart phones of each brand into three sections based on price – high range, mid range, and low range.
We have developed a python program that takes a web link as input, extracts the public comments and saves them in a text file. Our program generated 45 text files for 45 smart phone models. We chose by extracting public review from the above-mentioned websites. We collected 1000 reviews for each 45 smart phone models.
Methodology
Our research is comprised of the following steps ().
On the collected reviews, we applied sentiment analysis approach to find the public sentiment of a specific product. Sentiment Analysis is the process of identifying and classifying opinions expressed in text form using a series of computational steps of text mining. In our study, Python Natural Language Toolkit (NLTK) platform is used for mining the collected comment. NLTK is a platform used for working with human language data for applying in the field of statistical natural language processing. It has robust text processing libraries for tokenization, parsing, classification, stemming, tagging, and semantic reasoning. We have used Vader algorithm for measuring polarity of public comment. Vader is a lexicon and rule-based sentiment analysis tool. Vader lexicon, developed by C.J Hutto, has around 7075 English words, some slang words and some emoticons with polarity score.
We have updated vader lexicon by adding some recently used slang words that has influences in measuring sentiment polarity of comments on smart phones. shows some of them.
Vader lexicon format: [word] [mean of given score] [standard deviation of given score] [given scores by several individuals]
A set of scores in the range of −5 (most negative) to +5 (most positive) are collected from a several individuals. Mean score is the mean of the collected scores and standard deviation is standard deviation result of the collected scores.
Our sentiment analysis is based on the important functions – Tokenization, Lemmatization, Stop words identification, Named entity recognition, Identification of emoticon and Negative word identification (Hasan et al. Citation2018; Manek et al. Citation2016; Neethu, Rajasree Citation2013). Tokenization is the process of breaking a complex sentence into a sequence of words to produce a structural description on an input sentence. It is the first and important function in sentiment analysis process. Tokenization is performed into the form of Uni-grams, Bi-grams, Tri-grams and N-grams. Bi-grams like “Extremely good”, “Absolutely fine”, “Really bad” increase the intensity of positivity and negativity polarity respectively. Therefore, Tri-grams like “Very much decent”, “So much interesting” have impact on polarity scores. Lemmatization normalizes words into its base form or root form. For example, Affectation”, “Affects”, “Affection”, “Affected”, “Affections”, “Affecting” all are derived from root form “Affect”. All the derived words have the same sentiment polarity that the root word “Affect” has.
Stop words are words that have very little significance. They are also called useless words. Stop words are defined according the purpose. For example while identifying sentiment polarity for the sentence “It is really amazing” the stop words may be “It” and “is”, because those word have very little significance in measuring sentiment. Parts of speech identification is an important step in sentiment analysis. For example, if we consider the sentences “I enjoyed a lot”, “It was really enjoying”, “It was a trip full of enjoyment”, here “enjoyed (verb)”, “enjoying (adjective)”, “enjoyment (noun)” all are giving positive feedback. Named Entity Recognition (NER) classifies unstructured text into named entity like person names, organizations, time, quantities, and locations. The sentence “Samsung S10 is fantastic” refers a positive sentiment about Samsung S10 where Samsung S10 is a named entity.
Emoticons must be identified as they give positive and negative expression.
Some positive emoticons::-): Smiley or happy face,:-)): Very happy, ^_^: Joyful, (*^0^*): Excited, O:-): Innocent (*_*): Amazed,:-*: Kiss
Some negative: emoticons: (* ̄m ̄): Dissatisfied, (゚ Д゚): Shocked, (‘_’): Sad,:-.: Annoyed, v.v: Disgust, (>_<): Troubled.
Some negative words sit before a word and make inverse meaning. So it is important to think about negative words. Examples of some negative words: never, no, nothing, nowhere, no one, none, not, haven’t, hasn’t, hadn’t, cant, couldn’t, shouldn’t, wont, wouldn’t, don’t, doesn’t, didn’t, isn’t, aren’t. “Good” gives positive sentiment but “Nothing good” gives negative.
Sentiment Classification
Sentiment classification is a process that classifies a sentence into positive or negative level. We examined Vader algorithm in the sentiment classification with some of our customization. Our target is to identify how positive or negative a sentiment is. For example, sentiment analyzer in our experiment classified the statement “The phone is not worth” into {‘neg’: 0.294, ‘neu’: 0.706, ‘pos’: 0.0, ‘compound’: −0.169}. That means the statement is 29% negative and 71% neutral. The compound score calculates the sum of all lexicon ratings which have been normalized between −1 (most extreme negative) and +1 (most extreme positive). We identified a statement as
Positive if compound score≥0.05
Neutral if compound score in between {-0.05, 0.05}
Negative if compound score ≤-0.05
We have added two more levels
Highly positive if compound score≥0.5
Highly negative if compound score≤-0.5
For a specific smart phone model, we took one comment at a time. We calculated sentiment score for each 1000 comments of the model. From the sentiment scores, we calculated mean_sentiment_score, which indicates the mean value of 1000 sentiment scores. Then, we calculated median_sentiment_score, which indicates the median value of 1000 sentiment scores. Then, we calculated stdv_mean, which refers to the standard deviation of sentiment scores from the calculated mean value. We also calculated stdv_ median, which refers to the standard deviation of sentiment scores from the calculated median value.
stdv_mean
stdv_median
Finally, we chose the final sentiment score of a specific smart phone model. We chose either mean_sentiment_score or median_sentiment_score depending on for which standard deviation would be minimum. That is if standard deviation from mean is less then we chose mean_sentiment_score as final sentiment score otherwise we chose median_sentiment_score as final sentiment score. We always targeted the value for which standard deviation is smaller to improve the precision.
Comparing Consumer Satisfaction
Sentiment score refers to the customer satisfaction on the considered smart phone model. We took weighted average of individual sentiment scores of smart phones for each price category of each brand. A comparison of customer satisfaction among five brands is constructed for the three categories (high range, mid range and low range) based on the sentiment score found.
Applying Machine-Learning Algorithms
Five popular machine-learning algorithms – Support Vector Machines (SVM), Multilayer Perceptron Neural Networks (MLP Neural Nets), Naïve Bayes (NB), Decision Tree algorithms (J48 and Random Forest) are examined in supervised learning manner to measure the accuracy of predicting sentiment polarity score.
Naïve Bayes Classifier
Naïve Bayes Classifier works based on Bayes’ Theorem. It uses all the features in the feature vector and makes a model to analyze them individually since they are independent to each other (Hasan et al. Citation2018; Rathor, Agarwal, and Dimri Citation2018). The conditional probability is defined as
Where A = {a1, a2, a3, …., an} is feature vector, {,
, … .,
} is a set of class labels.
Support Vector Machines
Support Vector Machines (SVM) finds a hyper-plane in an N-dimensional space that distinctly classifies the data points. N-dimension refers the number of features. It is a linear classifier that determines an object by finding a hyper-plane that segments the objects apart from each other (Hasan et al. Citation2018; Kolog, Montero, and Toivonen Citation2018).
Multilayer Perceptron Neural Networks
Neural Network performs several intermediary steps that combine the attributes into higher-level concepts. Neural Networks are modeled as human neural system. The networks are interconnected known as neurons just like weighted graphs. In Multilayer Perceptron Neural Network, a several hidden layers guide the classification process.
Decision Trees
Decision trees consist of nodes to test for the value of a certain attribute, edges to correspond to the outcome of a test and leaves or terminal nodes that predict the outcome. To classify, decision tree algorithms start from the root, perform the test, follow the edge corresponding to outcome, repeat the process unless leaf is reached and finally predict that outcome associated with the leaf. Random forest builds multiple decision trees and merges them together to get a more accurate and stable prediction. When new classification is needed each tree votes on how the new item should be classified. J48 decision tree algorithm uses statistical classifier and the concept of decision tree to classify a sample (Kolog, Montero, and Toivonen Citation2018).
We have chosen 31 attributes initially based on specifications of smart phones. The attributes are – Brand, Body dimension (length, width, height), weight, Build material, Glass, Display size, Resolution (ppi), Screen protection, OS version, CPU core, CPU clock, Internal memory, External memory, RAM, Main camera (pixel), Main camera focus, Main camera extra feature, Selfie camera (pixel), Selfie camera focus, Selfie camera extra feature, Main video (pixel), Main video frame, Front video (pixel), Front video frame, Sensors, Battery (mAmp), Battery removal, Fast charging and Price. The class value is labeled as three levels (1, 2, and 3) of consumer satisfaction based on calculated sentiment score. 66% of instances are used to train the model and the rest are used to test the accuracy.
Identifying Impact of Attributes on Customer Satisfaction
We tried to reduce the number of features or attributes to find an optimal set of important attributes using feature selection techniques. Feature selection is a process to reduce the dimensionality of high-dimensional patterns. It produces a subset of features or attributes to increase the accuracy of a model. Univariate Feature Selection (UFS) improves the performance of models by reducing computational costs. It statistically tests the relationship between input and output feature. Principle Component Analysis (PCA) is a powerful tool that reduces a large set of variables into a small set that still contains most of the information of the original set. It produces a number of uncorrelated variables from a large number of correlated variables by mathematical procedure. Recursive Feature Elimination (RFE) recursively removes the weakest feature (less important feature) until the specified number of features is reached (Khalid, Khalil, and Nasreen Citation2014; Sharma and Dey Citation2012).
We implemented three feature selection algorithms- Univariate Feature Selection (UFS), Principle Component Analysis (PCA) and Recursive Feature Elimination (RFE) to find reduced number of significant attributes. We took the result from each feature selection algorithm and applied them into each of the learning algorithms. Then, we compared the results and identified the optimal set of attributes that gives the best result. Depending on the selected attributes from feature selection techniques and examining the results given by the learning algorithms, we have prioritized the attributes of smart phone based on their contributions on customer satisfaction.
Results and Findings
Public opinion polarity is measured for each smart phone model based on sentiment score.
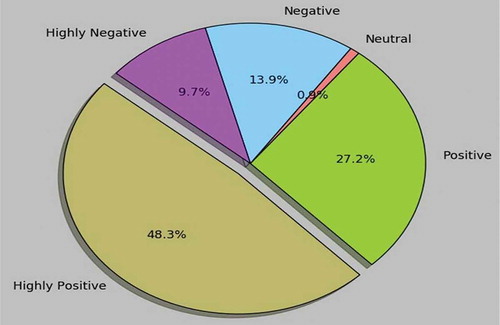
states that most of the public comments on Samsung S 10 plus are positive (75.5%). 48.3% of them are highly positive. 24.6% of public comments refer negative sentiment and 9.7% of them are highly negative. The compound score found for Samsung S 10 plus is 0.35. The results indicate that majority of people gave positive opinion about the phone.
Figure 2. Public opinion on Samsung S10 plus.
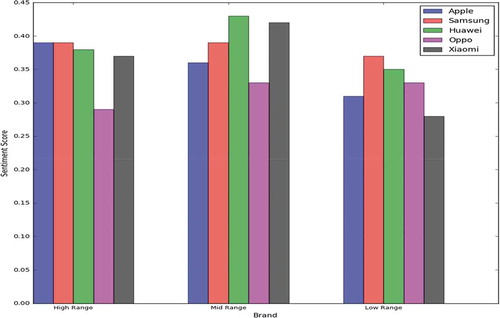
states the comparison of public satisfaction among five brands based on calculated sentiment polarity score in three different categories based on price (high range, mid range, and low range). Each vertical bar represents the average compound score of three smart phone models of each brand and of each price category. From the figure, we see that customer satisfaction is high on Apple and Samsung for highly priced smart phones. Consumers are not so much satisfied with expensive phones of Oppo. In the section of mid range phones, Huawei has the maximum satisfaction level of consumers. Xiaomi places second and Samsung places third in term of customer satisfaction level. Here also Oppo gives a poor customer satisfaction level among the five brands. Cheap Samsung smart phones have very high customer satisfaction level where cheap Huawei phones places second. Cheap Xiaomi phones have bad satisfaction levels among the five brands.
Figure 3. Comparison among five brands based on consumer sentiment.
By taking the average sentiment polarity score of all the nine smart phone models not considering the price category this time, we get the overall satisfaction level.
Total number of reviews is 9000 for each brand that includes 1000 reviews of each 9 smart phone models.
shows the overall sentiment results found based on smart phone brands. From the overall score, we see a minor variance in satisfaction levels among the five brands. Here Huawei has the highest customer satisfaction level with sentiment score 0.39. Samsung is just behind Huawei with score 0.38. Oppo has the lowest customer satisfaction level among the five brands with score 0.31.
After finding the sentiment score, five machine-learning techniques are applied with 31 attributes and class value containing sentiment level. We measured the accuracy and other performance matrices for 31 attributes. Then performance is improved by reducing attributes using the three well-known feature reduction algorithms.
With our initial set of 31 attributes, SVM gives the best result with accuracy 66.67% and also with all other performance matrices (). Naïve Bayes gives the second best results. After applying feature selection algorithms UFS gives the best result with a set of 23 attributes. Accuracy is 60% for SVM. Random Forest is also giving good results just after SVM. RFE gives the best result with a set of 25 attributes. SVM gives highest accuracy 53.33%. Here, Random Forest and Naïve Bayes are also giving good results placed after SVM.
Principle Component Analysis (PCA) gives the best result with a set of 21 attributes. The above result shows that PCA performs best for our dataset with maximum accuracy 73.33% given by Support Vector Machine (SVM). All the other performance matrices are also giving the best results. Kappa statistics gives a good value with 0.55, Root mean squared error rate is small (0.38), True Positive (TP) rate is high and False Positive (FP) rate is low, Precession is 0.88 which is acceptable, F-measure and ROC area are also giving high accepted values.
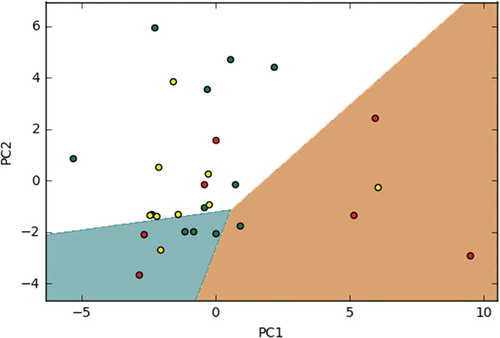
states the result found while PCA is applied on our data set. Here, component is set to 2 and the 80% of dataset is used as training data set and 20% of dataset is used as test data set. The PC1 and PC2 represent the first component and second component respectively. The red dots are the samples containing high level satisfaction class, green dot samples contain class with middle level of satisfaction and yellow dot samples contain low level satisfaction class. Three decision regions are represented by white color, cyan color and chocolate color. Some features containing enough information are rear from decision boundaries and some features containing little information are close to boundary.
Figure 4. PCA using two components.
states the measured variance of attributes given by PCA. The more variance means the more information an attribute holds. The list is given in descending order of variance. The Battery feature of smart phone has the highest significance in determining customer satisfaction with high variance value (VarBattery = 0.901725). The features like Rear Video (VarVideo = 0.303088), Front Video (VarFront_Video = 0.250623), Price (VarPrice = 0.125263), External Memory (VarExternal_Memory = 0.085875), Internal Memory (VarInternal_Memory = 0.078258), Resolution (VarResolution = 0.047789), Weight (VarWeight = 0.022369) also have high importance on customer satisfaction.
Table 1. Smart phone models we experimented.
Table 2. Some of the words that we added to vader lexicon.
Table 3. Public sentiment results of five brands.
Table 4. Performance evaluation of machine learning algorithms with feature selection techniques.
Table 5. Attribute variance value measured by PCA.
states that 21 out of 31 initially chosen attributes cover almost all of the information. The attributes are ranked based on their variance values. The optimal set of 21 attributes selected by PCA is {Battery, Video, Front Video, Price, Internal Memory, External Memory, Resolution, Weight, Dimension – height, Fast charging, Dimension-length, Video frame, Selfie camera, Front video frame, Main camera, RAM, Camera extra feature, OS version, CPU core, Display size, Brand}. These features of smart phones have more impacts on customer satisfaction.
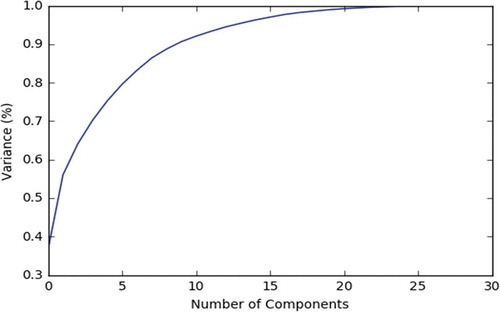
Figure 5. Smart phone dataset explained variance.
Conclusion
Sentiment analysis is an important aspect in almost every business and social domain in present time. Most of our decisions are biased by other peoples’ opinions. Our study will certainly reduce the uncertainty of customers making decisions of buying smart phones. Our study provides useful information for both customers and merchants. In our study, we tried to give an overview of customer satisfactions on world’s top five smart phone brands. An inter-brand comparison on consumer satisfaction is shown considering the price issue. Additionally, we have measured the contributions of different features or attributes of smart phone on consumer satisfaction that will guide the product developing companies to make market oriented plans.
Additional information
Funding
References
- Cha, J., and C. P. Borchgrevink. 2019. Customers’ perceptions in value and food safety on customer satisfaction and loyalty in restaurant environments: Moderating roles of gender and restaurant types. Journal of Quality Assurance in Hospitality and Tourism 1–19. doi:10.1080/1528008x.2018.1512934.
- Eklund, M., U. Norinder, S. Boyer, and L. Carlsson. 2014. Choosing feature selection and learning algorithms in QSAR. Journal of Chemical Information and Modeling 54 (3):837–43. doi:10.1021/ci400573c.
- Farooq, M. S., M. Salam, A. Fayolle, N. Jaafar, and K. Ayupp. 2018. Impact of service quality on customer satisfaction in Malaysia airlines. Journal of Air Transport Management 67:169–80. doi:10.1016/j.jairtraman.2017.12.008.
- Geetha, M., P. Singha, and S. Sinha. 2017. Relationship between customer sentiment and online customer ratings for hotels - An empirical analysis. Tourism Management 61:43–54. doi:10.1016/j.tourman.2016.12.022.
- Hasan, A., S. Moin, A. Karims, and S. Shamshirband. 2018. Machine learning-based sentiment analysis for Twitter accounts. Mathematical and Computational Applications 23 (1):11. doi:10.3390/mca23010011.
- Jiayin, Q., Z. Zhang, S. Jeon, and Y. Zhou. 2016. Mining customer requirements from online reviews: a product improvement perspective. Information and Management 53:951–63. doi:10.1016/j.im.2016.06.002.
- Jin, J., J. Ping, and G. Rui. 2016. Identifying comparative customer requirements from product online reviews for competitor analysis. Engineering Applications of Artificial Intelligence 49:61–73. doi:10.1016/j.engappai.2015.12.005.
- Khalid, S., T. Khalil, and S. Nasreen. 2014. A survey of feature selection and feature extraction techniques in machine learning. Science and Information Conference August 27-29. doi:10.1109/sai.2014.6918213.
- Kolog, E. A., C. S. Montero, and T. Toivonen. 2018. Using machine learning for sentiment and social influence analysis in text. Advances in Intelligent Systems and Computing 453–63. doi:10.1007/978-3-319-73450-7_43.
- Lakshmanaprabu, S. K., K. Shankar, D. Gupta, J. J. Ashish Khanna, P. C. Rodrigues, P. R. Pinheiro, and V. H. C. de Albuquerque. 2018. Ranking analysis for online customer reviews of products using opinion mining with clustering. Complexity 2018:1–9. doi:10.1155/2018/3569351.
- M S, N., and R. Rajasree 2013. Sentiment analysis in Twitter using machine learning techniques. Fourth International Conference on Computing, Communications and Networking Technologies July 4-6. doi:10.1109/icccnt.2013.6726818.
- Manek, A. S., P. Deepa Shenoy, M. Chandra Mohan, and K. R. Venugopal. 2016. Aspect term extraction for sentiment analysis in large movie reviews using Gini Index feature selection method and SVM classifier. World Wide Web 20:135–54. doi:10.1007/s11280-015-0381-x.
- Marakanon, L., and V. Panjakajornsak. 2017. Perceived quality, perceived risk and customer trust affecting customer loyalty of environmentally friendly electronics products. Kasetsart Journal of Social Sciences 34:24–30. doi:10.1016/j.kjss.2016.08.012.
- Rathor, A. S., A. Agarwal, and P. Dimri. 2018. Comparative study of machine learning approaches for Amazon reviews. International Conference on Computational Intelligence and Data Science 132:1552–61. doi:10.1016/j.procs.2018.05.119.
- Sampaio, C. H., W. J. Ladeira, and F. D. O. Santini. 2017. Apps for mobile banking and customer satisfaction: A cross-cultural study. International Journal of Bank Marketing 35:1133–53. doi:10.1108/IJBM-09-2015-0146.
- Sharma, A., and S. Dey. 2012. A comparative study of feature selection and machine learning techniques for sentiment analysis. ACM Research in Applied Computation Symposium October 23-26: 1–7. doi:10.1145/2401603.2401605.
- van Lierop, D., M. G. Badami, and A. M. El-Geneidy. 2017. What influences satisfaction and loyalty in public transport? A review of the literature. Transport Reviews 38:52–72. doi:10.1080/01441647.2017.1298683.
- Wang, Y., L. Xin, and Y. Tan. 2018. Impact of product attributes on customer satisfaction: an analysis of online reviews for washing machines. Electronic Commerce Research and Applications 29:1–11. doi:10.1016/j.elerap.2018.03.003.