
 ?Mathematical formulae have been encoded as MathML and are displayed in this HTML version using MathJax in order to improve their display. Uncheck the box to turn MathJax off. This feature requires Javascript. Click on a formula to zoom.
ABSTRACT
Ovarian cancer stands in the sixth position among the most commonly occurring cancers in the world. Because of the high rate of recurrence, this gynecological malignancy seems to be a vital reason behind cancer-related death among women as tumor recurrence stands as an obstacle in ovarian cancer treatment. It is crucial to find those recurrence causing factors in order to plan suitable therapies with high prognostic results. Hence, in this work, a multistage feature selection methodology is proposed to identify key MiRNAs and clinical features for improving the accuracy of ovarian cancer recurrence prediction. MiRNA expression profiles of ovarian cancer patients and their corresponding clinical data were downloaded from the TCGA cancer repository. From 588 MiRNAs, 6 key MiRNAs were selected using the Inheritable Bi-objective Combinatorial Genetic Algorithm (IBCGA) followed by factor analysis. The biological importance of the resultant MiRNAs in cancer and cellular pathways were studied using Gene Ontology (GO) and Kyoto Encyclopedia of Genes and Genomes (KEGG) analysis. Further, recurrence prediction was performed using the obtained MiRNA expression profiles and clinical factors, chosen using correlation analysis. The proposed approach using the selected features yielded a prediction accuracy of 91.86% using the XGBoost classifier while the same without feature selection was 76.59%. Compared to previous similar works, this model provides a better result in terms of accuracy and reveals influential MiRNAs in ovarian cancer.
Introduction
Ovarian Cancer (OC) seems to be a deadly disease that is now diagnosed more frequently. Cancer statistics in 2018, reported about 22,240 new cases and 14,070 deaths in the United States, 52,100 new cases with 22,500 deaths in China and even more cases in other countries (Siegel, Miller, and Jemal Citation2018). Due to the high recurrence rate, the overall survival is just 30% even after surgical resection and chemotherapy. American cancer society defines recurrence as the detection of cancer after treatment and after a certain time period usually one year within the same place where it originated or any other body part. In order to manifest suitable therapies for improved treatment outcomes, it is necessary to determine high recurrence risk patients in the early stage itself. Monitoring the clinical symptoms alone will not provide a guaranteed solution since 70% of OC patients experience recurrence (Diaz-Gil et al. Citation2016; Vistad et al. Citation2017). It is necessary to bring out those molecular level biomarkers acting behind recurrence prediction and overall survival. Analysis of gene expressions using microarrays is one of the commonly used methods for cancer biomarker detection. Gene alteration and protein structure prediction can be applied in many treatment therapies. Recently, the role of MiRNAs has been found in human biological processes including carcinogenesis, cellular, and embryonic development (Zhang et al. Citation2020). They have been widely used in cancer research due to their prominent role in gene regulation. These small noncoding RNAs hinders the protein translation process by targeting messenger RNAs (mRNAs) thereby affecting crucial organic processes, namely, proliferation of cells, hematopoiesis, apoptosis, and secretion of insulin within a human body. Since they have the capacity to regulate gene expression, MiRNAs are widely used in cancer research. MiRNA expression profiling was analyzed in many studies and found that these expression profiles are altered in different cancers like acute leukemia, lung cancer, Pan-Cancer, breast cancer, and glioblastoma (Li and Kowdley Citation2012). Many machine learning approaches have used gene profiling for cancer grade classification and recurrence prediction. But it has been scientifically proved that MiRNA profiling delivers more accurate results than gene profiling (Lu et al. Citation2005). MiRNA expression profiling reveals the molecular signature of different cancer types and hence they were used in many studies and found that they were associated with cancer progression as well as overall survival of cancer patients. So MiRNA expression analysis can highly contribute to recurrence prediction and survival analysis. Earlier studies reported that the expression of the miR-200 family is directly associated with recurrence (Koutsaki et al. Citation2017). Although there are many papers that discuss the application of machine learning techniques in recurrence prediction, early identification of OC recurrence is still in its dormant stage.
Haiyue Zhao in 2016 (Zhao et al. Citation2016) used seven dataset from TCGA and GEO to point out two gene signatures that include KCNN4 and S100A14 that are related to serous ovarian carcinoma recurrence. The prediction capacity of KCNN4 and S100A14 was analyzed by using machine learning classifiers-random forest, support vector machine (SVM), and artificial neural networks. Marina Bagnoli et al. in 2016 (Bagnoli et al, Citation2016) identified a MiRNA signature consisting of 35 MiRNAs that can predict the progression of ovarian cancer using their model MiROvaR which is based on principal component analysis and univariate cox regression. In 2017, Kai Yang et al. (Citation2017) identified six long noncoding RNAs (IncRNA) associated with ovarian cancer recurrence using GEO data set and the least absolute shrinkage and selection operator (LASSO). AUC values were 0.813 for training,0.697 for internal validation and 0.711 for external validation. They found that these six incRNAs can predict Disease Free Survival for ovarian cancer patients. Jinting Zhou et al. in 2018 (Zhou et al. Citation2018), constructed a model based on SVM and identified 39 genes that can classify recurrent and nonrecurrent samples. They used TCGA and GEO datasets. Survival curve based on Kaplan–Meier revealed that the survival time of nonrecurring ovarian cancer patients was longer than recurrent patients. Jingwei Dong and Mingjun Xu in 2018 (Dong and Xu Citation2019) used SVM and identified MiRNA signatures with 19 MiRNA’s that can distinguish recurrent samples and non-recurrent samples. Among 19 MiRNAs six MiRNAs (hsa-mir-193b, hsa-mir-211, hsa-mir-218, hsa-mir-505, hsa-mir-508, and hsa-mir-514) have a direct impact on cancer prognosis and a risk score was built using their expression values. Sun Paik et al. in 2019 (Paik et al. Citation2019) used a gradient boosting model for predicting the overall survival of epithelial ovarian cancer patients and confirmed that the gradient boosting method is superior to statistical methods such as cox regression. But only clinical features were considered for the study and they did not mention the underlying bio-markers actually responsible for these phenotypic dysregulations. Hence, they faced the problem of biasing. Eliza Razak et al. in 2019 (Razak, Yusof, and Raus Citation2019) used MiRNA expression profiling for predicting cancer recurrence. They used the MiRNA dataset of glioblastoma, HCC, and OC patients. One dependent estimator which is a seminaïve bayesian method was used here for classification. Before classification, relevant MiRNAs were selected based on entropy and a discretization was done to convert continuous expression values into discrete values. Although their work delivered high accuracy of 92.82%, they did not mention key MiRNAs and their role in biological activities. Yi-Cheng Gao et al. in 2019 (Gao, Zhou, and Zhang Citation2019) put forward a method based on ensemble classifiers for predicting OC prognosis using gene expression data. They divided OC data into three groups based on clustering and survival risk was calculated. A co-expression network of genes was constructed and communities that are prominent were determined. Aasa Shimizu et al. in 2019 (Shimizu, Sawada, and Kimura Citation2019) emphasized on developing new approaches for detecting OC recurrence based on molecular bio-markers. The paper suggested that these biomarkers alone are not sufficient for recurrence prediction. Hence, it is necessary to include conventional clinical and molecular factors so that patients may get more suitable treatment therapies that help them to survive this fatal disease. All these previous studies put forward the prominent role of MiRNAs as potential biomarkers of cancer. Even if all the above studies gave fairly good accuracies, they failed to properly incorporate clinical features that are strongly correlated with OC recurrence. They focused on single RNA prognostic values while building the model. It is necessary to integrate significant prognostic features during model construction as it can provide more accurate results with clinical significance. The current study exploits Genetic Algorithm (GA)-based feature selection for selecting potential MiRNAs and using them for OC recurrence prediction after cleansing them using factor analysis. The main contributions from this work includes:
A multi-stage feature selection methodology to select key MiRNAs involved in OC recurrence.
Identification of other potential prognostic factors for the prediction of OC recurrence.
Proposed Work
OC widely spreads without showing any specific symptoms and hence it is also known as “Silent Killer.” Medical reports say that only 20% of OCs are detected at the early stages. The survival rate is comparatively low due to the cancer recurrence which results from platinum chemotherapy resistance. Other than this platinum chemotherapy, there are only a few treatments that can save the life of patients. Novel treatment strategies and drugs are still under development and the current situation demands early detection of recurring OC so that more time and treatment solutions can be provided to patients from clinical practitioners. Conventional cancer recurrence detection methods are based on examining patient’s biopsy report which is highly labor intensive. Due to its higher specificity and sensitivity, MiRNAs are now becoming a promising approach as their expression profiles collected from body fluids can predict cancer recurrence. Till now more than 2000 MiRNAs have been discovered and they post-transcriptionally regulate human genes. This paper uses MiRNA expression data which is downloaded from the TCGA cancer repository and using these expression profiles cancer recurrence can be determined. In addition to MiRNAs, clinical factors related to recurrence were also identified and they were also considered for recurrence prediction. Hence, the dataset downloaded from TCGA consists of 588 MiRNA expression profiles and 15 clinical features of High-Grade Serous Ovarian Cancer patients. TCGA data can be easily downloaded using LinkedOmics (https://www.linkedomics.org) and cBioportal (https://www.cbioportal.org/). A total of 1534 patient samples were analyzed. Among them, 453 patients have MiRNA expression profiling information. There were 588 MiRNAs and all these MiRNAs are not responsible for cancer recurrence. Only a small set of MiRNAs is actually required. As there are lots of MiRNAs that are irrelevant, it is necessary to identify those key MiRNAs so that dimensionality and computational complexity can be reduced. Also the powerful MiRNAs that can actually act as predictors get mixed up with those unwanted MiRNAs which will ultimately affect classifier performance. So feature selection is used here as a weapon to defend against overfitting and increased training time. But choosing the right features is indeed a tremendous task as any discrepancies can lead to misdiagnosis or late diagnosis. In order to select the topmost MiRNAs, a feature selection method based on GA known as IBCGA is used here. For narrowing towards the key MiRNAs IBCGA result was further refined using factor analysis, a technique used for better decision-making in the Medical Field. The exploration methodology implemented here comprises of following steps:
Retrieval of MiRNA expression data and associated clinical features from the TCGA repository.
Identification of key MiRNAs involved in OC recurrence prediction. This involves
Initial MiRNA filtering using IBCGA
Refinement of IBCGA output with factor analysis
Investigation on the relevance of obtained final MiRNA set.
Detection of clinical features that are related to recurrence using correlation analysis.
Predicting OC recurrence using selected MiRNAs and clinical features.
The proposed method implemented here works in two phases – feature selection and classification which are detailed in the following sections.
Feature Selection
In simple terms, feature selection is the processes by which input data were reduced with the aim of attaining maximum performance for a predictive model at a reduced computational cost. Hence, only those features that have some relation with the target variable are retained and others were excluded. In the medical field, it is indeed a challenging task to determine those attributes and clinical characteristics that aids the physician for better decision-making. The high complexity of the clinical dataset demands the need for an outstanding feature selection technique that not only mines out key attributes but also assists in medical diagnosis. Here GA-based feature selection is used for OC recurrence prediction.
Determination of Key MiRNAs
MiRNA dataset downloaded from TCGA repository consists of 588 MiRNA expression profiles of 453 patients. Not all MiRNAs are required for recurrence prediction as it can cause overfitting thereby affecting classifier accuracy. Determining relevant MiRNAs is indeed a challenging task. Till now many feature selection methods have been used side by side with classifiers. Due to its global search property, GA, a class of evolutionary algorithms has been successfully applied for feature optimization in many previous works (Adorada and Wibowo Citation2019). GA follows the theory that, within nature for adapting to a particular environment, genes of life forms continuously evolve through generations. So here a GA-based feature selection algorithm known as IBCGA (Ho, Chen, and Huang Citation2004) was used that chooses only relevant MiRNAs that are associated with recurrence. IBCGA was previously used in many works for MiRNA selection and it shows superior performance. IBCGA was successfully used for estimating the survival time of patients (Sathipathi, Huang, and HO Citation2016), predicting ubiquitination sites in humans (Wang et al. Citation2017), and for detecting the regulatory roles of cyclic AMP receptor proteins (Tsai et al. Citation2018). In a single run, IBCGA finds a complete set of solutions that are of high quality and nondominating nature. Here using IBCGA a set of MiRNAs were chosen for distinguishing the recurrent and nonrecurrent type of OC.
IBCGA – Inheritable Bi-objective Combinatorial Genetic Algorithm
IBCGA is an evolutionary algorithm used for solving combinatorial optimization problems having large parameters (Tung and Ho Citation2007). IBCGA uses an Orthogonal Experimental Design (OED) based on an orthogonal array for finding a complete set of solutions that is nondominating. OED can simultaneously analyze the effect of several elements on the response variable. The value of a particular element is known as its level and the best level combination is determined using OED. An orthogonal array can perform a comparison between levels of elements in a balanced fashion thereby reducing level combination for analysis. In an orthogonal array, each row represents the level of elements in a particular combination and the column shows certain elements that can be varied for each combination. The effect of one element on the response variable is known as the main effect and this main effect of one element does not have any impact on the main effect of another element. For example, an orthogonal design with rows and
columns having two levels (values of elements) is designated as
(
). In the current study, there are 588 MiRNAs and hence there will be 588 columns and the level value will be two correspondings to the inclusion or exclusion (level = 1, then MiRNA is included 0 otherwise) of particular MiRNA based on the accuracy value (here 10 cv). The main effect of an element
having a level
is denoted as
(Here there are 588 MiRNAs.)
In EquationEquation (1)(1)
(1) ,
is the value of function which is usually the prediction accuracy obtained from the combination
and
, if in combination k, level of element
is
else
Here,
, if level 1 of an element
is more preferable than level 0 of an element
in maximizing the objective function. Variable with the highest main effect difference (
) is the most impacting one. Based on MED, IBCGA selects key MiRNAs from a search space of
where the range of
is initially specified. Here IBCGA selects 15 MiRNAs from 588. The traditional Genetic Algorithm terms – Gene and Chromosome were used here (Sujamol et al. Citation2018b). The chromosome encoding here consists of n = 588 binary genes ‘
’. If
then that particular MiRNA is not included in the signature and if
then that MiRNA is added. Tenfold cross validation is used as the fitness function and a set of solution,
, is obtained where
.
and
is initially specified. The main steps of the IBCGA algorithm is shown as pseudo-code below:
Algorithm: Feature selection using IBCGA
Input: MiRNA expression profiles
Output: Reduced set consisting of key MiRNAs
Begin
Generate initial population randomly with n binary genes having and
where
.
Set the fitness function as the accuracy of prediction with respect to 10-fold cross validation.
While (! Stop condition) do
Select best fit individuals using tournament selection to form the mating pool.
Perform orthogonal cross over on pair of parents selected.
Apply mutation on randomly selected individuals.
Evaluate the individuals.
Replace least performance population with new individuals.
If , transform one gene bit chosen randomly from 1 to 0.
End While.
IBCGA output consist of 15 MiRNAs that include hsa-mir-1269, hsa-mir-1271, hsa-mir-1275, hsa-mir-151a, hsa-mir-181d, hsa-mir-191, hsa-mir-205, hsa-mir-20b, hsa-mir-224, hsa-mir-342, hsa-mir-454, hsa-mir-509, hsa-mir-658, hsa-mir-671, and hsa-mir-760. shows the mirbase id and mature sequence of obtained MiRNAs. Normalized expression profiles of 588 MiRNAs are given as input to IBCGA and parameter setting is: Generation = 50, Begin = 50, End, E = 15, and cross validation = 10 cv. Different combinations were applied on trial and error bases and the algorithm performed with the highest accuracy of 84.85 with the above parameter setting. IBCGA output was further refined by applying factor analysis for picking out the most relevant MiRNAs.
Table 1. MiRNAs with their mature sequence
MiRNA Refinement Using Factor Analysis
Outcome obtained from IBCGA is further refined using factor analysis to find key MiRNAs (Ohshiro and Ueda Citation2018). Factor analysis, based on covariance, reduces the number of variables in a dataset by simplifying it. This analysis helps in pruning out any insignificant MiRNAs existing in the IBCGA output so that the study will be concentrated on the most promising ones. Kaiser-Meyer-Olkin (KMO) Test was used for determining the suitability of data for Modeling and it is calculated using EquationEquation (2)(2)
(2) . shows the output of factor analysis.
Table 2. Top 15 MiRNAs and their Eigenvalues
In EquationEquation (2)(2)
(2) ,
is the correlation matrix and
is the covariance matrix. KMO value obtained here is 0.6 which is considered adequate. Eigen values are calculated for each input variable and shows the rank of each MiRNA and their original Eigenvalues. From , the top six MiRNAs have eigenvalues greater than 1 and the theory of factor analysis says that those variables whose value are greater than 1 is considered as the most significant variables. So the top six MiRNAs are wrapped up for further examination. Here factor Analysis not only provided simplicity but also helped to determine the core MiRNAs. These MiRNAs were analyzed using TAM 2.0 and DIANA, which are tools for MiRNA functional analysis to find their role in complex disorders.
Enrichment and Pathway Analysis
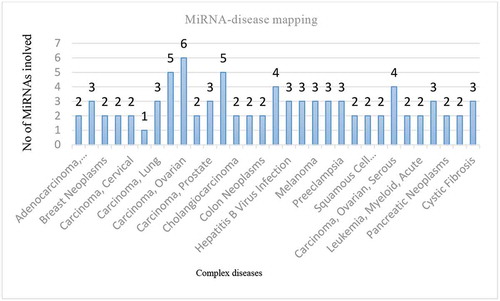
After the completion of factor analysis, six MiRNAs were obtained and the next task is to determine those possible cellular and molecular processes affected by them in order to ensure that the obtained MiRNAs have a significant role in biological activities. Enrichment analysis not only helps to identify functions of MiRNAs in modifying regulatory networks of genes but also find dysregulated genes and MiRNAs. It uses statistical methods and tools to identify the MiRNAs associated with disease phenotypes. Pathway analysis is used to determine the role of identified MiRNAs in a particular biological pathway. Here TAM 2.0 (Li et al. Citation2018) and Diana Mirpath servers (Vlachos et al. Citation2015) were used for enrichment and pathway analysis. TAM 2.0 (http://www.cuilab.cn/tam/) is a tool exclusively for MiRNA analysis and the top six MiRNAs – hsa-mir-205, hsa-mir-191, hsa-mir-151, hsa-mir-224, hsa-mir-509-1, and hsa-mir-760 were given as input to this web server. shows result visualization after inputting these MiRNAs to TAM 2.0. Numbers indicated on the top of the bar shows the number of MiRNAs in the complex disorders. For example, two MiRNAs are involved in adenocarcinoma, three in breast neoplasms and so on. Other than OC, these MiRNAs are also found in other chronic cancers. From it is found that all six MiRNAs are mapped to OC. P-value and FDR were set as < .05. These MiRNAs are involved in important biological function like angiogenesis, cell cycle, cell death, cell motility, epithelial-to-mesenchymal transition, inflammation, wound healing, brain development, circadian rhythm aging, cell proliferation, lipid metabolism, osteogenesis, and cell migration. shows the result of functional analysis. All six MiRNAs are mapped to OC and hence the obtained set is highly promising. For example, hsa-mir-224, hsa-mir-205, hsa-mir-509-1, and hsa-mir-760 are altered in OC, hsa-mir-191 and hsa-mir-509-1 have altered expression values in ovarian serous carcinoma. MiRNAs hsa-mir-224, hsa-mir-191, and hsa-mir-151a are dysregulated in Ovarian Neoplasm’s. Pathway analysis using KEGG and GO was done using DIANA mirpath v3.0. The six MiRNAs were saved in a text file and then uploaded to this web server and the results obtained indicate that all these MiRNAs play a key role in pathways and biological activities which is detailed in the following sections. p value and FDR were < 0.05.
Table 3. Role of MiRNAs in biological activities
Figure 1. Bar chart based on TAM result showing the number of selected MiRNAs in complex disorders
KEGG Pathway Enrichment Analysis
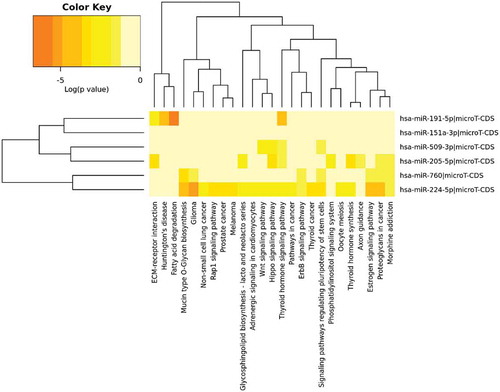
For evaluating the significance of these six MiRNAs in biological processes, KEGG and GO methods have been employed using DIANA tools. All the selected MiRNAs have a statistically significant correlation with cancer. To name a few, pathways including Hippo signaling, TGF-beta signaling, Estrogen signaling, and FoxO signaling have the presence of these MiRNAs. Fisher’s exact test was used for enrichment analysis and p value < .05. shows the result after pathway enrichment analysis. shows the heatmap obtained after performing union operation on pathways.
Table 4. Result obtained from KEGG pathway analysis
Figure 2. Heatmap obtained after performing pathway analysis using KEGG
Gene Ontology Analysis
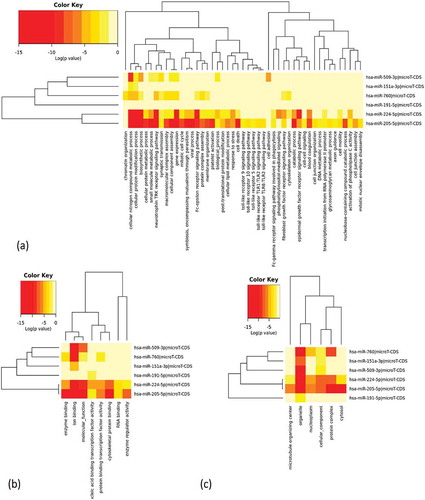
In order to determine the biological significance of six MiRNAs, Gene Ontology (GO) annotations are employed in three levels –biological, molecular, and cellular levels. Fisher’s Exact Test was used for enrichment analysis and p value < .05. MicroT threshold was set as 0.6. For predicting MiRNA targets DIANA-Tarbase algorithm was used. GO analysis shows that these MiRNAs are part of microtubule organisms’ center, organelle, cellular component, protein complex, cytosol, and nucleoplasm. They are involved in molecular activities such as nucleic acid binding, transcription factor activity, ion binding, molecular function, protein binding, enzyme binding, and cytoskeletal protein binding. The result obtained after the GO analysis is shown with the help of a heatmap in .
Figure 3. Heatmap after performing GO annotation in three levels – (a) biological level, (b) molecular level, and (c) cellular level
Enrichment and pathway analysis manifest that all the selected MiRNAs play a vital role and hence they are most suited for recurrence prediction. KEGG and GO revealed that all six MiRNAs involved in the end list were highly significant. A detailed study was made on them after referring to previous bioinformatics papers which are summarized below:
hsa-mir-205 – Overexpression of hsa-mir-205 promotes proliferation and invasion of OC cell (Chu et al. Citation2018). Two target genes of mir-205 are PTEN and SMAD4. Overexpressed mir-205 can suppress PTEN and SMAD4 leading to their down regulation. In OC tissue, these two genes are downregulated which indicate the tumor-boosting role of hsa- mir-205. hsa-mir-205 is also involved in other activities like angiogenesis, cell cycle, cell death, cell motility, epithelial to mesenchymal transition, inflammation, and wound healing.
hsa-mir-191 – It is experimentally confirmed that in ovarian endometriosis and ovarian endometrioid carcinoma, mir-191 expression are high (Tian, Xu, and Wang Citation2015). DAPK1 gene is directly targeted by this MiRNA resulting in the inhibition of cell killing (apoptosis). hsa-mir-191 is also involved in brain development, cell cycle, circadian rhythm, and epithelial to mesenchymal transition.
hsa-mir-151 – This MiRNA is involved in aging. Two genes TNFSF10 and FNDC1 are directly targeted by upregulated mir-151 resulting in cell apoptosis regulation. Dysregulated mir-151 can result in uncontrolled cell division thus increasing the severity of ovarian cancer (Chen et al. Citation2018).
hsa-mir-224 – mir-224 plays a crucial role in metastasis, apoptosis, cancer cell survival, the proliferation of cells, lipid metabolism, and osteogenesis. Studies confirmed that mir-224 targets the KLLN gene in epithelial ovarian cancer (Hu and Liang Citation2017).
hsa-mir-509-1 – mir-509 is involved in the migration and proliferation of cells. In previous studies, it is confirmed that downregulated expression of mir-509 in the advanced stage of ovarian serous carcinoma leads to poor survival (Yu et al. Citation2013).
hsa-mir-760 – upregulated expression of mir-760 resulted in offensive phenotype and low survival in Patients having OC (Dong and Xu Citation2019). This MiRNA will target the gene PHLPP2 thus encouraging cell proliferation. The high correlation of mir-760 with PHLPP2 assured its key role in ovarian cancer. mir-760 is involved in the TGF-beta signaling pathway, hippo signaling pathway, and steroid biosynthesis.
Clinical Feature Selection
Monitoring cancer prognosis requires the careful integration of both histological and clinical features. MiRNA expression profiling has got a high impact on recurrence prediction in previous works (Wang et al. Citation2014) as the level of expression varies in tumor tissues and normal tissues. Along with these MiRNAs other prognostic factors responsible for recurrence were also analyzed here. For this, clinical data of 1534 patients with recurrence information were downloaded from TCGA using cBioportal. Only those patients having both MiRNA expression data and clinical details were selected. The clinical dataset provided information regarding cancer type, age, disease-free months, disease-free status, fraction genome altered, mutation count, neoplasm histologic grade, platinum status, primary therapy outcome success, somatic status, tumor residual disease, tumor purity, cancer stage, radiation therapy, and ethnicity. Clinical features related to the patients’ sample from a computational point of view were analyzed using Pearson Correlation (p value < .05) and those features related to recurrence were only included. Samples that lack recurrence information were excluded from the study and the final data set consist of 429 patient information with 588 MiRNA expression values, their recurrence details (recurrent cases = 318, non-recurrent cases = 111), survival information (disease-free months, overall survival in months, survival status), and molecular features. In addition to MiRNA expression data, two molecular characteristics – fraction genome altered (FGA) and mutation count (MC) along with disease-free months (DFM) and the overall survival (OS) period were also included after performing correlation analysis. shows the result after correlation analysis. Other parameters like neoplasm histologic grade, platinum status, primary therapy outcome success, somatic status, tumor stage, tumor residual disease were excluded from the study since there was no computational relevance. A significant correlation was noted for FGA, MC, DFM, and OS while age and tumor purity have nothing to do with recurrence prediction.
Table 5. Correlation results of molecular features
FGA refers to the amount of genome within a cell body that has been influenced by the gain or loss of copy number. Inside a cell, copies of genes will be created as a result of biological processes and such duplication is known as copy number. The average number of errors taking place within a genome is known as MC. Earlier studies revealed that patients with a high value of FGA and low valued MC experience short disease free survival time (Chakraborty et al. Citation2019, Citation2020). Both FGA and MC act as independent predictors of patient survival. A higher value of FGA indicates that there is less chance of recurrence and patient will experience an increased survival period (Mehta et al. Citation2005). From , it is found that FGA and MC correlation values are negative indicating an increased recurrence rate when these values keep shrinking. Patients who have a recurrence within 1 year have reduced survival and OS was high for those who have experienced recurrence after a long period. Hence, patients who experienced recurrences have less DFM leading to a negative correlation between DFM and recurrence. So these features were also included for recurrence prediction even if they have negative correlation with recurrence.
OC Recurrence Prediction Using Selected MiRNAs and Clinical Features
OC dataset used here can be classified into two categories – recurrent and nonrecurrent. After scaling and normalization the final dataset consists of 588 MiRNA expression profiles and 15 clinical features of 429 OC patients. The classification was done using both linear and nonlinear classifiers which include Logistic Regression (LR), SVM that comes under linear classifiers while KNN, Decision Trees, Random Forest, Gaussian Naïve Bayesian (Gaussian NB), and XGBoost that comes under nonlinear classifiers. OC dataset with MiRNAs alone were given as input to these classifiers before feature selection and after feature selection. The result indicated that accuracy was higher when IBCGA-based feature selection was applied and 15 MiRNAs were given as input. Accuracy increased when clinical features were included after correlation analysis. The IBCGA result was further refined and the top six MiRNAs were selected. Along with these topmost MiRNAs, selected clinical features were also loaded as input to the classifiers and a substantial increase in accuracy was observed. In all cases, the XGBoost classifier delivered consistent performance (Zhang et al. Citation2019). shows the entire classification result. CF in the table indicates clinical features and SCF indicates selected clinical features after correlation. The result figured out that clinical features have a relation to cancer recurrence since it accelerated the classification result considerably. Using six topmost MiRNAs and selected clinical features XGBoost provided the highest accuracy of 91.86%. The MiRNAs hsa-mir-205, hsa-mir-191, hsa-mir-151, hsa-mir-224, hsa-mir-509-1, and hsa-mir-760 act as a signature in predicting OC recurrence.
Table 6. Classification results
The classification procedure was carried out with nine different input combinations. The entire set of MiRNAs was given before feature selection and after feature selection. It is observed that feature selection boosted the accuracy result of classifiers. Also from it is clear that the accuracy of classifiers increased upon adding selected clinical factors.
Result and Discussions
The field of Medical Research often requires strong support systems from the computer field. Humans cannot interpret almost all associations but machines do. So machine learning techniques and applications have an indispensable role in complex disease analysis (Sujamol, Ashok and Krishnakumar Citation2018a). Currently, SVMs are the most widely used classifiers but they have got limitations when dealing with a very large dataset. XGBoost overcomes this difficulty as it has got the capacity of parallel processing huge dataset thereby avoiding overfitting. XGBoost classifier is supported with a feature selection algorithm, IBCGA for selecting key MiRNAs and a statistical method known as factor analysis that tunes IBCGA output. The main findings from the current work are summarized below:
The proposed methodology identified highly promising six MiRNAs, namely, hsa-mir-205, hsa-mir-191, hsa-mir-151, hsa-mir-224, hsa-mir-509-1, and hsa-mir-760 whose biological as well as functional significance were validated using KEGG and GO.
OC recurrence prediction with this six MiRNAs was done using XGBoost classifier and the accuracy was 75.58%. Before feature selection, it was 70.93%.
With these selected six MiRNAs, clinical factors obtained after correlation analysis were integrated and the prediction was done using XGBoost classifier which yielded a prediction accuracy of 91.86%. The same without feature selection was 76.59%.
Following the methodology implemented in (Sathipathi and HO Citation2018), IBCGA and XGBoost were combined together. The obtained accuracy was 77.90%. However, after filtering IBCGA results with factor analysis and including clinical features, the accuracy boosted to 91.86%.
Conclusion
Dysregulation of MiRNAs have been reported in many studies associated with cancer. So far in the field of ovarian cancer studies, MiRNA signatures obtained from serum, tissues, cells, or plasma have been analyzed but recurrence detection tools are lacking and it leads to poor survival. Most of the studies concentrated only on expression profiles of MiRNAs without giving much attention to other prognostic factors and biological pathways as well as cellular functions that are affected by the malfunctioning of these MiRNAs. This paper not only brings out the hidden play of selected MiRNAs in biological as well as cellular pathway but also differentiate between recurrent and non-recurrent cases using a multilevel feature selection strategy. Feature selection algorithm, IBCGA supported with factor analysis exposed highly promising six MiRNAs, which was considered as the signature for recurrence prediction. These MiRNAs can be targeted while planning a treatment strategy for Ovarian Cancer. Along with these MiRNAs other prognostic clinical factors have been included for recurrence prediction. Here the selective power of IBCGA was further refined using factor analysis and the predictive power of XGBoost were fully exploited to reach an accuracy of 91.86%. Based on these findings, an efficient treatment method that will obstruct overexpression of oncogenic MiRNAs and substitute tumor suppresser MiRNAs can be formulated.
Author Statement
All persons who meet authorship criteria are listed as authors, and all authors certify that they have participated sufficiently in the work to take public responsibility for the content, including participation in the concept, design, analysis, writing, or revision of the manuscript. Furthermore, each author certifies that this material or similar material has not been and will not be submitted to or published in any other publication before its appearance in the Applied Artificial Intelligence.
Disclosure Statement
The authors have no conflicts of interest to declare
Data Availability
All data used in this study are freely available from TCGA portal (https://portal.gdc.cancer.gov/).
Additional information
Funding
References
- Adorada, A., and A. Wibowo. 2019. Genetic algorithm-based feature selection and optimization of backpropagation neural network parameters for classification of breast cancer using microRNA profiles. 3rd International Conference on Informatics and Computational Sciences (ICICoS), Semarang, Indonesia, 1–6. doi:10.1109/ICICoS48119.2019.8982530.
- Bagnoli, M., S. Canevari, D. Califano, S. Losito, M. Di Maio, F. Raspagliesi, M. L. Carcangiu, G. Toffoli, E. Cecchin, R. Sorio, et al. 2016. Development and validation of a microRNA-based signature (MiROvaR) to predict early relapse or progression of epithelial ovarian cancer: A cohort study. The Lancet Oncology 17 (8):1137–46. doi:10.1016/S1470-2045(16)30108-5.
- Chakraborty, G., A. Ghosh, S. Nandakumar, J. Armenia, Y. Z. Mazzu, M. O. Atiq, G. M. Lee, L. A. Mucci, T. Merghoub, J. D. Wolchok, et al. 2020. Fraction genome altered (FGA) to regulate both cell autonomous and non-cell autonomous functions in prostate cancer and its effect on prostate cancer aggressiveness. Journal of Clinical Oncology 38 (6_suppl):347–347. doi:10.1200/JCO.2020.38.
- Chakraborty, G., M. Atiq, S. Nandakumar, J. Armenia, Y. Z. Mazzu, G. M. Lee, L. A. Mucci, T. Merghoub, L. A. Mucci ,P.W.Kanto. 2019. A comparative analysis of fraction genome altered vs tumor mutational count in prostate cancer.Molecular and cellular biology/genetics.Proceedings: AACR Annual Meeting 2019, Atlanta, GA. doi:10.1158/1538-7445.
- Chen, S. F., Z. Liu, S. Chaurasiya, T. H. Dellinger, J. Lu, X. Wu, H. Qin, J. Wang, Y. Fong, and Y. C. Yuan. 2018. Identification of core aberrantly expressed microRNAs in serous ovarian carcinoma. Oncotarget 9 (29):20451–66. doi:10.18632/oncotarget.24942.
- Chu, P., A. Liang, A. Jiang, and L. Zong. 2018. miR-205 regulates the proliferation and invasion of ovarian cancer cells via suppressing PTEN/SMAD4 expression. Oncology Letters 15 (5):7571–78. doi:10.3892/ol.2018.8313.
- Diaz-Gil, D., F. J. Fintelmann, S. Molaei, A. Elmi, S. S. Hedgire, and M. G. Harisinghani. 2016. Prediction of 5-year survival in advanced-stage ovarian cancer patients based on computed tomography peritoneal carcinomatosis index. Abdominal Radiology (NY) 41 (11):2196–202. doi:10.1007/s00261-016-0817-5.
- Dong, J., and M. Xu. 2019. A 19 miRNA support vector machine classifier and a 6 miRNA risk score system designed for ovarian cancer patients [published correction appears in Oncol Rep Dec;42(6):2855]. Oncology Reports 41 (6):3233–43. doi:10.3892/or.2019.7108.
- Gao, Y. C., X. H. Zhou, and W. Zhang. 2019. An ensemble strategy to predict prognosis in ovarian cancer based on gene modules. Frontiers in Genetics 10:366. doi:10.3389/fgene.2019.00366.
- Ho, S. Y., J. H. Chen, and M. H. Huang. 2004. Inheritable genetic algorithm for biobjective 0/1 combinatorial optimization problems and its applications. IEEE Transactions on Systems, Man, and Cybernetics. Part B, Cybernetics 34 (1):609–20. doi:10.1109/tsmcb.2003.817090.
- Hu, K., and M. Liang. 2017. Upregulated microRNA-224 promotes ovarian cancer cell proliferation by targeting KLLN. In Vitro Cellular & Developmental Biology – Animal 53 (2):149–56. doi:10.1007/s11626-016-0093-2.
- Koutsaki, M., M. Libra, D. A. Spandidos, and A. Zaravinos. 2017. The miR-200 family in ovarian cancer. Oncotarget 8 (39):66629–40. doi:10.18632/oncotarget.18343.
- Li, J., X. Han, Y. Wan, S. Zhang, Y. Zhao, R. Fan, Q. Cui, and Y. Zhou. 2018. TAM 2.0: Tool for MicroRNA set analysis. Nucleic Acids Research 46 (W1):W180–W185. doi:10.1093/nar/gky509.
- Li, Y., and K. V. Kowdley. 2012. MicroRNAs in common human diseases. Genomics, Proteomics & Bioinformatics 10 (5):246–53. doi:10.1016/j.gpb.2012.07.005.
- Lu, J., G. Getz, E. A. Miska, E. Alvarez-Saavedra, J. Lamb, D. Peck, A. Sweet-Cordero, B. L. Ebert, R. H. Mak, A. A. Ferrando, et al. 2005. MicroRNA expression profiles classify human cancers. Nature 435 (7043):834–38. doi:10.1038/nature03702.
- Mehta, K. R., K. Nakao, M. B. Zuraek, D. T. Ruan, E. K. Bergsland, A. P. Venook, D. H. Moore, T. A. Tokuyasu, A. N. Jain, R. S. Warren, et al. 2005. Fractional genomic alteration detected by array-based comparative genomic hybridization independently predicts survival after hepatic resection for metastatic colorectal cancer. Clinical Cancer Research 11 (5):1791–97. doi:10.1158/1078-0432.CCR-04-1418.
- Ohshiro, A., and S. Ueda. 2018. Comparative study of explanatory factor analysis for construction of Clinical Research education model. IJCSNS International Journal of Computer Science and Network Security 18 (3):27–30.
- Paik, E. S., J. W. Lee, J. Y. Park, J. H. Kim, M. Kim, T. J. Kim, C. H. Choi, B. G. Kim, D. S. Bae, and S. W. Seo. 2019. Prediction of survival outcomes in patients with epithelial ovarian cancer using machine learning methods. Journal of Gynecologic Oncology 30 (4):e65. doi:10.3802/jgo.2019.30.e65.
- Razak, E., F. Yusof, and R. A. Raus. 2019. Cancer relapse prediction from microrna expression data using machine learning. Journal of Mechanics of Continua and Mathematical Sciences (Special Issue–1):365–73. doi:10.26782/jmcms.2019.03.00035.
- Sathipathi, Y. S., H. L. Huang, and S. Y. Ho. 2016. Estimating survival time of patients with glioblastoma multiforme and characterization of the identified microRNA signatures. BMC Genomics 17 (Suppl 13):1022. doi:10.1186/s12864-016-3321-y.
- Sathipathi, Y. S., and S. Y. Ho. 2018. Identifying a miRNA signature for predicting the stage of breast cancer. Scientific Reports 8. doi:10.1038/s41598-018-34604-3.
- Shimizu, A., K. Sawada, and T. Kimura. 2019. Development of novel approaches to detect ovarian cancer recurrence. Journal of Medical Artificial Intelligence 2:3. doi:10.21037/jmai.2019.02.02.
- Siegel, R. L., K. D. Miller, and A. Jemal. 2018. Cancer statistics. CA: A Cancer Journal for Clinicians 68 (1):7–30. doi:10.3322/caac.21442.
- Sujamol, S., S. Ashok, and U. Krishnakumar. 2018a. Study of fuzzy cognitive maps for modeling clinical support systems. International Journal of Pure and Applied Mathematics 119 (12):15433–45. 1314-3395.
- Sujamol, S., S. Ashok, U. Krishnakumar, and C. S. Anoob. 2018b. A genetically optimized method for weight updating in fuzzy cognitive maps. 2018 International Conference on Emerging Trends and Innovations In Engineering And Technological Research (ICETIETR), Ernakulam, 1–5. doi:10.1109/ICETIETR.2018.8529036.
- Tian, X., L. Xu, and P. Wang. 2015. MiR-191 inhibits TNF-α induced apoptosis of ovarian endometriosis and endometrioid carcinoma cells by targeting DAPK1. International Journal of Clinical and Experimental Pathology 8 (5):4933–42. Published 2015 May 1.
- Tsai, M. J., J. R. Wang, C. D. Yang, K. C. Kao, W. L. Huang, H. Y. Huang, C. P. Tseng, H. D. Huang, and S. Y. Ho. 2018. PredCRP: Predicting and analysing the regulatory roles of CRP from its binding sites in Escherichia coli. Scientific Reports 8 (1):951. Published 2018 Jan 17. doi:10.1038/s41598-017-18648-5.
- Tung, C. W., and S. Y. Ho. 2007. POPI: Predicting immunogenicity of MHC class I binding peptides by mining informative physicochemical properties. Bioinformatics 23 (8):942–49. doi:10.1093/bioinformatics/btm061.
- Vistad, I., L. Bjørge, O. Solheim, B. Fiane, K. Sachse, J. Tjugum, S. Skrøppa, A. G. Bentzen, T. Stokstad, G. A. Iversen, et al. 2017. A national, prospective observational study of first recurrence after primary treatment for gynecological cancer in Norway. Acta obstetricia et gynecologica Scandinavica 96 (10):1162–69. doi:10.1111/aogs.13199.
- Vlachos, I. S., K. Zagganas, M. D. Paraskevopoulou, G. Georgakilas, D. Karagkouni, T. Vergoulis, T. Dalamagas, and A. G. Hatzigeorgiou. 2015. DIANA-miRPath v3.0: Deciphering microRNA function with experimental support. Nucleic Acids Research 43 (W1):W460–W466. doi:10.1093/nar/gkv403.
- Wang, J. R., W. L. Huang, M. J. Tsai, K. T. Hsu, H. L. Huang, and S. Y. Ho. 2017. ESA-UbiSite: Accurate prediction of human ubiquitination sites by identifying a set of effective negatives. Bioinformatics 33 (5):661–68. doi:10.1093/bioinformatics/btw701.
- Wang, L., M. J. Zhu, A. M. Ren, H. F. Wu, W. M. Han, R. Y. Tan, and R. Q. Tu. 2014. A ten-microRNA signature identified from a genome-wide microRNA expression profiling in human epithelial ovarian cancer. PLoS One 9 (5):e96472. doi:10.1371/journal.pone.0096472.
- Yang, K., Y. Hou, A. Li, Z. Li, W. Wang, H. Xie, Z. Rong, G. Lou, and K. Li. 2017. Identification of a six-lncRNA signature associated with recurrence of ovarian cancer. Scientific Reports 7 (1):752. doi:10.1038/s41598-017-00763-y.
- Yu, X., X. Zhang, T. Bi, Y. Ding, J. Zhao, C. Wang, T. Jia, D. Han, G. Guo, B. Wang, et al. 2013. MiRNA expression signature for potentially predicting the prognosis of ovarian serous carcinoma. Tumour Biology: The Journal of the International Society for Oncodevelopmental Biology and Medicine 34 (6):3501–08. doi:10.1007/s13277-013-0928-3.
- Zhang, Y., J. Chen, Y. Wang, D. Wang, W. Cong, B. S. Lai, and Y. Zhao. 2019. Multilayer network analysis of miRNA and protein expression profiles in breast cancer patients. PLoS One 14 (4):e0202311. Published 2019 Apr 4. doi:10.1371/journal.pone.0202311.
- Zhang, Y., Q. Ye, J. He, P. Chen, J. Wan, J. Li, Y. Yang, and X. Li. 2020. Recurrence-associated multi-RNA signature to predict disease-free survival for ovarian cancer patients. BioMed Research International 2020:1618527. doi:10.1155/2020/1618527.
- Zhao, H., E. Guo, T. Hu, Q. Sun, J. Wu, X. Lin, D. Luo, C. Sun, C. Wang, B. Zhou, et al. 2016. KCNN4 and S100A14 act as predictors of recurrence in optimally debulked patients with serous ovarian cancer. Oncotarget 7. doi:10.18632/oncotarget.9721.
- Zhou, J., L. Li, L. Wang, X. Li, H. Xing, and L. Cheng. 2018. Establishment of a SVM classifier to predict recurrence of ovarian cancer. Molecular Medicine Reports 18 (4):3589–98. doi:10.3892/mmr.2018.9362.