
 ?Mathematical formulae have been encoded as MathML and are displayed in this HTML version using MathJax in order to improve their display. Uncheck the box to turn MathJax off. This feature requires Javascript. Click on a formula to zoom.
ABSTRACT
This paper presents a new hybrid PPSOGSA algorithm based on the phasor particle swarm optimization (PPSO) and gravitational search algorithm (GSA) for solving the Volt/VAr/THDv control optimization problem in radial distribution systems with non-linear loads. The PPSOGSA’s performance is analyzed and evaluated using the standard IEEE 30-bus radial distribution test system. The optimal solutions are obtained based on the following three optimization criteria: minimization of total active power losses, minimization of the voltage deviation, and a simultaneous minimization of total active power losses and voltage deviation. The voltage total harmonic distortion levels (THDv) are estimated using the decoupled harmonic power flow (DHPF) algorithm. Simulation results, obtained using the proposed PPSOGSA-based approach, are compared with those obtained using the other optimization algorithms such as PSO, PPSO, GSA, and PSOGSA. It is shown that the PPSOGSA-based approach has better performance in comparison to the other optimization techniques.
Introduction
The voltage and reactive power control or Volt/VAr control have been widely employed to reduce power losses and satisfy the main distribution system operational constraints such as voltage magnitude limits and line flow limits. Volt/VAr optimization implies the coordination of voltage regulating devices, such as the substation under load tap changer (ULTC) and distribution line voltage regulators (VRs), and VAr control devices, such as switched shunt capacitors (SSCs) and static VAr compensators (SVCs), of distribution systems in real time with aims to achieve one or more specified objectives (Radosavljević Citation2018). Integration of distributed generation (DG) in a distribution system, which can also be operated in Volt/VAr control mode, may significantly affect system performance. Depending on the available regulation resources, the control variables can be tap changer settings of ULTC and VRs, voltage magnitudes of DGs modeled as PV buses, and reactive powers of SSCs and SVCs. According to the available regulation devices, the control variables can be discrete (tap positions of ULTC and VRs, and number/size of capacitors) or continuous (voltage magnitudes and reactive power outputs of DGs, and reactive powers of SVCs).
In recent years, the widespread use of non-linear loads, such as adjustable speed drives and rectifiers, within the distribution system leads to power quality problems. One of the most important aspects of power quality is the presence of harmonics in the power system. High levels of THDV could lead to classical problems associated with harmonic distortion, such as equipment overheating, a reduction of efficiency in power generation, transmission and utilization, loss of reliability and communication interference. Although they do not generate harmonics, capacitors may have an important role in the propagation of harmonics in the systems. Addition of shunt capacitors in a harmonics polluted distribution system could lead to resonant conditions and increase the voltage distortion levels. In order to overcome these problems, in Volt/VAr control scheme it is necessary to take into consideration constraints which include voltage harmonic distortion limits in accordance with the IEEE-519 standard (Citation1993). However, taking harmonics into account, Volt/VAr control problem becomes more complicated and difficult to solve.
In its most general formulation, the optimal Volt/VAr control problem can be described as a non-linear large-scale static optimization problem with both continuous and discrete control variables. The optimal solution of this problem aims to optimize a chosen objective function through an optimal adjustment of the power system control variables, while various network operational constraints at different load levels are satisfied. The different optimization techniques, such as the genetic algorithm (GA) (Hu et al. Citation2003; Jashfar and Esmaeili Citation2014; Ulinuha, Masoum, and Islam Citation2011), evolutionary programming (Madureira and Lopes Citation2009), ant colony optimization (ACO) (Niknam Citation2008), gravitational search algorithm (GSA) (Wang et al. Citation2015) and particle swarm optimization (PSO) (Auchariyamet and Sirisumrannukul Citation2009; Chen et al. Citation2015) have been applied for finding an optimal solution for the Volt/VAr problem. In Hu et al. (Citation2003), the authors have presented a Volt/VAr control strategy to solve the off-line setting control problem by coordinating switching capacitors and ULTC setting at substations based on the day-ahead load forecast. In Ulinuha, Masoum, and Islam (Citation2011), the authors used a GA to perform load divisions and proposed a hybrid genetic-fuzzy algorithm to simultaneously control voltage profile, reactive power flow, and total harmonic distortion of distorted distribution systems. In another research by Jashfar and Esmaeili (Citation2014), the reactive power of photovoltaic systems is also scheduled and considered as an additional control variable. Madureira and Lopes (Citation2009) have proposed an artificial neural network (ANN) approach for coordinated voltage support in distribution networks with large integration of DGs and microgrids. The daily Volt/VAr control problem in distribution networks considering DGs with the objective of minimization of electrical energy costs is presented in (Niknam Citation2008). Wang et al. (Citation2015) suggested application of ULTC, capacitor banks, and DGs to the Volt/VAr control with the objective function of active power losses minimization. In Auchariyamet and Sirisumrannukul (Citation2009), the authors have proposed an optimal dispatch of the ULTC, substation capacitors, and feeder capacitors for Volt/VAr control. An efficient methodology for optimal Volt/VAr control of distribution networks with DGs based on fuzzy adaptive hybrid PSO is proposed in Chen et al. (Citation2015).
This paper proposes a new hybrid PPSOGSA method based on phasor particle swarm optimization (PPSO) (Ghasemi et al. Citation2018) and gravitational search algorithm (GSA) (Rashedi, Nezamabadi-pour, and Saryazdi Citation2009) to control voltage profile, reactive power flow, and total harmonic distortion of voltage (i.e. Volt/VAr/THDV control) in radial distribution systems with non-linear loads. The proposed method is tested on the distorted IEEE 30-bus test system, so that the optimal solutions are obtained for different objectives that reflect the reduction of active power losses and minimization of the voltage deviation. The THDv levels are estimated using the decoupled harmonic power flow (DHPF) method (Ulinuha and Masoum Citation2007). The results obtained by the proposed method are compared with PSO, PPSO, GSA, and PSOGSA. Also, in order to validate the accuracy of the DHPF method, simulation results are compared to those generated by the Harmonic Analysis module of the ETAP programme (Citation2014). These comparisons represent an additional contribution to the field of research.
Problem Formulation
In this paper, the goal of the optimal Volt/VAr/THDV control in a distribution system with non-linear loads is to find an optimal dispatch of ULTC positions, i.e., the values of the voltage on the secondary side of the transformer equipped with the ULTC, the voltage module values of DGs modeled as PV buses, i.e., the reactive power injections from DGs and values of reactive power of capacitors for each load level. Generally, this problem can be described as follows (Radosavljević Citation2018):
Subject to:
where F(x,u) is a scalar objective function, g(x,u) is a vector composed of equality constraints, h(x,u) is a vector composed of inequality constraints, x is a vector of dependent variables, u is a vector of control variables and U is a feasible space/region.
For a distribution system polluted by harmonics, having one power transformer with ULTC, Nbus buses, NL lines, NC capacitors and NDG DGs that operate as PV buses, the vector of control variables u consists of the tap position of the ULTC (TAPL), reactive power of capacitors () and voltage magnitude of DG units (
) for each load level L. Accordingly, the vector u can be expressed as
The vector of dependent variables x consists of the RMS bus voltages (), total harmonic voltage distortions (
), DGs reactive power outputs (
), and line loadings (
) for each load level L. Therefore, the vector x can be expressed as
Objective Functions
This paper considers three objective functions which are described below.
Minimization of the Total Active Power Losses
where is total active power losses for load level L,
is a component of transformer active power losses at frequency fh for load level L,
is a component of active power losses on line i at frequency fh for load level L, NL is the total number of lines and hmax is the maximum harmonic order under consideration.
Minimization of the Voltage Deviation
where is the voltage deviation for load level L and
is the rated operating voltage.
Simultaneous Minimization of the Total Active Power Losses and Voltage Deviation
where wP and wV are the weighting factors for the functions of active power losses and voltage deviation, respectively.
Problem Constraints
At the fundamental frequency, the equality constraints (2) relating to the active and reactive powers at bus i for each load level can be expressed as
where i= 1, … , Nbus is the bus number, L is the load level, and
are the fundamental active and reactive power generations at bus i for load level L,
and
are the fundamental active and reactive load demands at bus i for load level L,
is the fundamental voltage at bus j for load level L,
is the (i,j)th element of the fundamental admittance matrix corresponding to the ith row and the jth column for load level L,
is the angle of the (i,j)th element of the fundamental admittance matrix for load level L, and
and
are the fundamental voltage angles at the buses i and j for load level L, respectively. The backward-forward sweep (BFS) method (Cheng and Shirmohammadi Citation1995) was used to obtain the parameters of the considered distribution system at the fundamental frequency.
The equality constrains related to the harmonic power flow are defined as:
where is the system bus voltage vector at frequency fh for load level L,
is the system bus admittance matrix at frequency fh for load level L, and
is the system bus injected current vector at frequency fh for load level L. The DHPF method (Ulinuha and Masoum Citation2007) was used to estimate harmonic components.
The inequality constraints (3) include the bus voltage quality constraints of the system, DGs reactive power output limits and line flow limits for each load level. The values of bus voltage magnitudes are bounded by their lower (0.95 p.u.) and upper (1.05 p.u.) limits as follows:
where and
are the minimum and maximum bus voltage limits, respectively.
According to IEEE Std. 519–Citation1992 (1993), for distribution systems of 69 kV and below, the voltage total harmonic distortion must be lower than 5%, i.e.
where is the maximum acceptable level of the THDV at any bus i and load level L.
The constraints related to DGs reactive powers and power flows through network lines are:
where and
are the minimum and the maximum reactive power limits of the DG at bus i for load level L, while
denotes the maximum power flow in branch i.
The set of constraints (4) defines the feasible region of the problem control variables. In particular, in this case the control variables are the positions of the ULTC, the terminal voltages at PV buses, and reactive powers of capacitors. The constraints of the control variables are given as follows:
where TAPL is the ULTC tap position at load level L; TAPmin and TAPmax are the minimum and the maximum tap positions of the ULTC, respectively; and
are the minimum and the maximum voltage magnitudes of the DG at bus i;
and
are the minimum and the maximum reactive power limits of the capacitor at bus i, respectively.
Expanded Objective Function
The inequality constraints described by expression (3) are taken into account through quadratic penalty factors by means of which the objective function F is expanded in the following manner:
where Fe is the expanded objective function that will be minimized, λi is the corresponding penalty factor, p is the number of inequality constraints, is an upper or lower bound on dependent variable xi, which is defined by
if
, and
if
. The penalty factor of 103 is selected for all the inequality constraints.
The Hybrid PPSOGSA Algorithm
The proposed PPSOGSA approach, which is similar to PSOGSA (Mirjalili and Hashim Citation2010), hybridizes PPSO (Ghasemi et al. Citation2018) with GSA (Rashedi, Nezamabadi-pour, and Saryazdi Citation2009) in order to combine their strengths and overcome their shortcomings. The control parameters of PSOGSA c1 and c2, which are important for the ability to explore and converge, are fixed during iteration process and different combination values of these parameters provide good solutions for different problems. Instead of using fixed value of cl and c2, in this new hybrid PPSOGSA algorithm, the periodic nature of trigonometric sine and cosine functions is utilized to represent the control parameters through phase angle θ. By doing this, the velocity and position of the ith particle in each iteration are updated using the following equations:
where the phase angle of particle i (θi) is calculated for the next iterations through the following formula:
In (21) – (23), variables have the following meaning: i= 1, … , N is the agent number; Vi(t) and Xi(t) are the velocity and the position of agent i at iteration t, respectively; r1, r2, and r3 are random numbers between 0 and 1; aci(t) is the acceleration of agent i at iteration t and gbest(t) is the best position of all particles in the group at iteration t. The values of aci and gbest in EquationEquation (21)(21)
(21) are obtained as in Mirjalili and Hashim (Citation2010).
PPSOGSA Implementation
The control variables of the Volt/VAr/THDV control problem constitute the individual position of several agents that represent a complete solution set. In a system with N agents, the position of agent i is defined by
For each load level, the elements of Xi are the tap position of the ULTC, reactive power outputs of capacitors, and generator bus voltages. The different steps of the PPSOGSA-based approach for the considered optimization problem are the following:
1. Search space identification. Initialize PPSOGSA parameters: total number of agents (N), total number of iterations (tmax), initial value of the gravitational constant (G0), and user-specified constant (α).
2. Initialization: Randomly generate an initial population of N agents with their own phase angle through uniform distribution θi(0) = U(0, 2π), and with initial velocity within the velocity bound. The initial positions of each agent are randomly selected between the minimum and maximum values of the control variables.
3. Set the index of iteration t= 1.
4. For each particle in the population, run BFS power flow and DHPF to obtain the power losses, bus RMS voltages, and THDV values.
5. Calculate the fitness value for each agent. In this paper, three different objective functions are considered. Their fitness values are calculated according to EquationEquations (7)
(7)
6. Calculate accelerations for all agents.
7. Update the velocity and position of all agents by Equations (21) and (22), respectively.
8. If the stop criteria is satisfied (i.e. the maximum number of iterations is reached), go to step 9; otherwise, set iteration index t = t + 1, and return to step 4.
9. Return the best solution found. Print out the optimal solution (the best position and the corresponding fitness value) to the considered problem. Stop.
Results and Discussion
The proposed hybrid PPSOGSA-based approach to solve the optimal Volt/VAr/THDV control problem was evaluated using the IEEE 30-bus distorted radial distribution test system. The approach was implemented in MATLAB 2017b computing environment. To verify the simulation results and compare the performance of the proposed approach, the same problem was solved using PSO, PPSO, GSA, and PSOGSA. The setting parameters of these algorithms are adopted as follows: for PSO, c1 and c2 are set to 2 and the inertia weight (w) decreases linearly from 0.9 to 0.4 in each iteration; for GSA, α is set to 20 and G0 is set to 100; for the hybrid PSOGSA, c1 and c2 are set to 2, α is set to 20, and G0 is set to 1; for the hybrid PPSOGSA algorithm the parameters α and G0 are set up as well as for PSOGSA. The population size (N) and maximum number of iterations (tmax) are set to 30 and 100, respectively, for all case studies. All simulation data were obtained using a PC with a CPU at 2.70 GHz and 8.0 GB RAM. In order to demonstrate the effectiveness, robustness, and high-quality of the proposed hybrid PPSOGSA method, three different objectives were considered. For each function under consideration, 10 consecutive test runs have been performed and the results presented here represent the best values obtained over these 10 runs.
System data for the IEEE 30-bus test system can be found in Fuchs and Masoum (Citation2008). The base voltage and base power for this system are 23 kV and 100 MVA, respectively. The system equivalent impedance was determined from three-phase short-circuit power and reactance-to-resistance ratio at the utility connection point. These values are 1000 MVA and 22.2, respectively (Abu-Hashim et al. Citation1999). It is assumed that the ULTC is installed on the high-voltage side of the substation transformer winding. The ULTC has 17 possible positions and it can change the voltage from −5% to +5%, so each tap position is rated for a 0.625% voltage adjustment. The system includes one PWM adjustable-speed drive (ASD type 2) rated at 750 kW and 500 kVAr, and located at bus 7. Harmonic spectrum of this non-linear load is taken from (Ulinuha, Masoum, and Islam Citation2011). In addition, the system contains one linear DG unit which is directly connected to the grid and seven capacitors. The characteristics of DG, capacitors as well as the ULTC are given in .
Table 1. Settings of control variables in the IEEE 30-bus test system
At the fundamental frequency, 50% of the load of each bus is modeled as constant power load and the other 50% as constant impedance load. All capacitors are modeled as constant impedances. The DG connected at bus 8 has constant active power output of 5 MW, whereas operates in PV mode with reactive power output in the range of −4 to 4 MVAr. At harmonic frequencies, linear loads are represented by the parallel RL model (Abu-Hashim et al. Citation1999), and the non-linear load is treated as a decoupled harmonic current source. The linear DG produces no harmonics and can be represented by an inductive reactance. For this study, the equivalent reactance of the DG unit is the sub-transient reactance of 15%.
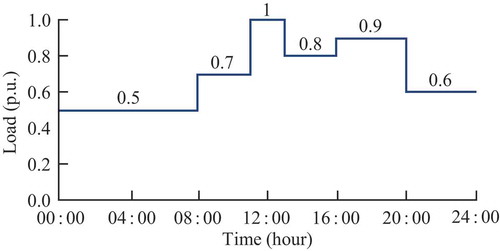
In this particular case, the aim of the optimal Volt/VAr/THDV control is to find the optimal dispatching schedule of the ULTC position, the optimal voltage at the PV bus, and optimum values of reactive power of capacitors for each load level in the daily load diagram, where the bus voltages and harmonic distortions are within the acceptable limits. The daily normalized load diagram of is used for all loads. The following cases are studied.
Figure 1. Daily load diagram
Case 1: The System Initial Condition without Control Scheme
To examine the impact of shunt capacitors and DG on the voltage profile, harmonic distortion and active power losses, three system conditions are analyzed herein. The first one, named Case 1a, represents a system condition in which all capacitors as well as the DG unit are turned off for all load levels. The second condition (Case 1b) refers to a condition in which all capacitors are turned on and generate their maximum reactive power, while DG is turned off for all load levels. The third condition (Case 1c) corresponds to a system condition that is similar to the second one, but DG is turned on and only generates its maximum active power. The tap position of the ULTC is fixed at 0 (that means the voltage at bus 1 is 1 p.u.) for all considered system conditions and load levels. Simulation results are shown in and . correspond to Case 1a, correspond to Case 1b, while correspond to Case 1c.
Table 2. Simulation results of the IEEE 30-bus system for all load levels in the case without control scheme
Figure 2. Simulation results obtained for Case 1a: (a) voltage profiles and (b) THDV levels
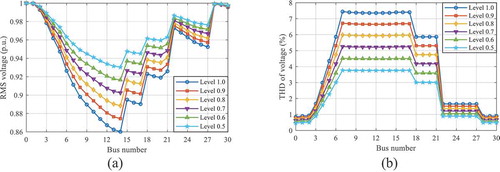
Figure 3. Simulation results obtained for Case 1b: (a) voltage profiles and (b) THDV levels
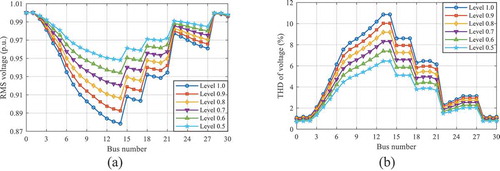
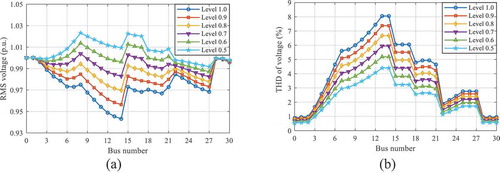
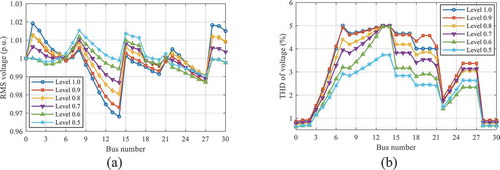
Figure 4. Simulation results obtained for Case 1c: (a) voltage profiles and (b) THDV levels
Based on the obtained results in , it can be seen that the most of the bus voltages violate the allowable voltage limit of 0.95 p.u. for all load levels. In addition, from it is evident that the THDV of some buses for load levels L= 0.7 to L= 1.0 exceeds the permissible value of 5%. In the case when all capacitors as well as the DG unit are turned off (Case 1a), the total active power losses for load levels of 0.5, 0.7, 1.0, 0.8, 0.9, and 0.6 are, respectively, 221.2802 kW, 436.1816 kW, 899.9744 kW, 571.5929 kW, 726.0636 kW, and 319.5034 kW, while the voltage deviations are, respectively, 1.0081 p.u., 1.4118 p.u., 2.0221 p.u., 1.6145 p.u., 1.8178 p.u., and 1.2097 p.u. The total system energy losses are 10,775.782 kWh.
From it can be observed that there is an improvement in voltage profile for all load levels when capacitors are turned on. In addition to improving voltage profile, the shunt capacitors reduce the power losses of the system, as can be seen from . However, the sizes and connection points of the connected capacitors lead to high THDV values in buses 6 to 21, as shown in . In relation to Case 1a, the maximum value of THDV increases 46% and reaches 10.87%. This increase in voltage distortion levels is due to resonant conditions caused by shunt capacitors in combination with the load and feeder reactances.
respectively show voltage profiles and voltage distortions in the presence of shunt capacitors and DG (Case 1c). Comparing the results from these figures with those from , it is evident that in the presence of DG the voltage profile is significantly improved and the maximum total harmonic distortion is reduced. However, if the DG is turned on, harmonic distortions in some buses will still be higher than the allowed value of 5%. In addition, from it can be observed that RMS voltage at buses 12, 13, and 14 for load level L= 1.0 is below the minimum acceptable level. The total system losses in this case are greatly reduced compared to that of Case 1b, and especially to Case 1a.
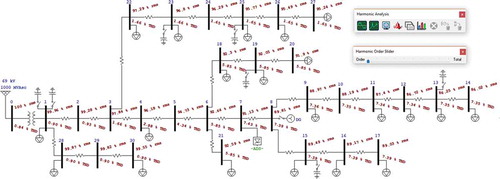
In order to demonstrate the accuracy of the DHPF method, which was used to estimate harmonic components, the power system harmonic analysis for Case 1a with a load level of 100% of the rated power (L= 1.0) was also performed using the Harmonic Analysis module of the Electrical Transient Analysis Program (ETAP) as shown in . By comparing results from with corresponding results from , it can be observed that results obtained by the DHPF method are almost identical to those generated by the ETAP programme.
Figure 5. ETAP simulation results obtained for the IEEE 30-bus test system in Case 1a with load level of 100% of the rated power
Case 2: The System Condition with Control Scheme
In order to demonstrate the effectiveness of the proposed algorithm, three different cases have been considered: (i) minimization of total active power losses (Case 2a), (ii) minimization of the voltage deviation (Case 2b), and (iii) a simultaneous minimization of the total active power losses and voltage deviation (Case 2c). Optimal dispatch scheduling results of the ULTC, capacitors, and DG for aforementioned objective functions obtained by the PPSOGSA are listed in , while the corresponding system parameters are shown in .
Table 3. Optimal settings of control variables in Case 2a
Table 4. Optimal settings of control variables in Case 2b
Table 5. Optimal settings of control variables in Case 2c
Table 6. System parameters for Case 2a
Table 7. System parameters for Case 2b
Table 8. System parameters for Case 2c
In Case 2a, the total active power losses for load levels of 0.5, 0.7, 1.0, 0.8, 0.9, and 0.6 are, respectively, 86.3439 kW, 117.5821 kW, 276.3345 kW, 155.9842 kW, 207.6395 kW, and 94.2094 kW – according to . By comparing these values with those obtained in Case 1a, it is clear that the minimization of losses as the objective in the Volt/VAr/THDV control problem for each load level results in the reduction in losses of about 70%. Also, by adjusting the control variables to the optimal values from , an improvement in the voltage profile is achieved for all load levels, except for the first.
Based on the comparison of the values of the voltage deviation from , obtained for Case 2b, with the corresponding values obtained in Case 1a, it can be seen that the voltage deviation for each load is reduced by about 90%. In relation to Case 2a, the voltage deviation for load levels of 0.5, 0.7, 1.0, 0.8, 0.9, and 0.6 is reduced by, respectively, 90.89%, 86.87%, 26.89%, 51.25%, 46.85%, and 89.41%, while the power losses are increased by, respectively, 94.55%, 2.74%, 16.94%, 11.59%, 32.87%, and 30.71%. From these results, it can be concluded that the minimization of the voltage deviation is in conflict with the minimization of losses. That means that satisfying one objective has opposite effect on the other objective.
By considering active power losses and voltage deviation as the objective function (Case 2c), the best compromise solutions obtained by the proposed PPSOGSA algorithm for the above-mentioned load levels are, respectively, 100.3808 kW, 120.6617 kW, 282.0423 kW, 156.5806 kW, 212.4251 kW, 101.0992 kW – for power losses, and 0.1395 p.u., 0.1492 p.u., 0.2912 p.u., 0.195 p.u., 0.2297 p.u., 0.141 p.u. – for the voltage deviation (see ). In relation to Case 1a, the average reductions in losses and deviation are 67.89% and 87.47%, respectively. For this objective function, for all load levels it is assumed that the weighting factors wP and wV are, respectively, equal to 1 and 300.
The voltage profiles and THDV values in the system for considered objective functions are shown in .
Figure 6. Simulation results obtained for Case 2a: (a) voltage profiles and (b) THDV levels
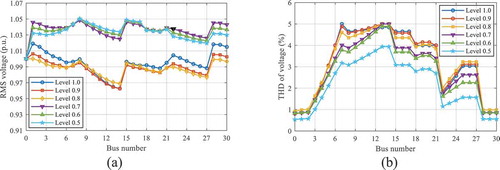
Figure 7. Simulation results obtained for Case 2b: (a) voltage profiles and (b) THDV levels
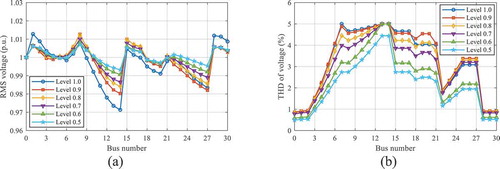
Figure 8. Simulation results obtained for Case 2c: (a) voltage profiles and (b) THDV levels
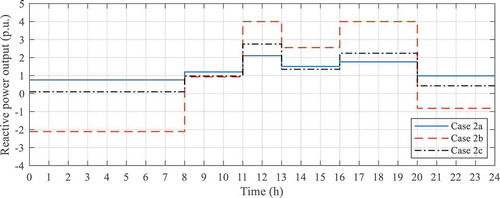
From and , it can be observed that the maximum and minimum values of calculated bus voltage magnitudes (max. VRMS and min. VRMS), as well as the maximum values of THDV for all load levels meet the limits defined in the IEEE Std. 519–Citation1992 (1993). Reactive power output of the DG in the form of daily diagram is shown in .
Figure 9. Reactive power output of the DG for three different optimization cases
To verify the accuracy and efficiency of the proposed PPSOGSA algorithm, the results obtained for Case 2a and Case 2b are compared to those generated by using PSO, PPSO, GSA, and PSOGSA, as reported in . Each algorithm was run 10 times for each of objective functions and each of load levels. Based on these results it is clear that the PPSOGSA has better performance in comparison to the other algorithms.
Table 9. Performance of PSO, PPSO, GSA, PSOGSA, and PPSOGSA in Case 2a
Table 10. Performance of PSO, PPSO, GSA, PSOGSA, and PPSOGSA in Case 2b
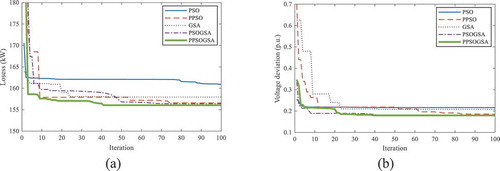
The convergence of the algorithms for the power losses minimization and voltage deviation minimization at the load level of 0.8 is shown in , respectively. It is clear that the proposed hybrid PPSOGSA algorithm can converge to its global optimal solutions in lower iterations compared to other algorithms used by the authors. From the aspect of running, the running time of the PPSOGSA-based approach is slightly longer for any optimization function and any load level. The average running time of one iteration for the hybrid PPSOGSA algorithm in the case of minimization of power losses was about 1 min.
Figure 10. Convergence profiles of different algorithms for the IEEE 30-bus test system in the case of (a) minimization of the power losses, and (b) minimization of the voltage deviation
Conclusions
The main conclusions that can be drawn from the presented results and discussion of them are:
The results obtained using the hybrid PPSOGSA algorithm are in accordance with the considered objective functions and all the specified constraints are met.
It is shown that the performance of the system can be significantly improved in terms of reducing power losses and improving power quality by proper adjustment of control variables.
By comparing the results obtained using the PPSOGSA algorithm with those obtained using the PSO, PPSO, GSA, and PSOGSA optimization algorithms, it is found that the PPSOGSA algorithm provides better solutions than the previous algorithms.
The accuracy of the DHPF method which was used to estimate harmonic components is successfully verified using the ETAP programme.
Regardless of the form of the objective function, the proposed PPSOGSA algorithm can be quickly and easily applied to any other system with linear and non-linear loads.
Additional information
Funding
References
- Abu-Hashim, -R.-R., B. G. Chang, M. Grady, E. Gunther, M. Halpin, C. Harziadonin, Y. Liu, M. Marz, T. Ortmeyer, et al. 1999. Test systems for harmonics modeling and simulation. IEEE Transactions on Power Delivery 14:579–87. doi:10.1109/61.754106.
- Auchariyamet, S., and S. Sirisumrannukul. 2009. Optimal dispatch of ULTC and capacitors for volt/var control in distribution system with harmonic consideration by particle swarm approach. In Proceedings of the International Conference on Sustainable Power Generation and Supply, 1–7. doi:10.1109/SUPERGEN.2009.5348357.
- Chen, S., W. Hu, C. Su, X. Zhang, and Z. Chen. 2015. Optimal reactive power and voltage control in distribution networks with distributed generators by fuzzy adaptive hybrid particle swarm optimization method. IET Generation, Transmission & Distribution 9:1096–103. doi:10.1049/iet-gtd.2014.1059.
- Cheng, C.-S., and D. Shirmohammadi. 1995. A three-phase power flow method for real-time distribution system analysis. IEEE Transactions on Power Systems 10:671–79. doi:10.1109/59.387902.
- ETAP (version 12.6) user guide. 2014. Operation Technology, Inc.
- Fuchs, E., and M.-A.-S. Masoum. 2008. Power quality in power systems and electrical machines. 1st ed. USA: Elsevier.
- Ghasemi, M., E. Akbari, A. Rahimnejad, S.-E. Razavi, S. Ghavidel, and L. Li. 2018. Phasor particle swarm optimization: A simple and efficient variant of PSO. Soft Computing 1–18. doi:10.1007/s00500-018-3536-8.
- Hu, Z., X. Wang, H. Chen, and G.-A. Taylor. 2003. Volt/Var control in distribution systems using a time-interval based approach. IEE Proceedings - Generation, Transmission and Distribution 150:548–54. doi:10.1049/ip-gtd:20030562.
- IEEE Std. 519–1992. 1993. IEEE recommended practices and requirements for harmonic control in electrical power systems.
- Jashfar, S., and S. Esmaeili. 2014. Volt/var/THD control in distribution networks considering reactive power capability of solar energy conversion. Electrical Power and Energy Systems 60:221–33. doi:10.1016/j.ijepes.2014.02.038.
- Madureira, A.-G., and J.-A.-P. Lopes. 2009. Coordinated voltage support in distribution networks with distributed generation and microgrids. IET Renewable Power Generation 3:439–54. doi:10.1049/iet-rpg.2008.0064.
- Mirjalili, S., and S.-Z.-M. Hashim. 2010. A new hybrid PSOGSA algorithm for function optimization. In Proceedings of the International Conference on Computer and Information Application (ICCIA 2010), 374–77. doi:10.1109/ICCIA.2010.6141614.
- Niknam, T. 2008. A new approach based on ant colony optimization for daily Volt/Var control in distribution networks considering distributed generators. Energy Conversion and Management 49:3417–24. doi:10.1016/j.enconman.2008.08.015.
- Radosavljević, J. 2018. Metaheuristic optimization in power engineering. 1st ed. London: The Institution of Engineering and Technology (IET).
- Rashedi, E., H. Nezamabadi-pour, and S. Saryazdi. 2009. GSA: A gravitational search algorithm. Information Sciences 179:2232–48. doi:10.1016/j.ins.2009.03.004.
- Ulinuha, A., and M.-A.-S. Masoum. 2007. Harmonic power flow calculations for a large power system with multiple nonlinear loads using decouple approach. In Proceedings of the Australasian Universities Power Engineering Conference 1–6. doi:10.1109/AUPEC.2007.4548132.
- Ulinuha, A., M.-A.-S. Masoum, and S. Islam. 2011. Hybrid genetic-fuzzy algorithm for volt/var/total harmonic distortion control of distribution systems with high penetration of non-linear loads. IET Generation, Transmission & Distribution 5:425–39. doi:10.1049/iet-gtd.2010.0168.
- Wang, S., N. Wang, Q. Wang, Y. Yang, and G. Huang. 2015. Reactive power optimization in distribution network by using improved gravitational search algorithm. In Proceedings of 5th International Conference on Electric Utility Deregulation and Restructuring and Power Technologies (DRPT), 178–82. doi:10.1109/DRPT.2015.7432240.