
 ?Mathematical formulae have been encoded as MathML and are displayed in this HTML version using MathJax in order to improve their display. Uncheck the box to turn MathJax off. This feature requires Javascript. Click on a formula to zoom.
ABSTRACT
Ensemble learning combines base classifiers to improve the performance of the models and obtains a higher classification accuracy than a single classifier. We propose a multi-classification method to predict the level of grant for each college student based on feature integration and ensemble learning. It extracted from expense, score, in/out dormitory, book loan conditions of 10885 students’ daily behavior data and constructed a 21-dimensional feature. The ensemble learning method integrated gradient boosting decision tree, random forest, AdaBoost, and Support Vector Machine classifiers for college grant classification. The proposed method is evaluated with 10885 students set and experiments show that the proposed method has an average accuracy of 0.954 5 and can be used as an effective means of assisting decision-making for college student grants.
Introduction
With the reform of the Chinese higher education system and the expansion of the scale of higher education, the students from poor families in colleges and universities, as a group, are becoming increasingly large. Identifying potential real poverty students has been at the center of much attention. According to the report on the development of Chinese student grants in 2019, various policies and measures set up by the government, universities, and the society in 2019 funded 48.176 million students from ordinary institutions of higher learning nationwide, with a total amount of 131.69 billion RMB. The amount of subsidies for colleges and universities increased by 10.787 billion RMB over the previous year, an increase of 12.72%. In the process of students’ shopping, living, daily life, entertainment, and education, the use of various data terminals and the application of various systems will generate huge amounts of data. After years of development, the campus all-in-one card system has become more and more widely applied. Through effective integration and optimization of various resources, the effective allocation and full utilization of resources have been realized. At the same time, the amount of data stored in the database is growing at an amazing speed. As users expect to obtain more detailed information from the data, which is conducive to the management of students. Through the statistics, analysis, and mining of the data of each stage, the campus resources and information are highly concentrated and integrated (Asif et al. Citation2017; Baker Citation2014; Dutti, Ismaili, and Herawani Citation2017; Gomez-Rey, Fernandez-Navarro, and Barbera Citation2016; Pena-Ayala Citation2014; Ramos et al. Citation2016).
In various real-world applications, the class distribution is imbalanced. This is defined as the class imbalance problem. One class (i.e. the majority class) has a large number of examples, whereas the other (i.e. the minority class) has only a few (Bi and Zhang Citation2018; Guo et al. Citation2017). Classification algorithms tend to classify the examples as the majority class and predict the minority class inaccurately, which is very important that in many real applications (Dong et al. Citation2020).
The yearly grant amount of each student is a set of money amount G = {0, 1000, 1500, 2000}, which means a classification problem with four different categories. In the G, the 0 means that the student did not get any grant, while the other values mean that the student has gained that amount of the grant from the government. As is shown in , the proportion of un-granted students is as high as 85%. Thus, the data is imbalanced. The un-granted class is the majority class, while the other three classes are the minority class. The proportion of students in each category is imbalanced. According to the daily behavior data from the student’s card, the student’s grant is predicted. Therefore, this problem can be regarded as a problem of multi-class data imbalance classification.
Figure 1. Distribution of college student grants
In this study, the aim of the present paper is to assess the importance of features in predicting the grants of college students and develop an ensemble model, which balances accuracy in the process of predicting the category of student grants.
The mainstream machine learning algorithms usually assume that the data set used for training is balanced, that is, the number of examples contained in each type is roughly equal. Training the grant prediction model on an imbalanced data set, common classification algorithms tend to predict the examples as the majority class, and the classification performance of the minority class is reduced. The imbalanced data classification problem has become one of the research hotspots in the field of machine learning. In the literature, there are many strategies proposed for solving the imbalanced data classification problem, which can be generally divided into two basic categories: the data level and the algorithm level (Diez-Pastor et al. Citation2015; Krawczyk, Wozniak, and Schaefer Citation2014; Lim, Goh, and Tan Citation2017; Wang, Minku, and Yao Citation2015; Yu and Ni 2014).
Resampling strategies are often employed to rebalance the sample space at the data level, which can be categorized into under-sampling and over-sampling. Under-sampling randomly decreases the majority class examples and may lose useful information, while over-sampling increases the minority class examples and may increase the risk of overfitting (Santos et al. Citation2018).
At algorithm level, common methods include cost-sensitive learning, ensemble methods, kernel methods, single-class learning methods, and support vector machines (Liu and Zio Citation2019).
Ensemble methods, also called multiple classifier systems, have become a popular method for data imbalance classification. Ensemble methods boost several weak learners to strong learners to outperform every independent one (Dong et al. Citation2020; Mirza, Lin, and Liu Citation2015; Zhou Citation2012; Heinermann and Kramer 2016; Krawcyzk et al. 2017; Zhang et al. 2018). The advantages of adopting boosting for data imbalance classification are: (1) the model can avoid overfitting by combining multiple base classifiers; (2) ensemble methods can combine re-sampling techniques to avoid additional learning costs.
Boosting is the most popular method for ensemble learning. AdaBoost, proposed by Freund and Schapire (Citation1996), has several extensions: AdaBoost.M1, AdaBoost.M2, AdaBoost.MR and AdaBoost.MH (Freund and Schapire Citation1996, Citation1999). Gradient Boosting Decision Tree (GBDT) (Friedman Citation2001) is also one of the typical iterative ensemble methods. Boosting has been also applied in a variety of fields, such as social networks, multi-agent systems (Guo et al. 2016; Li et al. Citation2021; Sun Citation2019; Yang et al. Citation2020; Zhang, Li, and Li Citation2019; Zhou et al. Citation2020). Most ensemble models have combined re-sampling and cost-sensitive strategies.
In our study, the students’ daily behavior data and on-campus one-card can truly reflect the students’ economic situation and serves as training data. A 21-dimensional feature was constructed by extracting from students’ consumption data, borrowing data, access to the dormitory library, and other data. The GBDT method was adopted to adjust the weight of different features each time according to the misclassification rate to obtain a set of weak classifiers. Common classification algorithms, such as Random Forest (RF) (Breiman Citation2001), Support Vector Machine (SVM), K nearest neighbor (KNN), etc., were used to get another set of weak classifiers. Finally, the two sets of weak classifiers were combined into a strong classifier to predict the financial grant of the testing samples (Claesen et al. Citation2014; Farid et al. 2014; Guo et al. Citation2017; Tao et al. Citation2019; Wozniak, Grana, and Corchado Citation2014; Yao et al. Citation2016).
The main contributions of this work can be summarized as follows.
An imbalance multi-classification method based on feature integration and ensemble learning is proposed, which predicts the level of grant for each college student. First, we studied the feature importance and sorted the features by importance. Then, we studied which ensemble rule performs better with six representative classification algorithms. After that, we use the majority vote ensemble rule to combine the results of these single classifiers. Ensemble learning was adopted as searching optimal solutions to obtain satisfactory prediction accuracy. Finally, we compared our method with six different types of classification algorithms including SVM, shallow neural network (NN), KNN, RF, AdaBoost (Ada), and GBDT. The experimental results demonstrate that our method is usually more effective than the other six single classifiers on all the three accuracy measures.
The remainder of this paper is organized as follows. In the first part, the raw data is analyzed and feature of students’ behavior data is extracted. In the second part, we describe and explain the proposed method based on ensemble learning. The third part discusses the detailed experimental setup and provides a comparison against SVM, NN, KNN, RF, Ada, and GBDT. Finally, the last part gives a conclusion.
Data Analysis and Feature Extraction of Students’ Daily Behavior
Student Daily Behavior Data Set
The raw data is obtained by a university in 2014 and 2015, which includes the campus card consumption, dormitory entry record, library access, book borrowing, and score information.
To begin this process, we divide the data into two parts: training data and testing data. The training data have 10885 rows, containing real grant for each student. shows the properties of the training data set, including the name of each table, the number of total samples, the total attributes. The testing data set has no grant amount and contains only student id, and there are 10,783 samples. Two parts of data on student id do not intersect. Our aim is to predict grants for testing data.
Table 1. Description of datasets used in this study
Student Grant-related Factors Analysis
The granting of financial aid should take into account the factors of student performance. The student score data table includes score_train.txt and score_test.txt. The score table contains student id, faculty id, and ranking. There are 19 faculties and the number of total students, training, and testing students in each faculty are shown in . To extract the performance feature, the training process on the score table data was performed several times. provides the processed statistical features in score data.
Table 2. Statistical features in score data
Figure 2. Number of total students and granted students in each faculty
Classification Model of College Students Grant
Preprocessing
Given raw data, it is first preprocessed by feature engineering techniques. First, noisy and incorrect data are cleaned up. For example, student card consumption records sometimes appear negative value. Second, missing values are imputed. Missing values are imputed according to their different properties. For example, if the student does not have any consumption records, it is filled with −1. Zero is filled when the student has consumption records in other times. Finally, the data are standardized.
After the standardization, data balancing is dealt with. The students' grant data consist of 10,885 observations, in which 9325 students receive no grant, 741 students receive 1000 RMB grant, 465 students receive 1500 RMB grant, and the remaining 354 receive 2000 RMB grant. Owing to the imbalance of the data sample, we increase the samples funded by 1000, 1500, and 2000 RMB by 5, 8, and 10 times, respectively. The data in each class after oversampling were distributed at 9325, 4446, 4185, and 3894. Then, new balanced data are obtained. Next, we perform a fivefold stratified cross-validation. The training set is divided into five stratified subsets: CV0, CV1, … , CV4. In each fold testing, taking one of them as the testing set and the rest of the data as the training set can greatly improve the stability of CV (cross-validation).
The Proposed Model
Past researchers have shown that bagging and boosting algorithms work well in building ensemble classifiers. Therefore, GBDT and Ada, two extended algorithms, are adopted in our model. Besides, four widely used machine learning algorithms, SVM, NN, KNN, and RF are also used. Nine single classifiers in total are adopted for the ensemble model. We build one classifier set using single classifiers SVM, NN, and KNN. Meanwhile, the other classifier set is built based on decision tree algorithms including RF, Ada, and GBDT. The final model combines the two set to predict the college grant, shown in .
Figure 3. Prediction model of grant
As feature extraction is the input of our model, features decide the upper boundary of our model performance. GBDT can output feature importance, and set feature id according to feature importance. We first divide features into five feature subsets by id%5. Then, we randomly divide all features into five subsets. And the two sets of feature subsets are combined into 10 different models. The two sets of subsets are combined into 10 feature subsets. All base classifiers are integrated through a three-level stacking approach, as shown in . In level 0, we generate 10 base classifiers by using 10 feature subsets. Since the classifiers at level 0 are the same, the votes of the base classifiers are the same. The classifiers in level 1 take the 0th layer output as input and adopt the maximum vote algorithm to predict the output. Voting is the most popular and fundamental combination method. In level 2, we take voting to combine different classifiers. The model with high accuracy has high voting, and the voting of different models is GBDT1: GBDT2: GBDT3: RF: Ada: SVM = 2:0.5:0.5:1.5:1.5:1.
Figure 4. Model integration level
Experiment and Results
After feature engineering, the data set is split into training data, validation data, and testing data. The training data consist of 10,885 observations, which contain a real financial grant. The testing data contain only students’ id and has 10,783 samples. The student id of the two parts of the data does not intersect. We aim to predict each student grants for testing data and finally evaluate the prediction results.
Model Evaluation Metrics
In order to evaluate classification accuracy, we used three metrics including precision, recall, F1-score. Micro-averages gives the same weight to every class. Macro-averages compute the average for every class and was used in our study.
The following formulas describe calculating the precision and the recall rate for each class {0, 1000, 1500, 2000}, thereby calculating the sub-class F1i.
The macro-averages of precision, recall, and F1 are defined as follows:
where m = number of classes, Ni = the number of students in class i, N = the total number of students, tp = true positive, fp = false positive, and fn = false negative.
Prediction on GBDT Model
Feature Screening and Sorting
In general, the more effective features, the better, but not all features are positive, and the addition of some features will reduce the prediction accuracy (Cai et al. Citation2015; Liu, Du, and Tan Citation2014). For example, entering the dormitory at night to join the training, but the accuracy is reduced. After training borrow_train.txt and borrow_test.txt, it was found that most of the granted students did not borrow books, so we removed the borrowing books feature from the feature list. Firstly, we measure the goodness of each feature. By analysis of feature importance in the GBDT classifier, the feature importance is shown in .
Figure 5. Feature importance in GBDT classifier
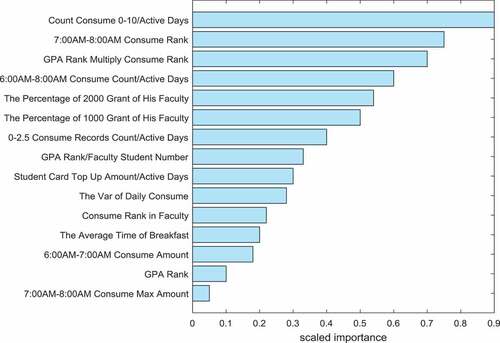
Next, we rank the features according to the importance. Then, we select the top k good features and delete the features of low importance. After removing the feature, we re-train the model on the validation set and check if the F1 score rises. After experiments, we delete the features including users borrowing books in different categories, the colleges the users are in, daily consumption from Monday to Friday.
Prediction Model Based on GBDT
We extract 14 feature subsets to generate the GBDT1 model, and the prediction accuracy is shown in .
Table 3. GBDT1 model evaluation result
GBDT2 model is built on all the features, and the prediction result is shown in .
Table 4. GBDT2 model evaluation result
Generally speaking, features are not all positive. The introduction of some features will bring negative effects and affect the evaluation of achievements. For example, the features such as entering and leaving the dormitory in the middle of the night have led to a sharp decline in performance. The features were screened according to the importance of the features, and the GBDT3 model is constructed. The results of the model evaluation are shown in .
Table 5. GBDT3 model evaluation result
We build different GBDT models and compare the prediction results in . It can be seen that feature selection has a direct impact on the prediction results. As we can see, the improvement of the GBDT3 model is quite successful, and GBDT3 can obtain better classification performance with feature selection than GBDT1.
Parameters in GBDT
We adopt grid search and greedy coordinate descent to tune seven parameters of the GBDT model. Greedy coordinate descent means to tune parameters in turn according to their importance to the GBDT algorithm. It is hard to grid search all possible combinations of the seven parameters. Experiments show that sample_weight is the most important parameter. Hence, we first tune this parameter. Then, we use grid search to tune max_depth and min_samples_leaf at the same time. Next, min_sample_split and max_features are tuned in turn. Finally, we grid search learning_rate and n_estimators to obtain parameters. Parameters of min_sample_split and min_sample_leaf have a similar function of avoiding overfitting.
Comparison and Analysis of Different Models
To provide a picture about the performance difference of these six classification algorithms, we firstly rank these six methods for each base classifier according to the accuracy. Firstly, the performance of the six classifiers are evaluated as shown in . From , we observe that GBDT, Ada, SVM, are the best base classifiers among the six tested in accuracy. Secondly, the base classifiers are selected. We build different models based on common classifiers such as SVM, RF, NN, KNN, and Ada. reveals the precision of these different models.
Figure 6. A comparison of precision in learning algorithm
We observe that two combinations outperform single base classifiers significantly. This means that our proposed method is able to improve the performance of base classifiers, and it performs better than these six classification algorithms. We find that two combinations with SVM and GBDT perform better than the SVM and GBDT in terms of accuracy.
After experiments, when GBDT1: GBDT2: GBDT3: Ada: RF: SVM ratio is 2:0.5:0.5:1.5:1:1, we can achieve better prediction accuracy 0.954 5 shown as .
Figure 7. Comparisons of different learning models
Conclusion
In this study, we propose a novel college student grant prediction model based on feature integration and ensemble learning. Features are extracted from college students’ consumption, performance, library borrowing, and other data. It is found that classification accuracy is degraded with too less or too many features. And feature importance selection can achieve high classification accuracy. When the base classifiers have large differences the classification accuracy can be greatly improved by ensemble learning. Fusion with only the strong classifiers Ada or GBDT will encounter overfitting because our training data are not large enough. Experiments confirm that decision tree algorithms based on ensemble learning show better classification performance than non-integrated methods such as SVM, KNN. Combination educational domain knowledge with machine learning algorithms should be studied in further studies.
Additional information
Funding
References
- Asif, R., A. Merceron, S. A. Ali, and N. G. Haider. 2017. Analyzing undergraduate students’ performance using educational data mining. Computers & Education 113:177–94. doi:10.1016/j.compedu.2017.05.007.
- Baker, R. S. 2014. Educational data mining: An advance for intelligent systems in education. IEEE Intelligent Systems 29 (3):78–82. doi:10.1109/mis.2014.42.
- Bi, J. J., and C. S. Zhang. 2018. An empirical comparison on state-of-the-art multi-class imbalance learning algorithms and a new diversified ensemble learning scheme. Knowledge-Based Systems 158:81–93. doi:10.1016/j.knosys.2018.05.037.
- Breiman, L. 2001. Random forests. Machine Learning 45 (1):5–32. doi:10.1023/A:1010933404324.
- Cai, Z. H., D. Xu, Q. Zhang, J. X. Zhang, S. M. Ngai, and J. L. Shao. 2015. Classification of lung cancer using ensemble-based feature selection and machine learning methods. Molecular bioSystems 11 (3):791–800. doi:10.1039/c4mb00659c.
- Claesen, M., F. De Smet, J. A. K. Suykens, and B. De Moor. 2014. EnsembleSVM: A library for ensemble learning using support vector machines. Journal of Machine Learning Research 15:141–45.
- Diez-Pastor, J. F., J. J. Rodriguez, C. I. Garcia-Osorio, and L. I. Kuncheva. 2015. Diversity techniques improve the performance of the best imbalance learning ensembles. Information Sciences 325:98–117. doi:10.1016/j.ins.2015.07.025.
- Dong, X. B., Z. W. Yu, W. M. Cao, Y. F. Shi, and Q. L. Ma. 2020. A survey on ensemble learning. Frontiers of Computer Science 14 (2):241–58. doi:10.1007/s11704-019-8208-z.
- Dutti, A., M. A. Ismaili, and T. Herawani. 2017. A systematic review on educational data mining. IEEE Access 5:15991–6005. doi:10.1109/access.2017.2654247.
- Farid, D. M., L. Zhang, C. M. Rahman, M. A. Hossain, and R. Strachan. 2014. Hybrid decision tree and naive Bayes classifiers for multi-class classification tasks. Expert Systems with Applications 41 (4):1937–46. doi:10.1016/j.eswa.2013.08.089.
- Freund, Y., and R. E. Schapire. 1996. Experiments with a new boosting algorithm. International Conference on Machine Learning 96:148–56.
- Freund, Y., and R. E. Schapire. 1999. A decision-theoretic generalization of on-line learning and an application to boosting. Journal of Computer and System Sciences 55 (1):119–39. doi:10.1006/jcss.1997.1504.
- Friedman, J. H. 2001. Greedy function approximation: A gradient boosting machine. Annals of Statistics 29 (5):1189–232. doi:10.1214/aos/1013203451.
- Gomez-Rey, P., F. Fernandez-Navarro, and E. Barbera. 2016. Ordinal regression by a gravitational model in the field of educational data mining. Expert Systems 33 (2):161–75. doi:10.1111/exsy.12138.
- Guo, H. X., Y. J. Li, Y. A. Li, X. Liu, and J. L. Li. 2016. BPSO-Adaboost-KNN ensemble learning algorithm for multi-class imbalanced data classification. Engineering Applications of Artificial Intelligence 49:176–93. doi:10.1016/j.engappai.2015.09.011.
- Guo, H. X., Y. J. Li, J. Shang, M. Y. Gu, Y. Y. Huang, and G. Bing. 2017. Learning from class-imbalanced data: Review of methods and applications. Expert Systems with Applications 73:220–39. doi:10.1016/j.eswa.2016.12.035.
- Heinermann, J., and O. Kramer. 2016. Machine learning ensembles for wind power prediction. Renewable Energy 89:671–79. doi:10.1016/j.renene.2015.11.073.
- Krawczyk, B., L. L. Minku, J. Gama, J. Stefanowski, and M. Wozniak. 2017. Ensemble learning for data stream analysis: A survey. Information Fusion 37:132–56. doi:10.1016/j.inffus.2017.02.004.
- Krawczyk, B., M. Wozniak, and G. Schaefer. 2014. Cost-sensitive decision tree ensembles for effective imbalanced classification. Applied Soft Computing 14:554–62. doi:10.1016/j.asoc.2013.08.014.
- Li, X., Z. H. Yu, Z. W. Li, and N. Q. Wu. 2021. Group consensus via pinning control for a class of heterogeneous multi-agent systems with input constraints. Information Sciences 542:247–62. doi:10.1016/j.ins.2020.05.085.
- Lim, P., C. K. Goh, and K. C. Tan. 2017. Evolutionary cluster-based synthetic oversampling ensemble (ECO-Ensemble) for imbalance learning. IEEE Transactions on Cybernetics 47 (9):2850–61. doi:10.1109/tcyb.2016.2579658.
- Liu, J., and E. Zio. 2019. Integration of feature vector selection and support vector machine for classification of imbalanced data. Applied Soft Computing 75:702–11. doi:10.1016/j.asoc.2018.11.045.
- Liu, P., P. J. Du, and K. Tan. 2014. A novel remotely sensed image classification based on ensemble learning and feature integration. Journal of Infrared and Millimeter Waves 33 (3):311–17.
- Mirza, B., Z. P. Lin, and N. Liu. 2015. Ensemble of subset online sequential extreme learning machine for class imbalance and concept drift. Neurocomputing 149:316–29. doi:10.1016/j.neucom.2014.03.075.
- Pena-Ayala, A. 2014. Educational data mining: A survey and a data mining-based analysis of recent works. Expert Systems with Applications 41 (4):1432–62. doi:10.1016/j.eswa.2013.08.042.
- Ramos, J. L. C., R. E. D. Silva, R. L. Rodrigues, J. C. S. Silva, and A. S. Gomes. 2016. A comparative study between clustering methods in educational data mining. IEEE Latin America Transactions 14 (8):3755–61. doi:10.1109/TLA.2016.7786360.
- Santos, M. S., J. P. Soares, P. H. Abreu, H. Araujo, and J. Santos. 2018. Cross-validation for imbalanced datasets: Avoiding overoptimistic and overfitting approaches. IEEE Computational Intelligence Magazine 13 (4):59–76. doi:10.1109/mci.2018.2866730.
- Sun, Y. 2019. Analysis for center deviation of circular target under perspective projection. Engineering Computations 36 (7):2403–13. doi:10.1108/EC-09-2018-0431.
- Tao, X. M., Q. Li, W. J. Guo, C. Ren, C. X. Li, R. Liu, and J. R. Zou. 2019. Self-adaptive cost weights-based support vector machine cost-sensitive ensemble for imbalanced data classification. Information Sciences 487:31–56. doi:10.1016/j.ins.2019.02.062.
- Wang, S., L. L. Minku, and X. Yao. 2015. Resampling-based ensemble methods for online class imbalance learning. IEEE Transactions on Knowledge and Data Engineering 27 (5):1356–68. doi:10.1109/tkde.2014.2345380.
- Wozniak, M., M. Grana, and E. Corchado. 2014. A survey of multiple classifier systems as hybrid systems. Information Fusion 16:3–17. doi:10.1016/j.inffus.2013.04.006.
- Yang, L., Z. H. Yu, M. A. El-Meligy, A. M. El-Sherbeeny, and N. Q. Wu. 2020. On multiplexity-aware influence spread in social networks. IEEE Access 8:106705–13. doi:10.1109/ACCESS.2020.2999312.
- Yao, G., H. L. Zeng, F. Chao, C. Su, C. M. Lin, and C. L. Zhou. 2016. Integration of classifier diversity measures for feature selection-based classifier ensemble reduction. Soft Computing 20 (8):2995–3005. doi:10.1007/s00500-015-1927-7.
- Yu, H. L., and J. Ni. 2014. An improved ensemble learning method for classifying high-dimensional and imbalanced biomedicine data. IEEE-ACM Transactions on Computational Biology and Bioinformatics 11 (4):657–66. doi:10.1109/tcbb.2014.2306838.
- Zhang, H. T., H. L. He, and W. Y. Zhang. 2018. Classifier selection and clustering with fuzzy assignment in ensemble model for credit scoring. Neurocomputing 316:210–21. doi:10.1016/j.neucom.2018.07.070.
- Zhang, J., Z. L. Li, and H. A. Li. 2019. A novel sketch-based medical 3D model retrieval approach by multi-scale weighted Gabor feature fusion and IP-HOG feature extraction. Journal of Medical Imaging and Health Informatics 9 (4):788–800. doi:10.1166/jmihi.2019.2610.
- Zhou, S., Z. H. Yu, E. S. A. Nasr, H. A. Mahmoud, E. M. Awwad, and N. Q. Wu. 2020. Homomorphic encryption of supervisory control systems using automata. IEEE Access 8:147185–98. doi:10.1109/ACCESS.2020.3014217.
- Zhou, Z. H. 2012. Ensemble methods: Foundations and algorithms. Horsham, PA/USA: Chapman & Hall/CRC.