
ABSTRACT
In the era of globalization, student placement is very challenging issue for all educational institutions. For engineering institutions, placement is a key factor to maintain good ranking in the university as well as in other national and international ranking agencies. In this paper, we have proposed a few supervised machine learning classifiers which may be used to predict the placement of a student in the IT industry based on their academic performance in class Tenth, Twelve, Graduation, and Backlog till date in Graduation. We also compare the results of different proposed classifiers. Various parameters used to compare and analyze the results of different developed classifiers are accuracy score, percentage accuracy score, confusion matrix, heatmap, and classification report. Classification report generated by developed classifiers consists of parameters precision, recall, f1-score, and support. The classification algorithms Support Vector Machine, Gaussian Naive Bayes, K-Nearest Neighbor, Random Forest, Decision Tree, Stochastic Gradient Descent, Logistic Regression, and Neural Network are used to develop the classifiers. All the developed classifiers are also tested on new data which are excluded from the dataset used in the experiment.
Introduction
Placement is a decisive factor of successful completion of any coursework at the graduate or postgraduate level. It is a dream of every student to get placed in top MNCs to achieve their set goals and objectives. Aiming to place the maximum number of students, the universities and institutions are leveling up their game by equipping and upgrading their students through training and placement cells (Accessed May 04, 2020).
Machine learning is the science of getting computers to learn, without being explicitly programmed. Each time you need your e-mail and a spam filter saves you from having to wade through tons of spams, again, that’s because your computer has learned to distinguish spam from non spam e-mail. So that’s machine learning (Accessed June 27, 2020).
According to the Samuel “The field of study that gives computer the ability to learn without being explicitly programmed”. This is an older definition of machine learning. Other definition is given by Tom Mitchell “A computer program is said to learn from experience E with respect to some class of tasks T and performance measure P, if it’s performance at task in T, as measured by P, improves with experience E” (Accessed June 27, 2020).
Classification Algorithms
It is a data analysis task, i.e. the process of finding a model that describes and distinguishes data classes and concepts. Classification is the problem of identifying to which of a set of categories, a new observation belongs to, on the basis of a training set of data containing observations and whose categories membership is known.
Example: Before starting any Project, we need to check its feasibility. In this case, a classifier is required to predict class labels such as ‘Safe’ and ‘Risky’ for adopting the Project and to further approve it. It is a two-step process such as:
Learning Step (Training Phase): Construction of Classification Model: Different Algorithms are used to build a classifier by making the model learn using the training set available. The model has to be trained for the prediction of accurate results.
Classification Step: Model used to predict class labels and testing the constructed model on test data and hence estimate the accuracy of the classification rules (Accessed June 25, 2020).
Majority of the research work conducted to address the classification problem focus on the classifier accuracy to compare the algorithm. So, there is a strong need to conduct study to address classification problem and compare the performance of the algorithm also apart from accuracy and other related metrics. From the literature review, we also observe that a lot of studies have been conducted using binary and multi classification in different domains, but there are very few studies conducted addressing the problem of placement prediction of the students in higher educational institutions.
In a nutshell, our prime focus in this study is summarized as follows:
We propose a mechanism to prioritize the academic performance parameters relevant for student placement.
We compare the placement prediction accuracy of different supervised machine learning classification algorithms by developing various binary classifiers. The accuracy parameters used are percentage accuracy score, confusion matrix, heatmap, precision, recall, f1-score and support.
We also compare the placement prediction performance of different supervised machine learning classification algorithms by developing various binary classifiers. The performance parameters used are AUC and ROC curve.
The rest of the paper is summarized as follows:
Section 2 describes the related work available in literature. Section 3 represents materials and methods used in the research work. Section 4 elaborates the results and discussions of the study conducted. Section 5 depicts the conclusion of the entire study conducted and direction for the future work.
Related Work
In this section, we review the literature on classification methods for binary and multi-label classification, and provide an overview of the work done by different researchers.
Give an introduction to classification algorithms and the metrics that are used to quantify and visualize their performance. They first briefly explain what we mean with a classification algorithm, and, as an example, they describe in more detail the naive Bayesian classification algorithm. Using the concept of a confusion matrix, they next define the various performance metrics that can be derived from it (Korst et al. Citation2019).
Described a model based on data mining for student placement prediction using machine learning algorithms. To extract the meaningful information of datasets, this process was called as data mining by using machine learning algorithms. Authors also used education data mining tool, which was to be considered as more powerful tool in educational domain. It presents an effective method for extracting the student’s performance based on various parameters and predicts as well as analyses whether the students were recruited or not during the campus placement. Predictions were performed using machine learning algorithm J48, Naive Bayes, Random Forest, and Random Tree in weka tool and multiple linear regression. Based on the result, higher education organization can offer superior training to their students (Rao et al.Citation2018).
Different classifiers algorithms namely Naive Bayes, Multilayer perceptron, Instance-based K-Nearest Neighbor (IBK), J48 Decision Tree, Simple Cart, Zero R, CV Parameter, and Filtered Classifier performance was analyzed. The diabetes datasets, nutrition datasets, E. coli protein datasets, mushrooms datasets were used for calculating the performance by using the cross validations of parameter. Finally identified classification algorithms performance was evaluated and compared in terms of the classification accuracy and execution time under different data sets (Swarupa and Jyothi Citation2016).
In this paper, the main aim was to describe the various ways in which the machine learning is used in educational institutes and how institutes can get prediction of students’ performance, and the important features that are needed to be considered while making prediction for different things. In addition to this, the study also compares the prediction given by different machine learning algorithms. The paper concludes that the prediction of the students’ performance can be made more precise and accurate by considering the learning style of students, their motivation and interest, concentration level, family background, personality type, information processing ability and the way they attempt the exams (Halde Citation2016).
In their paper, author discusses the use of decision trees in educational data mining. Decision tree algorithms were applied on engineering students' past performance data to generate the model and this model can be used to predict the student’s future performance. It will enable to identify the students in advance who are likely to fail and allow the teacher to provide appropriate inputs (Kabra and Bichkar Citation2011).
Higher learning Institutions are facing bigger challenges in performance evaluation of students for placements. In this era, the competition is increasing among the institutions. Therefore, there is a need of defining a new efficient system that is used for assessment and for providing the better management and take decision support system to assist new strategies. Authors present a recommendation system that is used to predict the student’s placement (Thangavel, DivyaBkaratki, and Abijitk Citation2017).
This study introduces the basic theory of support vector machine, the basic idea of the classification, and currently used support vector machine classification algorithm. Practical problems with which an algorithm, and proves the effectiveness of the algorithm, the final outlook of the prospects of support vector machines in classification applications. Finally, the prospect of the support vector machines in classification applications (Zhang Citation2012).
This paper supports the real-time prediction of the age group of the students toward four different ICT parameters, such as the development and availability of modern ICT Resources (DAICT), Attitude of students toward ICT and mobile technology in education (AICTM), use of ICT and mobile technology in education (UICTM) and educational benefits of ICT and mobile technology in education (EBICTM) in Hungarian and Indian University. The authors solved a multiclassification problem using tested primary dataset with 5 popular supervised machine learning classifiers such as K-nearest neighbor (KNN), Random forest (RF) and Support vector machine (SVM), Bayesian network (BN) and decision tree (C5.1) in SPSS IBM Modeler version 18.1(Verma et al. Citation2019).
This paper addresses the placement chance prediction problem and placement and skill ranking predictors for programming classes using class attitude, psychological scales, and code metrics of the student, respectively (Elayidom, Idikkula, and Alexander Citation2011) (Ishizue et al. Citation2018). Their qualitative study investigates the career placement concerns of international graduate students returning to their home countries, heading to other countries, or remaining in the United States after their education (Shen, Yih-Jiun, and Edwin L. Herr Citation2004).Their study analyzes student performance in engineering placement using data mining (Agarwal et al. Citation2019).Predicted student’s campus placement probability using binary logistic regression (Kumar et al. Citation2019).Uses psychology-assisted prediction of academic performance using machine learning (Halde, Deshpande, and Mahajan Citation2016).
Presented a perspective on the overall process of developing classifiers for real-world classification problems (Brodley, C. and Smyth, P. Citation1997). In their paper analyzes how to introduce machine learning algorithms into the process of direct volume rendering. A conceptual framework for the optical property function elicitation process is proposed and particularized for the use of attribute-value classifiers (Cerquides et al. Citation2005).Performed a study on performance analysis of classification algorithms for activity recognition using Micro-Doppler Feature (Lin, Yier, and Julien Le Kernec Citation2017). In their study performed news articles classification using Random Forests and Weighted Multimodal Features (Liparas et al. Citation2014).
In this paper, authors analyzed and performed computation times of different classification algorithms on many datasets using parallel profiling and computing techniques. Performance analysis was based on many factors, such as the unique nature of the dataset, the size, and type of the class, the diversity of the data in the data set, and so on (Upadhyay, Navin Mani, and Ravi Shankar Singh Citation2018).The authors illustrated the text classification process on different dataset using some standard supervised machine learning techniques (Mishu, SadiaZaman, and S. M. Rafiuddin, Citation2016).In their study aims to identify the key trends among different types of supervised machine learning algorithms, and their performance and usage for disease risk prediction (Uddin et al. Citation2019).Performed a study based on multi-label classification with weighted classifier selection and stacked ensemble (Xia, Yuelong, Ke Chen, and Yun Yang, Citation2020).
Materials and Methods
In this section, we have described various materials used to accomplish our research work and the complete13steps of research methodology.
Dataset
The dataset used in the study is collected from the students of the final year B.Tech. CSE & IT branch of Shri Ram Murti Smarak College of Engineering and Technology (SRMSCET), Bareilly, Uttar Pradesh (India). These students have undergone through the various placement drives in the current academic session of 2019–20. The three input features selected in the dataset are the percentage marks achieved by the students in class Tenth, Twelve and B. Tech, respectively. The fourth input feature is the number of Backlog pending till the date of data collection in B.Tech. The output/target class is whether the student is placed in any of the placement drives or not. A 1 in the output column indicates that the student is placed and a 0 indicates that the student is unplaced. All four input features and the target class are categorical in nature. The entries in first three input features i.e. percentage marks acquired by the students in class Tenth, Twelve and B.Tech are summarized as follows: 1 is less than 60%, 2 is greater than or equal to 60% but less than 70%, 3 is greater than or equal to 70% but less than 80%, 4 is greater than or equal to 80% but less than 90% and 5 is greater than or equal to 90%. The total numbers of respondents in the dataset are 170.A Google form with appropriate instructions was designed and sent to the students for data collection.
Tools Used
All the eight classification algorithms used to build classifiers are implemented using following libraries of Python:
Seaborn – for heat map generation.
Scikit learn/sklearn – for algorithm implementation.
Pandas – for dataset-related operations.
Matplotlib – for plotting.
Google Colaboratory – a free cloud service of Google was used to write and execute code in Python.
Steps of the Research Methodology
Different stages that we follow to complete our research work broadly consists of 13 steps. All these 13 steps are summarized as follows in sequential order:
Step 1: Problem formulation
Step2: Feature selection
Step 3: Google form design for data collection
Step4: Data collection
Step 5: Data cleansing
Step 6: Classification algorithm identification and selection
Step 7: Identification of tools for implementation
Step 8: Implementation of algorithm and development of classification models through training
Step 9: Testing the models
Step10: Evaluating the accuracy of the models
Step 11: Evaluating the performance of the models
Step12: Prioritizing the input feature through result analysis
Step 13: Comparing the accuracy and performance of the models
Results and Discussions
This section is the core of our research work. In this section, we have explained the results obtained through the experiment conducted and appropriate discussions required elaborating the highlights of the results. This section is summarized as follows:
Section 4.1 focuses on the experimental input required and selected for the study. Section 4.2 describes the developed classifier hyper parameter and its characteristics. Section 4.3 represents developed classifier confusion matrix and its associated heat map. Section 4.4 elaborates developed classifier classification report. Section 4.5 analyses decision tree generated by decision tree classifier. Section 4.6 shows a two dimensional column chart to compare the percentage accuracy score of different classifiers. Section 4.7 discusses the impact of MSE (Mean Squared Error) and Log Loss on classifier accuracy. Section 4.8 deliberates AUC (Area under Curve) – ROC (Receiver Operating Characteristic) Curve to compare the performance of different classifiers.
Experimental Input
represents various experimental input parameters required to accomplish the implementation in python to develop classifiers. We have selected eight classification algorithms, four input features explained in section 3.1, one target/output class explained in section 3.1. The distribution of training and test dataset are 80and 20%, respectively.
Table 1. Representing selected algorithm, input features, target class, training and test data percentage for developing the classifiers
Developed Classifier Hyper Parameter and Characteristic
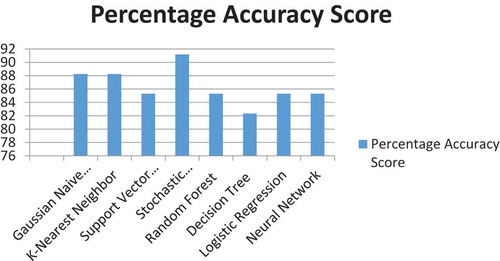
depicts developed classifiers, optimum value of random state, accuracy score, and percentage accuracy score generated by the developed classifier and remark. Stochastic Gradient Descent shows maximum accuracy score 0.9117, Gaussian Naive Bayes and K-Nearest Neighbor 0.8823, Support Vector Machine, Random Forest, Logistic Regression, and Neural Network 0.8529 and Decision Tree shows the minimum accuracy score 0.8235.
Table 2. Representing developed classifier, optimum value of random state, accuracy score, and percentage accuracy score generated by the developed classifier and remark (in any)
Developed Classifier Confusion Matrix and Heatmap
describes confusion matrix and heatmap generated by developed classifiers. The four quadrants of the confusion matrix are False Positive, True Positive, False Negative, and True Negative, respectively. X axis of heatmap represents true label and Y axis represents predicted label.
Table 3. Representing confusion matrix and heatmap generated by developed classifiers
Developed ClassifierClassification Report
displays the classification report generated by developed classifiers with parameters precision, recall, f1-score, and support. These values are automatically calculated through their formulae implemented in python. The values of confusion matrix are used in these calculations.
Table 4. Representing classification report generated by developed classifiers with parameters precision, recall, f1-score and support
Decision Tree Generated by Decision Tree Classifier
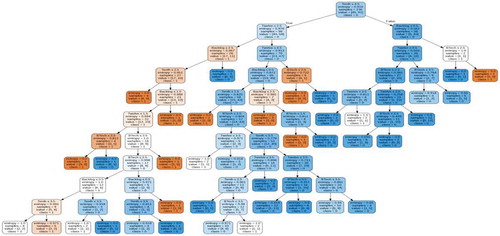
represents decision tree generated by decision tree classifier. The depth of the decision tree is 10. Tenth is at the root of the decision tree and hence it is on the top priority. Twelve and Backlog are at the next level of the root and therefore they are on the second priority. The fourth input feature, percentage marks in B Tech is at the last priority among all. The same result is observed upon testing the classifiers on new data also.
Figure 1. Decision tree generated by decision tree classifier (Depth = 10)
A 2 Dimensional Column Chart to Compare the Percentage Accuracy Score
depicts a two dimensional column chart to compare the percentage Accuracy Score generated by different classifiers. It is obvious from this figure that stochastic gradient descent shows the highest accuracy score.
Figure 2. A 2 dimensional column chart to compare the percentage accuracy score
MSE (Mean Squared Error) and Log Loss
represents MSE and Log Loss. MSE is an accuracy parameter and Log Loss is a performance parameter. Although MSE and Log Loss are more significant in case of regression problem and the value of Log Loss must be in the range of 0 and 1. Our problem is classification and the value of Log Loss is exceeding 1 which is not significant in our case. But, the calculated values of MSE and Log Loss are minimum in case of Stochastic Gradient Descent which is having highest accuracy score of 0.9117 as mentioned in section 4.2. Although this table is not very significant yet it validates our results in section 4.2.
Table 5. Mean squared error and log loss
AUC (Area under Curve)–ROC (Receiver Operating Characteristic) Curve
AUC (Area under Curve)–ROC (Receiver Operating Characteristic) Curve represents AUC (Area under Curve) and ROC (Receiver Operating Characteristic) curve. AUC–ROC curve is the model selection performance metric for bi-–multi-class classification problem. ROC is a probability curve for different classes. ROC tells us how good the model is for distinguishing the given classes, in terms of the predicted probability. A typical ROC curve has False Positive Rate (FPR) on the X-axis and True Positive Rate (TPR) on the Y-axis. The area covered by the curve is the area between the orange line (ROC) and the axis. This area covered is AUC. The bigger the area covered, the better the machine learning models is at distinguishing the given classes. Ideal value for AUC is 1. Support Vector Machine and Logistic Regression have the highest value of AUC as 0.86 hence have highest performance.
Table 6. AUC (area under curve) – ROC (receiver operating characteristic) curve
Conclusions and Future Work
This section summarizes the conclusions drawn from our research work and the upcoming directions for future work.
We propose a mechanism to prioritize the academic performance parameters relevant for student placement through our developed classifiers. For the academic performance parameters, we conclude that percentage in Tenth is on the top priority followed by percentage in Twelve and Backlog in B Tech. B Tech percentage is on the last priority out of the four input features. This conclusion is validated by running the classifiers on the new data and decision tree analysis in section 4.5.In section 4.2, 4.3 and 4.4 we compare the placement prediction accuracy of different supervised machine learning classification algorithms by developing various binary classifiers. The accuracy parameters used are percentage accuracy score, confusion matrix, heatmap. Stochastic Gradient Descent shows the highest accuracy score of 0.9117 which is obvious from in section 4.6.We also compare the developed classifiers by their classification report through the sub parameters precision, recall, f1-score and support. In section 4.8 we compare the placement prediction performance of different supervised machine learning classification algorithms by developing various binary classifiers. The performance parameters used are AUC and ROC curve. Support Vector Machine and Logistic Regression shows the highest performance with AUC value 0.86. In future, we will try to build classifiers to predict placement of the students by mixing input features from the domain of academic performance and skills both.
Web References
Accessed May 04, 2020. https://www.poornima.edu.in/role-of-university-in-students-placement/
Accessed June 25, 2020.https://www.geeksforgeeks.org/basic-concept-classification-data-mining/
Accessed June 27, 2020. https://www.coursera.org/lecture/machine-learning/welcome-RKFpn/
Acknowledgments
This research is accomplished by a team of three faculty members from the Department of Computer Science and Engineering at Shri Ram Murti Smarak College of Engineering and Technology (SRMSCET), Bareilly, Uttar Pradesh (India). The authors are thankful to the management of SRMSCET for motivating and providing all kinds of research infrastructure and facilities such as print and online journals of repute in the college library and computing and Internet facility in the department. The authors are also thankful to all final year students of CSE & IT branch of SRMSCET for being prompt and supportive in the data collection process. We are thankful to our family members and colleagues for their support and cooperation. Finally, our special thanks to faculty members Hiresh Gupta and Durgesh Tripathi for their valuable direction.
References
- Agarwal, K., M. Ekansh, R. Chandrima, P. Manjusha, and S. Siddharth. “Analyzing student performance in engineering placement using data mining.” In Proceedings of International Conference on Computational Intelligence and Data Engineering, pp.171–81. Springer, Singapore, 2019.
- Brodley, C., and P. Smyth. 1997. Applying classification algorithms in practice. Statistics and Computing 7.
- Cerquides, J., M. López-Sánchez, S. Ontañón, E. Puertas, A. Puig, O. Pujol, and D. Tost. “Classification algorithms for biomedical volume datasets.” In Conference of the Spanish Association for Artificial Intelligence, pp.143–52. Springer, Berlin, Heidelberg, 2005.
- Elayidom, S., S. M. Idikkula, and J. Alexander. 2011. A generalized data mining framework for placement chance prediction problems. International Journal of Computer Applications 31 (no. 3):0975–8887.
- Halde, R. R. “Application of machine learning algorithms for betterment in education system.” In 2016 International Conference on Automatic Control and Dynamic Optimization Techniques (ICACDOT), pp.1110–14. Bangalore, India: IEEE, 2016.
- Halde, R. R., A. Deshpande, and A. Mahajan. “Psychology assisted prediction of academic performance using machine learning.” In 2016 IEEE International Conference on Recent Trends in Electronics, Information & Communication Technology (RTEICT), pp.431–35. Bangalore, India: IEEE, 2016.
- Ishizue, R., K. Sakamoto, H. Washizaki, and Y. Fukazawa. 2018. Student placement and skill ranking predictors for programming classes using class attitude, psychological scales, and code metrics. Research and Practice in Technology Enhanced Learning 13 (no. 1):7. doi:10.1186/s41039-018-0075-y.
- Kabra, R. R., and R. S. Bichkar. 2011. Performance prediction of engineering students using decision trees. International Journal of Computer Applications 36 (no. 11):8–12.
- Korst, J., V. Pronk, M. Barbieri, and S. Consoli. 2019. Introduction to classification algorithms and their performance analysis using medical examples. In Data science for healthcare, 39–73. Cham, Springer: Sergio ConsoliDiego Reforgiato RecuperoMilan Petković.
- Kumar, D., Z. Satish, R. D. S., and A. S. 2019. Predicting student’s campus placement probability using binary logistic regression. International Journal of Innovative Technology and Exploring Engineering 8 (no. 9):2633–35.
- Lin, Y., and J. Le Kernec. “Performance analysis of classification algorithms for activity recognition using micro-doppler feature.” In 2017 13th International Conference on Computational Intelligence and Security (CIS), pp.480–83. Hongkong, China: IEEE, 2017.
- Liparas, D., Y. HaCohen-Kerner, A. Moumtzidou, S. Vrochidis, and I. Kompatsiaris. “News articles classification using random forests and weighted multimodal features.” In Information Retrieval Facility Conference, pp.63–75. Springer, Cham, 2014.
- Mishu, S., and S. M. Rafiuddin. “Performance analysis of supervised machine learning algorithms for text classification.” In 2016 19th International Conference on Computer and Information Technology (ICCIT), pp.409–13. Dhaka, Bangladesh: IEEE, 2016.
- Shen, Y.-J., and E. L. Herr. 2004. Career placement concerns of international graduate students: A qualitative study. Journal of Career Development 31 (no. 1):15–29. doi:10.1177/089484530403100102.
- Sreenivasa Rao, K., N. Swapna, and P. Praveen Kumar. 2018. Educational data mining for student placement prediction using machine learning algorithms. International Journal of Engineering and Technology (UAE) 2. 7 (no. 1.2):43–46. doi:10.14419/ijet.v7i1.2.8988.
- Swarupa, R. A., and S. Jyothi. “Performance analysis of classification algorithms under different datasets.” In 2016 3rd International Conference on Computing for Sustainable Global Development (INDIACom), pp.1584–1589. New Delhi, India: IEEE, 2016.
- Thangavel, S. K., P. DivyaBkaratki, and S. Abijitk. “Student placement analyzer: A recommendation system using machine learning.” In 2017 4th International Conference on Advanced Computing and Communication Systems (ICACCS), pp.1–5. Coimbatore, India: IEEE, 2017.
- Uddin, S., A. Khan, M. Hossain, and M. Ali Moni. 2019. Comparing different supervised machine learning algorithms for disease prediction. BMC Medical Informatics and Decision Making 19 (no. 1):1–16. doi:10.1186/s12911-019-1004-8.
- Upadhyay, N. M., and R. S. Singh. “Performance evaluation of classification algorithm in weka using parallel performance profiling and computing technique.” In 2018 Fifth International Conference on Parallel, Distributed and Grid Computing (PDGC), pp.522–27. Solan, India: IEEE, 2018.
- Verma, C., Zoltánillés, and S. Veronika “Age group predictive models for the real time prediction of the university students using machine learning: Preliminary results.” In 2019 IEEE International Conference on Electrical, Computer and Communication Technologies (ICECCT), pp.1–7. Coimbatore, India: IEEE, 2019.
- Xia, Y., K. Chen, and Y. Yang. 2020. Multi-label classification with weighted classifier selection and stacked ensemble. Information Sciences. doi:10.1016/j.ins.2020.06.017.
- Zhang, Y. “Support vector machine classification algorithm and its application.” In International Conference on Information Computing and Applications, pp.179–86. Springer, Berlin, Heidelberg, 2012.