
ABSTRACT
This paper describes the development and application of a mobile framework to assist teachers in distance learning courses. The tool has a MultiAgent System (MAS) in charge of collecting and analyzing the feelings of texts posted by students in the activities forums, chats, journal and messages sent to the tutor. By means of framework it is possible to identify which students are showing negative feelings, which is the feeling that predominates in a class, to verify the history of the feelings of a certain student. As a way to evaluate the project, teachers with experience in tutoring used the framework with real course data and then to verify the efficiency of the tool, answered a questionnaire and classified postings of an VLE, as a result we obtained the accuracy of 73,88%.
Introduction
Virtual Learning Environments (VLE) provide a set of communication and cooperation tools used by students and teachers in the teaching-learning process. In these environments we have the image of the tutor or mediator, who is responsible for carrying out the students follow-up using VLE resources, however these environments have limitations of technological resources that help teachers in their daily activities, considering the large number of activities carried out by students. With this it is of fundamental importance to verify the students’ performance through the accomplishment of their activities, in addition as a strategy we can also analyze aspects related to the affectivity of the students, since they can influence in the learning, in the perception of the class, besides helping the tutor in decision making (Alencar and Netto Citation2011).
The accompaniment is a fundamental procedure in the students’ training and in the success of the course. According to teachers, much of the mentoring time is spent reading student posts in the forum. Among the communication tools used in an VLE, the most used is the discussion forum, essential for the collective construction of knowledge, which enables the participant to make reflections, organize ideas and deepen specific themes of a course, in which students can express their feelings and opinions and contribute to the discussion through texts. The analysis of forums allows the investigation of the effective participation of students in the debate, expression of opinions, with that the relevance in analyzing messages written in forums (Azevedo, Reategui, and Behar Citation2014).
The interaction between people in face-to-face courses obtains excellent results, since the senses help the students in the execution of the activities, but in Virtual Environments of Learning this perception is different and needs to be stimulated.
The research of (Longhi, Behar, and Bercht Citation2009) highlights the use of pedagogical strategies as actions planned and/or used by the teacher in order to achieve the intended goals in the formation of their students, allowing the teacher to implement actions that integrate the student discouraged or disinterested.
According to (Bastos, Bercht, and Wives Citation2013), in the classroom, the teacher can observe if the class or student is motivated or discouraged with a content or an activity. When the teacher can perceive issues related to affectivity in the context of learning then he can change his didactics or his pedagogical strategies with the purpose of helping the student, the class or a group of students, avoiding dropping and avoidance of students. Already in online course, this situation is different due to the large volume of data and interactions existing in VLE.
In online modality there is no face-to-face relationship between students and teachers, in addition space-time is different from face-to-face teaching, where we have students living in the same space and time. In the online environment, the student decides on his teaching and learning in an autonomous and independent way, being able to rely on the teacher, called “tutor”, assisting students in a gradual way through dialogs. In this environment, the communication between tutor and student occurs through synchronous and asynchronous relations, using dialogs mediated by texts.
The affective bond between tutor and student plays an important role in pedagogical mediation, since the students expect the tutor to be attentive, motivated and encouraged in the virtual and in-person moments, that is, the students feel more welcomed and secure when there is this affective and cognitive relationship in the activities (Liu Citation1997).
The researchers (Azevedo, Reategui, and Behar Citation2014) emphasize the importance of analyzing the registration of messages posted in the forum, since from the texts produced the tutor can have access to different students’ reports it is possible to identify: doubts, difficulties, contributions, highlight students, among others.
In this context, we must emphasize the importance of analyzing students’ interactions in VLE, since we can identify the affective state, which can be influenced by the nature of the task, as well as by the pedagogical strategy (Longhi Citation2011). These data can be analyzed using artificial intelligence techniques to motivate and stimulate students, as well as identify various feelings such as: frustration, isolation, discouragement and demotivation. According to (Gibbs Citation2010), discouragement can occur during learning, causing the student to make wrong decisions, leading the student to abandon a course or discipline. Often, the students may feel discouraged when they can not follow the content, or fails to meet deadlines to deliver activities or does not understand how the tools work VLE.
Considering these difficulties, we propose in this work as a solution strategy, the development of a framework that performs Analysis of Sentiments on texts extracted from students’ messages from the activities: forum, journal, chat and message sent to the tutor in VLE Moodle, aiming at reveal important information related to the affectivity of students and contribute to the work done by the tutors.
Through the framework it is possible to identify which students are showing negative feelings, which is the feeling that predominates in a class and check a specific student’s emotional state of during the course.
Related Work
In this section, it will be described some related works that served as a theoretical basis for the framework development, which resulted from the bibliographical and systematic review of the literature on Multi-Agent System (MAS), Sentiment Analysis and Data Visualization.
Multi-Agent System
According to Russell and Norvig (Citation2010) agent is any entity capable of perceiving its environment through sensors and acting on this environment through the actuators. These agents can act in a autonomous and proactive way.
The work of (Arias, Moreno, and Ovalle Citation2009) presents a study about Virtual Learning Environment supported by the integration of a multi-agent system (MAS), intelligent tutors system (ITS) and Computer Supported Collaborative Learning (CSCL). In this project we can highlight the distributed form that MAS works, making it possible to coordinate a group of autonomous or semi-autonomous agents with different tasks, improving student learning.
In collaborative learning the interactions of students uses dialogs and shared knowledge, and in this process the student is responsible for the construction of knowledge. In this study the researchers used intelligent agents and obtained an improvement in the means of the students’ grades between 8.52% and 11.1% compared to the traditional system (Moubaiddin, Shawarbeh, and Obeid Citation2013).
The researchers (Azevedo, Reategui, and Behar Citation2014) developed the tool ForumMiner, which uses Multi-Agent System with the objective of automatically analyzing student posts in a discussion forum through text mining. To validate this tool, 20 experienced teachers evaluated 600 student posts.
Sentiment Analysis
Every year that passes social networks has been growing, consequently there is a great amount of data, opinions, with various subjects that are available on the web (Pang and Lee Citation2008). All this content can be explored using Sentiment Analysis techniques, especially in the education area. Sentiment Analysis is a field in development of Affective Computing, which has contributed to many systems, since it is able to automatically detect the student’s feeling in the text.
According to (Liu Citation2015) sentiment represents activity, opinion or emotion issued by opinion holder. This feeling can be measured by its polarity (positive, negative or neutral), but it can also be measured by classes of emotions. The researcher (Ekman Citation2011) defined in six the basic emotions, among them: anger, disgust, fear, happiness, sadness and surprise. The researcher Robert Plutchik has improved Elkman’s idea and created the emotional wheel of eight emotions, including joy, trust, fear, surprise, sadness, disgust, anger and anticipation (Plutchik Citation2001).
In social networks, people from all over the world interact, Interact, relate, exchange information, create intimacy and emotional bonds without ever having seen the other party in person, but often do not have this affection between the mediator and student in virtual learning environments (Roorda et al. Citation2017).
In order to promote affectivity in virtual learning environments, it is necessary that the mediator’s actions of interactivity be more constant, being present in the VLE and attentive to the “movement” of the students, trying to attend them individually and affectivity plays an important role in the relationship between teacher and student, in addition to influencing as a motivating aspect, helps in self-esteem, perception, provides a climate of trust between both parts, as well as being an essential component of harmony and balance of human personality .
The individual development begins with the interactions that the individual establishes in the historical and cultural context in which he is inserted. The construction of knowledge occurs from an intense process of social interaction, where we can highlight the language, which has two fundamental characteristics that are communication and the construction of thought.
During the teaching-learning process students are encouraged to use various interaction mechanisms that allow the generation of texts. In addition to the objective situations, where textual messages related to the answers of questions or indication of obtained results are observed, situations are observed in which texts describing subjectivities are generated. These may correspond to a variety of situations, ranging from student feedback on performance, personal observations on peer and teacher comments, indication of satisfaction and acceptance with teaching processes, or description of difficulties encountered by students participate in this type of teaching modality (Araujo et al. Citation2013). In the texts we can identify many feelings, such as happiness, fear, surprise, based on this the authors (Shaikh, Prendinger, and Ishizuka Citation2008) developed SenseNet, a tool capable of automatically recognize sentiments in text at the sentence level.
Sentiment Analysis can be done in various ways and strategies. The main techniques for classifying feelings in texts are divided into three approaches: Machine Learning, Lexical and Hybrid. In the approach using Machine Learning, messages are sorted using supervised and unsupervised methods. In the Lexical approach, classification is based on dictionaries, where each word is associated with a feeling, and in the Hybrid approach, where we combine both approaches (Malheiros and Lima Citation2013).
The Lexical or Linguistic Approach is dictionary-based, whose strong point is the use of lexical (dictionaries) of feelings, which are word compilations or expressions of feeling associated with their polarity (Tumitan and Becker Citation2013).
The lexicon is the sum of the experiences of a sociolinguistic group, where the users of a language express their thoughts, feelings and emotions, creating, innovating, incorporating new vocabulary and expanding their lexical collection, due to the transformations in time and space.
Considering that in regular classes the teacher observes the affective state of students through their expressions, speech and behavior, thereby determining whether the class or student has interest in the content taught. In distance learning, this situation demands much more from the teacher, because the emotions expressed by the students are recorded in communication tools, hence the importance of being analyzed (Becker, Moreira, and Santos Citation2017).
The researchers (Reis et al. Citation2018) made a systematic mapping of the literature to investigate affective states (emotion, mood, and personality traits) and socio-emotional factors used in Computer Supported Collaborative Learning (CSCL). As a final result of the mapping, 58 studies were selected, where 44.83% used personality traits, 48.28% used emotions, 13.79% used humor and 8.62% had social-emotional factors.
Data Visualization
Data Visualization is a methodology used to visualize and analyze data. One of the main objectives of data visualization is to represent information clearly and effectively through graphs. This method allows you to transform data, information and knowledge into a form of visual presentation that can be easily interpreted by people (Kucher, Paradis, and Kerren Citation2018).
The data visualization helps teachers in the process of teaching and learning, providing detailed information that helps to accompany students, and improves the teaching quality of an online course (Tervakari et al. Citation20140).
According to (Moreno and Redondo Citation2016) visual, interactive and computer-mediated representation enhances cognition, allowing the interpretation and understanding of the information presented. In his study the visualization of the data assisted teachers in the follow-up of the students, making it possible to identify possible problems.
The researcher (Becker, Moreira, and Santos Citation2017) used this methodology in his research, which describes Moodle Predicta, a visualization module of a system that allows users to have an overview of the behavior of students and teachers, interactions, personal data and academic achievement.
Framework
SentiEduc is a framework aiming to assist teachers in monitoring students in distance learning courses. The tool has a Multi-Agent System (MAS) responsible for collecting and analyzing feelings of texts posted (forum, chat, journal and messages sent to the tutor) by students in distance courses, and it is possible to identify which students are showing negative emotions, which is the predominant feeling in a class, to verify the history of the feelings of a certain student.
In shows the architecture of the SentiEduc Framework, composed of the main elements: Student, Tutor, Framework, Moodle Database, Intelligent Agents, Language Translator, Sentiment Analyzer and SenticNet Database.
Figure 1. SentiEduc architecture
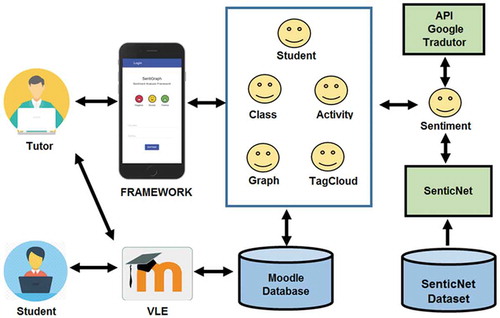
The framework has a Multi-Agent System composed of 6 (six) intelligent agents that interact with each other, named: Class, Student, Activity, Sentiment, Graph and TagCloud. According to Russell and Norvig (Citation2010), an Intelligent Agent (IA) is an autonomous entity, capable of interacting with the environment, with other AIs, cooperating or even competing with each other and making decisions without the interference of a system or of human beings. These agents were modeled using the MaSE (Multiagent System Engineering) methodology proposed by (De Loach and Wood Citation2001), in , we detail the role of each agent.
Table 1. Agent and function
The framework was developed using the following technologies: LAMP (Linux, Apache, MySQL, PHP), Laravel Framework, ECharts graphical library using JavaScript and Canvas, JADE (JAVA Agent Development Framework), Moodle (Modular Object- Oriented Dynamic Learning Environment), Google Translate API and Sentic Computing. We can also highlight the use of the Responsive Web Design (RWD), which allows the user to view the framework on several different devices such as: PC, notebook, smarthphone, tablet, etc.
Methodology
This work uses the KDD process (Knowledge Discovery in Databases), proposed by (Fayyad, Piatetsky-Shapiro, and Smyth Citation1996) to perform Sentiment Analysis. The KDD process has four steps: Data Collection, Preprocessing, Sorting and Summarization, as we can see in .
Figure 2. KDD process
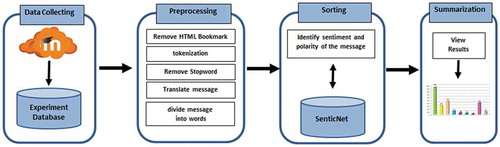
Data Collecting
The database used by the framework is composed of real data, collected from 10 (ten) classes, with an average of 35 students, of the course “Planning and Evaluation Processes in Vocational and Technological Education” of the School of Distance Professional Education CETAM – CETAM EaD, in the state of Amazonas/Brazil, carried out from August to October 2018.
It was chosen to collect messages from the forum, chat, journal and message sent to the tutor to evaluate and identify the emotional state of the students, since they are the activities most used by students in their interactions with VLE.
In the data collection stage the Sentiment Agent receives the messages posted by the students in the VLE.
Preprocessing
In the pre-processing phase, the HyperText Markup Language (HTML) markers are removed from messages. Next comes the tokenization, that is, the message is converted from uppercase to lowercase, special characters, blanks, etc. are removed. These procedures helps to reduce data volume and processing time. Then the stopwords (verbs, articles, adverbs, prepositions, conjunctions, etc.) are removed, words considered irrelevant to the set of results. After this procedure the agent forwards the messages in the Portuguese language of Brazil to the Translator, which does the automatic translation into the English language using the Google Translator API and finally the agent divides each message into words.
Sorting
In the sorting step, the Sentiment Analyzer receives each word of the message and to sort uses the SenticNet tool. To identify the feeling that predominates in each message, all feelings are counted and we see the feeling that appears most in the message.
Summarization
In the summarization stage, reports are generated containing: date, message, polarity and sentiment, graphs are generated with the emotions of the student or class, displaying the class identification, the number of messages and the emotions of the class.
Operation
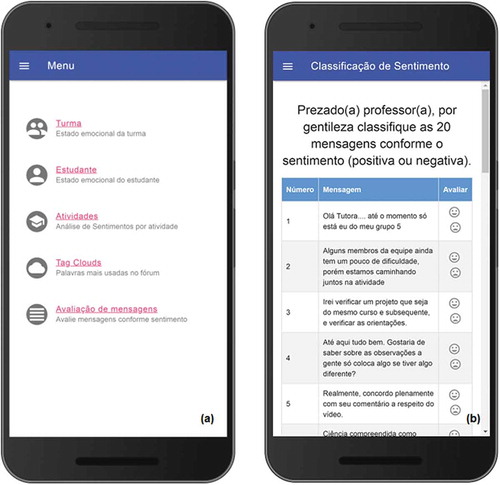
The tutor can use the same login account of the VLE to access the SentiEduc framework as (). After logging in, the tutor can choose a menu option (class, student, activity and tagcloud), (), and for each of the options are activated the Agents, Student and Activity agents, who receive the request and communicate with the Sentiment Agent.
Figure 3. SentiEduc framework
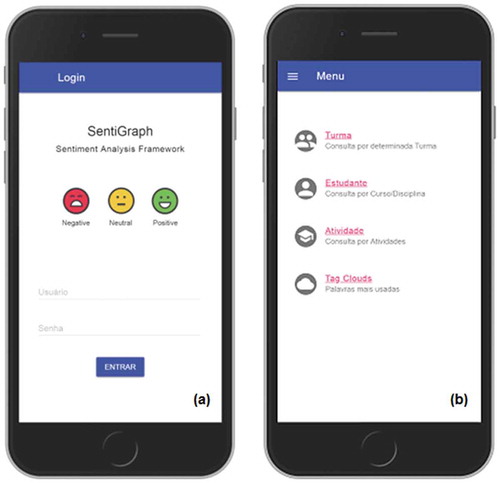
If the tutor wants to visualize the emotional state of a class, then click on the “Class” option in the menu. If you want to view the emotional state of a student, then click on the “Student” option in the menu. If you want to view a student’s emotional state in relation to an activity, then click on the “Activity” menu. After informing the data in both cases the Sentiment Agent is activated, which is in charge of performing the Sentiment Analysis, using the phases of the KDD process, resulting in a table containing the date of the post, the message, the feeling and polarity, as shown in .
Figure 4. Graphic
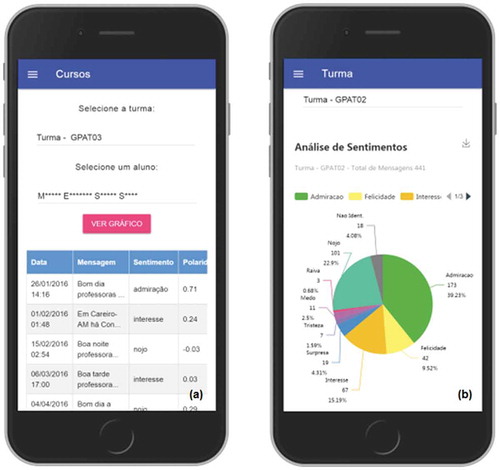
The tutor must click on the button “Create graph” to visualize the graph with the emotional state of the class or the student, and then, the Graphic agent is activated.
The Graphic agent receives the data (class name and student was hidden for the experiment) and generates the reports with data (date, message, polarity and sentiment) extracted from each sentence, as well as generating a graph with the emotions (), showing the class identification, the number of messages and class emotions. Each color used in the chart corresponds to an emotion, equal to the Wheel of Emotions, proposed by (Plutchik Citation2001).
Figure 5. TagCloud forum
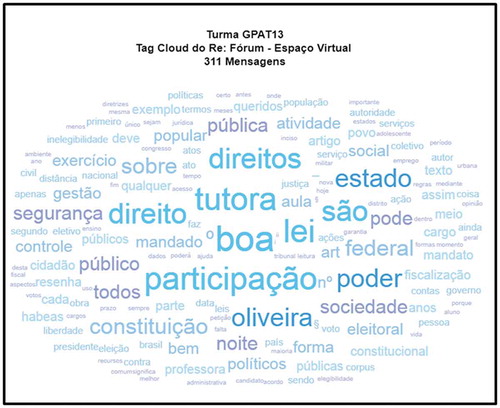
When the tutor wants to view TagCloud, then choose a forum and click on the “Create TagCloud” button, this will trigger the TagCloud agent, which analyzes all messages posted in a forum and generates a TagCloud with the most used words in the forum and the amount of messages posted on the forum, as shown in .
The graphs and TagCloud used by the framework use Data Visualization techniques, which consists of analyzing data, information and knowledge, and represent them in the visual form, in a more clear way that can be easily interpreted by the people (Younis and Analysis Citation2015) (Duan et al. Citation2012).
Experiment
The evaluation of the approach occurred in three moments. In the first one, a group of teachers used the framework to verify the didactic potential of the tool. Following they answered an online questionnaire. And finally the teachers rated messages posted by students in VLE.
Questionnaire Application
In order to evaluate the importance and educational scope of this approach, an online questionnaire was elaborated with 4 (four) closed questions and 2 (two) open questions, according to .
Table 2. Questionnaire
Teachers from the CETAM Distance Education School (CETAM EaD) were invited to carry out the experiment using the framework, answering the online questionnaire and classifying students messages. Finally, we verified that 18 (eighteen) teachers accepted to participate in the research, signed the free and Informed Consent Term (TCLE) and answered the questionnaire, where we can see in the result of the answers.
Figure 6. Evaluation results
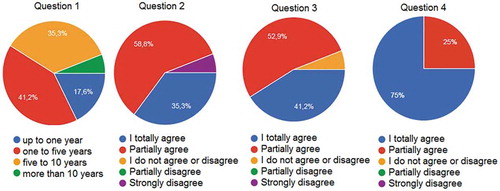
Analyzing the graphs in , we see in Graph 1 that 64.7% of tutors have more than 5 (five) years of experience in distance education. In Graph 2, 55.8% find it useful to visualize the emotional state of a class or student by means of a graph. In Graph 3, 52.9% consider that viewing a TagCloud of a forum can aid in monitoring and Graph 4, 75% believe that viewing a student’s record of emotions can also help with follow-up. Regarding the closed questions, we had the contribution of several teachers, where we can highlight in some answers that may help our research.
Table 3. Tutors answers
Question 5 asks whether there is a relationship between the student’s affective state and his/her performance in the course. For (Bastos, Bercht, and Wives Citation2013), when the teacher can perceive issues related to affectivity in the context of learning, then he can change his didactics or his pedagogical strategies, avoiding students dropping out and evasion.
We verified that most teachers believe that students with personal problems will have difficulties to follow the course, are unmotivated, may favor their dropout and avoidance of the course, and to avoid these problems, it is important the participation of teachers through pedagogical actions
Question 6 asks if the fact that the framework is compatible with various platforms can help with tutoring. Regarding this issue, a good part of the teachers believe that this technology will facilitate the students’ follow-up.
Messages Classification
The experiment was carried out between October and November of 2018, involving 18 (eighteen) teachers of CETAM EaD and had as objective to evaluate the operation of the approach and to classify messages extracted from the VLE.
In the data collection phase, we verified that the 10 (ten) classes posted 7520 messages using the activities proposed in the course (forum, chat, journal and message sent to the tutor), according to .
Table 4. Number of post per activity
In the classification stage, the SentiEduc framework used the SenticNet 5 tool (Cambria et al. Citation2018), composed by a knowledge base of 100,000 English-language concepts, which identifies polarity (positive and negative) and sentiment (Interest, Surprise, Anger, Fear, Admiration, Admiration, Joy, Sadness) of every word.
For the teachers to classify these messages, we used a sample with 95% confidence level, which corresponds to approximately 360 messages. From this sample, a module was constructed in the SentiEduc framework, called “Message Classification” (). To clarify the procedure, the following phrases appear: “Dear teacher for kindness classify 20 messages according to the feeling (positive or negative)”, on this screen are twenty (twenty) messages are presented randomly at a time, so the teacher can classify each sentence according to the sentiment (positive and negative), as we can see in .
Figure 7. Messages evaluation on sentiGraphic framework
In we have some messages extracted from the sample that were classified by the teachers and the SenticNet tool, showing correctness and classification errors. In this table we see the Student’s Message, the teacher’s classification, the SenticNet classification and the result of the Classification (Correct or Error).
Table 5. Students messages classification
In order to compare the data classified by the SenticNet tool and the teachers, we used the most used metrics in the literature in research with Sentiment Analysis: accuracy (A), precision (P), recall (R) and F-measure (F1) TP (True Positive), TN (True Negative), FN (False Negative) and FP (False Positive).
The metrics and formulas used for calculations in our research were described in the paper by (Brzezinski et al. Citation2017). For them Accuracy measures the performance of the methods considering the correctness of all classifications and does not consider the positive, negative or neutral classes A = (TP + TN)/(TP + FP + T N + F N). Precision shows the number of hits in a class, considering all instances classified as belonging to the same class P = (TP)/(TP + F P). Recall measures the relationship between the instances classified as belonging to a particular class and the total number of instances that actually form part of this class R = (T P)/(T P + F N). The measure F1 is the harmonic mean between precision (P) and recall (R), this measure is important to evaluate the performance of the classifiers in single measurement F1 = (2 * P * R)/(P + R). After data tabulation, we obtained the values: Accuracy (73.88%), Precision (81.04%), Recall (87.32%) and F-measure (42.03%), according to the Matrix Confusion presented in .
Table 6. Matrix Confusion
Conclusion
In this paper, we present the SentiEduc framework that uses Multi-Agent System (MAS) to collect and analyze the feelings of texts posted by students in a Virtual Learning Environment. It is possible to identify which students are showing negative feelings, which is the predominant feeling in a class or student, in addition to checking the history of a student’s feelings.
The framework used the SenticNet tool to do the Sentiment Analysis automatically and the results obtained in the evaluation showed that using a knowledge base in the English language is more efficient compared to the Portuguese language in Brazil. The applied questionnaire pointed out that the majority of teachers (58.8%) believe that identifying students’ emotions through their postings can contribute to learning. In the experiment using the students’ posts, we obtained a accuracy of 73.88%, representing significant results for improvements in teaching and learning.
Another important factor is the use of graphics and TagCloud, in addition to using responsive technology, which allows the application to automatically adapt to any device that the user is viewing. The graphs represent the Sentiment Analysis of the texts produced by the students and can help the teachers as they show the students’ mood during the course.
The use of Sentiment Analysis Techniques in educational systems can bring benefits, since we can identify the emotion manifested by students in VLE, understand the affective dimensions influence in the learning both positively and negatively, providing another instrument that can help the tutor or mediator.
Through the partial results we believe that the approach can collaborate with the education, since knowing the emotional state of the students can improve in the accompaniment of the class, because with this additional information the tutor has another resource for making decisions, for example recognize students with dissatisfaction and lack of interest in the course. As future work we intend to transform the framework into an app, for better use by the community. We also want to conduct tests with real-time courses.
References
- Alencar, M. A. S., and J. F. M. Netto (2011). Improving cooperation in virtual learning environments using multi-agent systems and AIML. In: Proceedings 41th Frontiers in Education Conference (FIE). Rapid City, South Dakota, USA, 1, 1713–19.
- Araujo, D. A., S. J. Rigo, C. Muller, and R. Chishman. Automatic information extraction from texts with inference and linguistic knowledge acquisition rules. In: 2013 IEEE/WIC/ACM International Joint Conferences on Web Intelligence (WI) and Intelligent Agent Technologies (IAT), Atlanta, United States, 2013. v. 3. p. 151–54.
- Arias, F., J. Moreno, and D. Ovalle Integration model of E-learning based on pedagogical software agents and collaborative learning environments. Proceedings of WCCE 2009. Bento Goncalves, 2009
- Azevedo, B. T., E. Reategui, and P. A. Behar. 2014. Analysis of the relevance of posts in asynchronous discussions. Interdisciplinary Journal of E-Learning and Learning Objects 10:106–20.
- Bastos, H. P. P., M. Bercht, and L. K. Wives. Proposal of a model and software for identification of social presence indicators in virtual learning environments. D. G. Sampson, P. Isaias, D. Ifenthaler, and J. Michael Spector, ed.. 201. New York: Springer Science+Business Media. 2013. vol. 1. 159–72.
- Becker, K., V. P. Moreira, and A. G. L. Santos. 2017. Multilingual emotion classification using supervised learning: Comparative experiments. Inf. Process. Manage 53 (3):684–704. doi:10.1016/j.ipm.2016.12.008.
- Brzezinski, D., J. Stefanowski, R. Susmaga, and I. Szczech. 2017. Visual-based analysis of classification measures with applications to imbalanced data. arXiv 1704:07122.
- Cambria, E., S. Poria, D. Hazarika, and K. K. SenticNet. 2018. 5: Discovering conceptual primitives for sentiment analysis by means of context embeddings. AAAI, Pp 1795–1802.
- De Loach, S. A., and M. Wood. 2001. Developing muiltiagent systems with agenttool. In: Proceedingsof Lecture Notes in Artificial Intelligence. vol. (2001. Berling: Springer–Verlag.
- Duan, D., W. Qian, S. Pan, L. Shi, and C. Lin: Visa: A visual sentiment analysis system. In: Proceedings of the 5th International Symposium on Visual Information Communication and Interaction, pp. 22–28. Hangzhou, China: ACM (2012)
- Ekman, P. 2011. A linguagem das emocoes (C. Szlak, Trad.). Sao Paulo: Lua de Papel. (Obra original publicada 2003).
- Fayyad, U., G. Piatetsky-Shapiro, and P. Smyth. 1996. From data mining to knowledge discovery: An overview. In Advances in knowledge discovery and data mining, 1–34. England: AAAI Press/The MIT Press. Cambridge, Mass.
- Gibbs, G. 2010. Using Assessment to Support Student Learning. In Leeds Metropolitan University.
- Kucher, K., C. Paradis, and A. Kerren. 2018. The state of the art in sentiment visualization. Computer Graphics Forum,37, Wiley Online Library, pp. 71-96.
- Liu, B. 2015. Opinions, sentiment, and emotion in text. Sentiment Analysis: Mining Opinions, Sentiments, and Emotions.p. 381. Cambridge University Press.
- Liu, J. 1997. The emotional bond between teachers and students. Phi Delta Kappan 79 (2):156–57.
- Longhi, M. T. Mapeamento de aspectos afetivos em um ambiente virtual de aprendizagem. [PhD thesis]. Porto Alegre: Federal University of Rio Grande do Sul; 2011. 253f.
- Longhi, M. T., P. A. Behar, and M. Bercht AnimA-K: Recognizing student’s mood during the learning process. In: WCCE2009-9th IFIP World Conference on Computers in Education, Bento Gonçalves, RS, Brazil. July 27-31, 2009.
- Malheiros, Y., and G. A. P. Lima Uma ferramenta para análise de sentimentos em redes sociais utilizando o senticnet. In: IX Brazilian Symposium on Information Systems, 2013, p. 517–22, Joao Pessoa
- Moreno, A., and T. Redondo. 2016. Text analytics: The convergence of big data and artificial intelligence. Int. J. Interact. Multimed 3 (6), p. 57–64.
- Moubaiddin, A., F. Shawarbeh, and N. Obeid. 2013. Using intelligent agents in e-learning. International Information Institute (Tokyo). Information 16 (10):7325–42.
- Pang, B., and L. Lee. 2008. Opinion mining and sentiment analysis. Foundations and Trends in Information Retrieval 2 (1–2):1–135. doi:10.1561/1500000011.
- Plutchik, P. 2001. A nature of emotions. American Scientis 89 (4):344–50. doi:10.1511/2001.4.344.
- Reis, R. C. D., S. Isotani, C. L. Rodriguez, K. T. Lyra, P. Jaques, and I. I. Bittencourt. 2018. Affective states in computer-supported collaborative learning: Studying the past to drive the future. Computers & Education 120:29–50. doi:10.1016/j.compedu.2018.01.015.
- Roorda, D. L., S. Jak, M. Zee, F. J. Oort, and H. M. Y. Koomen. 2017. “Affective Teacher-Student Relationships and Students‘ Engagement and Achievement: A Meta-Analytic Update and Test of the Mediating Role of Engagement.„ School Psychology Review 46: 239–261. doi:10.17105/SPR-2017-0035.V46-3
- Russell, S., and P. Norvig. 2010. Artificial intelligence: A modern approach. 3rd. Prentice-Hall, Upper Saddle River. chapter 12.
- Shaikh, M. A. M., H. Prendinger, and M. Ishizuka. 2008. Sentiment assessment of text by analyzing linguistic features and contextual valence assignment. Applied Artificial Intelligence 22 (6):558–601. doi:10.1080/08839510802226801.
- Tervakari, S., K. Kirsi, P. Juho, and O. Jukka (2014). Usefulness of information visualizations based on educational data. In: IEEE Global Engineering Education Conference, EDUCON, Turkey
- Tumitan, D., and K. Becker Tracking sentiment evolution on user-generated content: A case study on the Brazilian political scene. In: Brazilian Symposium on Databases, 2013, p. 135–44, Recife.
- Younis, E. M. G., and S. Analysis. 2015. Text mining for social media microblogs using open source tools: An empirical study. International Journal of Computer Applications (0975 – 8887) 112 (5), p. 44–48.