?Mathematical formulae have been encoded as MathML and are displayed in this HTML version using MathJax in order to improve their display. Uncheck the box to turn MathJax off. This feature requires Javascript. Click on a formula to zoom.
ABSTRACT
In this paper, we present a Semi-Supervised Deep Learning approach for anomaly detection of Wind Turbine generators based on vibration signals. The proposed solution is integrated into an IoT Platform as a real-time Workflow. The Workflow is responsible for the whole detection process when a new sample is inserted in the IoT Platform, performing data gathering, preprocessing, feature extraction, and classification. The chosen Semi-Supervised Deep Learning model is a DAE, which builds a normality model using healthy data. The classification consists of comparing the reconstruction error for the computed entry with a normality threshold. The normality threshold is selected through an F1-Score analysis of the reconstruction errors over labeled data. Finally, the Workflow can produce notifications to the users whenever unhealthy behavior is noticed. The ability of the proposed mechanism to detect abnormal behavior in wind turbines on an IoT Platform is evaluated using a case study of real-world healthy and unhealthy data from a Wind Turbine. The solution was able to correctly classify every unhealthy sample and presented a low false-positive rate. Moreover, Workflow results can be improved by conditioning alarm triggering with a windowed-based anomaly accumulation.
Introduction
Reducing carbon emissions and focusing on renewable energy has been a worldwide concern for well over three decades (Weyant Citation1993). Investments in green energy have yielded large growth in the sector both in terms of economy and research opportunities. Wind energy and other renewable energy sources are projected to grow substantially in the coming decades and play major roles in achieving energy sustainability (Porté-Agel, Bastankhah, and Shamsoddin Citation2019). Advancements in gearbox technology contribute in large part to the extension of turbine lifetime and reducing maintenance costs (Qin, Yu-Ting, and Lyu Citation2018). Control systems and condition monitoring are also largely responsible for maintaining the turbines and detecting when failures happen (Menezes et al. Citation2018).
Wind turbine condition monitoring, or fault detection, is a cost-effective solution to reduce maintenance costs and loss of profit caused by the breakdown of components. Fault detection has an even greater impact on the plans to extend the projected life-cycle of the already deployed turbines (Ziegler et al. Citation2018). Older turbines do not benefit from the advances in gearbox engineering and are still prone to constant wear down and damage (Liu and Zhang Citation2020). Various AI solutions have been proposed to predict and detect turbine faults, assisting in diagnosis and allowing technicians to determine when to perform preventive maintenance (Amina, Tayeb, and Mouloud Citation2016; Jiménez, Muñoz, and Márquez Citation2017). Deep ML solutions have become popular in different fields, and their application in wind turbines has obtained promising results (Stetco et al. Citation2019).
Wind turbines were designed with large lifetimes to offset their initial investment. While some are nearing the end of their planned service lives, a large portion still have years ahead of them (Ziegler et al. Citation2018). There are also plans to extend their expected life-cycle. Older turbines do not benefit from the newer gearbox solutions and contain numerous bearings and gears, which are prone to wear down, and damage (Liu and Zhang Citation2020). This results in increased maintenance costs, as these tend to be corrective instead of preventive. Various ML solutions have been proposed to predict and detect turbine faults, assisting in diagnosis and allowing technicians to determine when to perform preventive maintenance (Jiménez, Muñoz, and Márquez Citation2017).
In this paper, we present a solution for real-time wind turbines anomaly detection based on DAE (Bengio et al. Citation2006; Goodfellow et al. Citation2016). Our approach is integrated into an IoT Platform as a workflow that operates during insertion and request operations. First, we generate a normality model through a DAE configured with a GridSearch approach. The normality model is used to build a workflow that gathers necessary data, preprocesses it, extract features, scales them to compose an entry, and classifies it. The classification consists of comparing the reconstruction error for the computed entry to a normality threshold. Finally, the proposed workflow is able to produce notifications to the users whenever abnormal behavior is noticed. In this way, the main contributions of this work are:
• A Feature Extraction process that accounts for FFT features and correlates the vibration signals with rotation speed.
• The building of a DAE model that learns to reconstruct the healthy behavior of Wind Turbines based on vibration data.
• A real-time Workflow for anomaly detection on Wind Turbines that encompasses the feature extraction and the DAE model integrated into an IoT Platform and performs classification over the DAE result using a normality threshold established using the F1-score on labeled data.
The remainder of the paper is organized as follows: Related Work section presents the related works. Architecture section describes the architecture of the proposed approach. Case Study section describes the case study and results of the proposed approach. Discussion section discusses the results. Conclusion section concludes our paper.
Related Work
(Tyagi and Panigrahi Citation2017) propose Supervised Learning solution for Gear Fault Diagnosis based on vibration data using an SVM-ANN Hybrid. Their analysis is focused on teeth faults in Gearboxes, like wear or missing tooth, on a study-case using a variable speed AC motor driving a gearbox shaft. The SVM-ANN Hybrid is supported by a feature extraction process over the vibration data, which extracts both time and spectral domain features using a Discrete Wavelet Transform. Their approach achieved good results when classifying data from four scenarios, one from a healthy scenario, and three from artificially created faults in the gear teeth. Moreover, we differ from their work by using a Semi-Supervised approach, in which, a normality model is built using only data from healthy periods while classifying the data using a normality threshold based on the DAE reconstruction error.
(Mishra, Krogerus, and Huhtala Citation2019) propose a fault detection classifier for Elevator Systems using Deep Autoencoders for feature extraction. The DAE is used here to extract deep features by using the encoder result from the Deep autoencoder. To do so, they use the complete Autoencoder structure during training to fit the weight of the neurons at each layer. Data collected from an elevator system is then fed to the encoder model for feature extraction and then used as input for a random forest model that performs the fault detection task. The usage of deep features as input instead of the measured data provided a lower false-positive rate in the final fault detection system.
(Shao et al. Citation2017) propose a novel DAE feature learning method for rotating machinery fault diagnosis, with the objective of eliminating the dependence on signal processing techniques and diagnosis experience. The DAE uses raw vibration data as input. The autoencoder loss function is substituted by a correntropy function to eliminate background noise and enhance feature learning. Correntropy is a nonlinear local similarity measure. The proposed method achieved a average accuracy in detecting faulty signals on a motor test bench. ML solutions for fault diagnosis take advantage of the correlation between their inputs to classify or detect patterns in data related to faults. This detection can sometimes be more accurate than the analysis of a domain expert. However, experts warn against using raw time-domain vibration data for fault analysis. The data extracted does not represent well the types of failure modes expected in rotating machines. Features extracted from the frequency domain have a better representation of the expected faults and should be used over raw vibration data.
(Nie, Liu, and Xie Citation2020) an autoencoder-based solution named denoising stacked feature enhanced autoencoder with dynamic feature enhanced factor for fault diagnosis of wind turbines. In their approach, feature enhancement relies on a competition and enhancement policy that prioritizes neurons with higher activation value, suppressing the neurons with lower ones. This approach aims at increasing the specialization of the neurons, leading the DAE to extract discriminative features. The dynamic factor definition is based on the diversity between each of the features. It aims at avoiding the need for experts to determine a fixed value for every feature, eventually making too few or too many features to be enhanced by the algorithms. The presented approach performed better when compared to other solutions for the problem of distinguishing between different health conditions. Their work also relies on an autoencoder model; however, they focus on distinguishing between specific health conditions, while ours focuses on learning normal behavior and detecting any deviation from the healthy operation on the input.
(Galloway et al. Citation2016) present a sparse autoencoder for fault detection in tidal turbines. Spectrograms are generated from overlapping 1-s slices from vibration samples. Their DAE is then trained with spectrograms, and features are learned and represented in their hidden layers. The authors compare the DAE classification accuracy with three feature-based classification algorithms, SVM, decision trees, and KNN, all obtaining over classification accuracy, but not surpassing
. Their DAE algorithm used two-layer configurations, one layer or two layers, with both achieving over
accuracy in the pre-training phase. After training, the authors perform fine-tuning of parameters and achieve
accuracy in both configurations.
Architecture
The solution proposed in this work is envisioned to handle a continuous data flow, which enables it to achieve a more reliable and adaptable analysis of the WT performance. Our workflow relies on data preprocessing and on an ML model to analyze the incoming data. The design of the architecture aims at allowing almost any composition of processing algorithms to be applied to data, while it is inserted or retrieved from the platform. In the following, we describe the solution details and the proposed architecture.
SmartData and IoT Platform
The process begins with the data collection by the WT monitoring systems. The data are then converted to the SmartData format and sent to an IoT Platform. SmartData (Fröhlich Citation2018) is a format where data are enriched with metadata to make it self-contained in terms of semantics, spatial location, timing, and trustfulness. Of particular interest in this work is their self-contained semantic, which provides the necessary information for a proper training and detection process. For instance, the spatial location and timing information allows us to properly identify the state of a specific Wind Turbine at a given moment, even with different monitoring systems. Using SmartData, our proposed solution also reaches for the associated cloud-based platform operated by UFSC, which includes data analysis and visualization tools.
The data analysis is supported by the IoT Platform through a mechanism that submits data to a set of workflows for both insertion and recovery requests. A workflow is a tool to process data by executing data analysis algorithms that take place during insertions or data requests to the platform. A workflow, for instance, can make use of ML algorithms during data insertions to find correlations and build models to describe the behavior of the system through the incoming data or simply apply data transformations or unit conversion.
On the Fly Workflow
Workflows can analyze data, apply filters, correct, transform, store new data on a secondary time-series, create a time-series, or register logs and send notifications. Moreover, the IoT Platform provides support to several data-mining tools, providing the necessary resources for data analysis, physical model description, and ML integrated with notifications and alarm triggering. Thus, it is possible to integrate a real-time monitoring system, with the IoT Platform using workflows to analyze incoming data and produce notifications whenever data exceed the thresholds for normal behavior. Workflows, then, hand over a useful real-time tool for the management of the system (e.g., maintenance triggering for high severity errors).
The workflow proposed in this paper was conceived to operate during the data insertion on the IoT Platform. The design defines a triggering SmartData, i.e., a type of SmartData to be inserted into the platform that, when processed by the workflow, triggers a process that will verify the data and classify it as normal or abnormal. Once the verification process is triggered, the workflow gathers data from secondary time-series that compose the model or are necessary for the verification process. The process of combining data from different sources may incur adopting a strategy for data alignment. In this case, as SmartData is enriched with a high-resolution timestamp and geographical location, data are gathered from the same monitored object (which is identified by its geographical position) and is temporally aligned. Temporal alignment considers a time window where signals can be used to compose information that describes a moment of the monitored object. With all necessary data collected, the workflow prepares the buffers that will be used for the further steps of its execution. In case not all the data are available, the workflow discards the input data and generates a notification on the SmartData that will be inserted informing the platform that it was not possible to classify the SmartData because of the absence of complementary information.
Once all the necessary information is available, the workflow runs the data buffer preprocessing data. Typical data preprocessing may include the application of filters, the transformation of vibration signals through an FFT, the verification of the confidence of the measured value for each of the signals, and the application of domain-specific information to aggregate the incoming data for the next steps of the classification process. Next, the proposed workflow applies feature extraction algorithms to the collected data. Feature extraction algorithms can be applied to extract extra information from the incoming data or simply to generate parameters that represent certain information, e.g., to extract different features (i.e., characteristics) from the FFT resultant of the vibration data.
Since the different features can have different ranges of values, the extracted features are submitted to a data scaling process. This process is used to avoid features naturally having a higher impact over ML models. A typical approach to scale data is to apply the Min-Max normalization (Shalabi, Shaaban, and Kasasbeh Citation2006) to make the values of all features vary between 0 and 1, according to their minimum and maximum values. Different approaches can be used to define the minimum and maximum values for each of the features. For instance, an expert could define the minimum and the maximum values for each signal. Alternatively, these values can be extracted from the data-set that is used to build the models. However, the minimum and maximum values applied during the training phase must be applied to the classification process to avoid disrupting the performance of the model (i.e., precision, accuracy, recall, and others).
With the necessary data processed and the features to be analyzed already defined, the next step of the proposed workflow is to classify the input as normal or abnormal. This process consists of submitting the processed input (i.e., set of collected data and extracted features) to an ML algorithm that will decide whether the data represent a normal behavior given the trained ML model and the normality thresholds. Once the incoming SmartData has been classified, the workflow verifies whether to produce a notification and its possible severity level. Abnormal SmartData coupled, or not, to a notification structure are sent back to the platform so that the SmartData can be inserted into the databases and the notification can be handled to the domain owners.
The behavior of a Wind Turbine can eventually change throughout its lifetime. Such a phenomenon can be described as concept drift. As the workflow accounts for persistence, ML model’s performance can be constantly monitored, and the model can be updated in case an adherence threshold such as the false-positive rate is exceeded.
Deep Autoencoder
To enable the proposed workflow to detect anomalies, a Deep Autoencoder (Bengio et al. Citation2006) ML mechanism is applied for data classification. An Autoencoder (Goodfellow et al. Citation2016) is an unsupervised learning technique with two main components, an Encoder function and a Decoder function
. The Encoder
and Decoder
are usually represented as symmetrical components regarding the number of neurons used in them. The Encoder is a structure that reduces the dimensionality of the input into a latent representation. This encoded format is then fed into the Decoder which then rebuilds the input. In this way, an Autoencoder result can be represented as
. An Autoencoder can be evaluated based on the amount of information loss it implies. This information loss is usually expressed in terms of the reconstruction error
. The notion of reconstruction error can be used as the Autoencoder optimization function, for instance, using the Mean Square Error (MSE) or the Mean Absolute Error (MAE).
Stacking multiple layers of Encoding and Decoding yields a Stacked Autoencoder, or Deep Autoencoder. DAE (DAE), or Stacked Autoencoders, stands out as a useful ML tool when addressing anomaly detection, especially for its ability to learn without requiring labeled data to be available. In this sense, this work employs a Deep Autoencoder Model as the ML step of the On the Fly Workflow.
The DAE predictions provide the workflow with reconstruction error measures for a real-time classification to be engaged. It is expected that, for input samples that are similar to those used for training, the DAE, which we trained with healthy periods’ data, will present reconstruction error results close to the ones observed during training. Thus, a threshold-based classification can be established to provide Healthy-Unhealthy behavior distinguishing.
Case Study
Building a proper on-the-fly workflow can provide the necessary information to achieve predictive maintenance, a goal of many wind farms around the world. This section describes in detail the process of building an On the Fly Workflow from scratch, using as a use case a data-set from a real Wind Turbines’ monitoring system.
Instrumentation Setup
The case study presented here is built upon vibration signals collected from nine Radial accelerometers and two Axial accelerometers instrumented in the gearbox and bearings of a Wind Turbine following both ISO 16079–2 (ISO/IEC Citation2020) and ISO 10816–21:2015 (ISO/IEC Citation2015) standards. depicts the instrumentation details for each of the signals. Each accelerometer is sampled synchronously for 2 s under a 20 kHz sampling rate. Sampling is performed every 6 hours to avoid storage and bandwidth issues. Each sample is encapsulated in the SmartData format and sent to the IoT Platform. The SmartData format guarantees a straightforward interpretation of the data at the IoT Platform. Thus, the SmartData format requires the data to be represented in an equivalent SI unit (i.e., for vibration data) and coupled with high-resolution timestamps and geo-location. High-resolution timestamps and geo-location enable further analysis on the IoT Platform coupling the data-set with external information, such as textual maintenance logs and weather information, by matching them in space and time. Moreover, timestamping the data points also enables converting the information from the time domain to the frequency domain via an FFT for spectral analysis of different signals from the same turbine.
To support the vibration analysis, a phase reference signal was sampled through a proximeter. The sampling is done synchronously with the vibration data under a 4 kHz sampling rate. This information is used to calculate the rotation speed of the Wind Turbine bearings relative to each of the accelerometers instrumented. The relation of the Phase Reference data to the data will be further explained in the next section.
Two sampling periods were selected to build the ML model for the On the Fly Workflow. The first period consists of over 2 months of data collection prior to a severe fault at the inner bearing raceway, which required the bearing replacement. The second sampling period corresponds to over 6 months of data collection after the aforementioned maintenance. Thus, providing data from both healthy and unhealthy scenarios. The main idea is to use the healthy scenario data to train the proposed ML model in an unsupervised approach while using the unhealthy scenario data to validate the anomaly detection capabilities.
Preprocessing and Feature Extraction
To increase the effectiveness of the ML models, preprocessing techniques such as scaling and filtering can be applied to the data-set. Moreover, we employ feature extraction techniques over the frequency domain representation of the vibration data. The preprocessing and feature extraction processes are the following:
(1) DC Component Removal and Band-Pass Filters: Filtering Vibration data can yield better features and further improve the system performance. The first step is to remove the DC component by subtracting the mean value from the vibration signal (Qihe Citation2019). The next step is to apply a Butterworth Band-Pass filter (Freitas, Nishioka, and Mourão Citation2019) to remove low importance ranges from the analysis. The result of the filtering step can be seen in Figure B1 and B2.
(2) Rotation Speed: Wind Turbines are naturally exposed to high variations in wind speeds. These variations impact the rotation speed of the Gearbox bearings, and subsequently the vibration data collected. To avoid the necessity of various ML models for each range of rotation speed, we apply a relation between the rotation speed of the Gearbox bearings, calculated from the reference signal sampled, to correlate the vibration data and the rotation speed. First, we need to calculate the reference rotation speed in Hz. To do so, the following algorithm is used:
(a) Define a limit as
.
(b) Classify each data point in the phase reference data-set using as follows:
(c) Now, count sequential data points in which the limit has not been breached. Save the result in a list
.
(d) Calculate the sampling rate of the data-set.
(e) Normalize each value in the list using
.
(f) Convert the elements in from period to frequency as
.
(g) Return the average value of the list.
Next, we need this reference value along the constructive data of the Wind Turbine to get the rotation speed based on the number of teeth on each bearing. Then, each rotation speed is correlated with each respective signals by multiplying the signal by the rotation speed. The result of this process can be seen in Figure B3.
(3) FFT: This step is the transformation of the sample from the time domain to the frequency domain, which is done using an FFT. Using the frequency domain for further feature extraction provides us with a different visualization of the information, as for many rotation machines like Wind Turbine Gearboxes, the frequency domain visualization exposes frequencies of interest along with their harmonics. The FFT transformation of the raw data presented in Figure B1 and the preprocessed data presented in Figure B2 is depicted in Figure B4.
(4) Feature Extraction: Each of the eleven vibration data still yields 20000 entries in the frequency domain. Feature extraction is applied to simplify the input data for the ML models, therefore, reducing its overall complexity. This process is based on the feature extraction methods for vibration data recommended by Caesarendra et al. in (Caesarendra and Tjahjowidodo Citation2017). The resulting feature-set contains eleven features, totaling 121 entries for the ML model. The following describes each of the eleven features extracted:
(a) Min: Is the minimum of the FFT sample:
(b) Max: Is the maximum of the FFT sample:
(c) Average: Is the average of the FFT sample.
(d) RMS: Is the Root Mean Square of the FFT sample.
(e) Variance: Is the variance or dispersion of the FFT sample around their reference mean value (Caesarendra and Tjahjowidodo Citation2017):
(f) Skewness: Is the measure of the asymmetry of the probability-density of the FFT sample:
(g) Kurtosis: Is a measure of whether the data are peaked or flat relative to a normal distribution (Yiakopoulos, Gryllias, and Antoniadis Citation2011):
(h) Shape Factor: Refers to a value that is affected by an object’s shape but is independent of its dimensions (Yiakopoulos, Gryllias, and Antoniadis Citation2011):
(i) Crest Factor: It is defined as the ratio of the peak value to the RMS value with the DC component removed (Yiakopoulos, Gryllias, and Antoniadis Citation2011):
(j) Energy: Is the energy of the signal in the frequency domain.
(k) Spectral Entropy: is a measure that reflects the uniformity of the power spectrum density (PSD) (Tian et al. Citation2017). In this paper we follow Vallat implementation (Vallat Citation2020), defined to be the Shannon entropy of the power spectral density (PSD) of the data:
(5) Data Scaling: Min-Max scaling (Shalabi, Shaaban, and Kasasbeh Citation2006) is applied to the extracted features to enable fair weighting of each of the features. These scale to the range .
Deep Autoencoder Model
After the preprocessing step, the 11 features of each of the 11 vibration signals are concatenated, creating samples composed of 121 features. As depicted in section 4.1. The Deep Autoencoder implemented here follows the description provided in Section 3.3, where the DAE learns from the healthy data-set, which is composed of 584 samples from over 6 months of monitoring. Healthy data-set was split in a 70/30 ratio, using % for training and
% for validation. Finally, the unhealthy data-set is composed of 89 samples from over 2 months of monitoring (see Section 4.1).
As the DAE is trained to minimize reconstruction errors from the healthy period, it is expected that the Encoding-Decoding process will lend higher reconstruction errors for samples that differ from the samples presented during training, and smaller reconstruction errors for samples similar to the ones presented during training.
To achieve a DAE architecture capable of capturing the main features of the healthy data-set, and subsequently lend small reconstruction errors, a GridSearch (Goodfellow et al. Citation2016) approach for hyper-parameter selection was employed. GridSearch implements an exhaustive search through a parameter grid structure, scoring each hyper-parameter combination according to a user-defined metric. In this sense, the employed GridSearch searches through an activation function, layers’ configuration, kernel initializer, kernel optimizer, and kernel regularizer. The layers’ configuration has been explored over the dimensionality reduction at each layer up to the latent representation, assuming a symmetrical Encoder-Decoder structure. Moreover, dropout layers were also added between each layer, varying the dropout intensity in the range {0,0.5} (Baldi and Sadowski Citation2013). The remaining hyper-parameters have been evaluated considering the available options at the selected library. The negative mean absolute error was the scoring metric selected to evaluate the model’s performance. Through this metric, the algorithm selects the highest score (score closer to 0) as the best result.
The best configuration yielded by the GridSearch scored 0.037 Mean Absolute Error and composed of Hyperbolic Tangent (tanh) as the activation function for all layers, Adam optimizer, Glorot Uniform for weight initialization, and L2 regularization using a factor of 0.001. The selected configuration was composed of seven layers, one input layer and three encoding layers, where the last encoding layer, the latent representation or code, is shared between the encoder and decoder, three decoding layers, and one output layer. Table A2 presents the number of neurons in each layer. The resulting hyperparameters were used to train the final model using an early stopping metric to evaluate the model learning.
Several approaches can be used when selecting the classification threshold . The simplest one is selecting the maximum reconstruction error presented in the training data-set:
. Other techniques select the threshold based on the mean and standard deviation
of the reconstruction errors presented by the training data-set:
, where
is a user-defined parameter similar to traditional outlier detection. Nevertheless, without data from unhealthy scenarios, the quality of the threshold selection, and subsequently from the DAE, cannot be assured. For instance, selecting the maximum reconstruction error from the data-set provides 100% of precision for the classification; however, it can incur a low recall rate.
In this paper, data from the same Wind Turbine, prior to a failure in one of the Wind Turbine Bearings (see Section 4.1), is used to evaluate the DAE model and to perform the threshold selection. We implement the threshold selection following the idea proposed by Aygun and Yavuz (Aygun and Yavuz Citation2017). The method proposed by the authors requires a data-set of unhealthy samples to evaluate a set of thresholds, selecting the one with the highest accuracy for the trained DAE. The method consists of using the mean absolute error metric alongside the standard deviation of the reconstruction errors to establish a set of 100 thresholds to be tested in the range
.
The algorithm implemented here is an adaptation of the aforementioned method. First, the thresholds limited are extended to values in the range , and we select the threshold based on the F1-Score (C. J. Van Citation1979) instead of the accuracy.
Results
In this scenario, all metrics reached their best measures at the same threshold of , achieving
% of accuracy,
of precision,
% of recall, and
% of F1-score. Figure B5 presents the proposed algorithm results, presenting the evaluated thresholds and the respective metric.
The reconstruction errors for the Healthy data-set are depicted in green on Figure B6. For this data-set, the DAE model presented an and a
for healthy signals. Thus, the threshold selection ranged from
to
. Only two samples presented reconstruction errors greater than
, with
and
. The median of the reconstruction errors for the Healthy data-set was
. The smallest reconstructing error was
. Figure B7 presents the reconstruction error over the samples ordered by time.
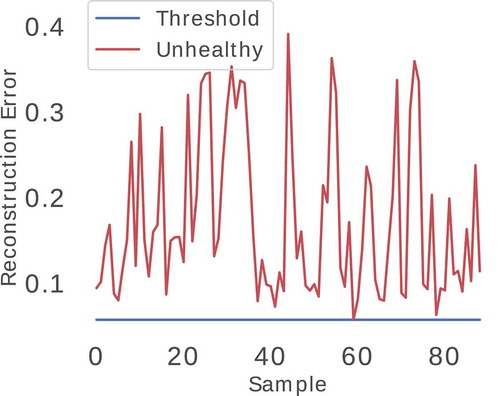
The reconstruction errors for the Unhealthy data-set are depicted in red on Figure B6. For this data-set, the DAE model presented an and a
. The maximum reconstruction error presented by the model for unhealthy data-sets was
, a value close to twice the mean reconstruction error for this data-set. Moreover, the median of the reconstruction errors was
and the smallest reconstructing error was
, and no samples were misclassified. Figure B8 presents the reconstruction error over the samples ordered by time.
Discussion
The presented solution aims at operating in real-time once it is integrated into the IoT Platform that stores sensed data. The data collected by the monitoring systems according to the instrumentation of the wind turbines (Section 4.1) is sent to the IoT Platform and processed by the workflows prior to the insertion on the databases. The presented workflow collects complementary data, preprocesses and extracts features from it (Section 4.2), and classifies them according to a DAE whose model was generated from healthy data and threshold was selected to distinguish better between healthy and unhealthy signals (Section 4.3).
The model generation relies on a GridSearch approach to determine the best configuration for the layers, dropout, activation function, optimizer, kernel initializer, and regularizer, and the threshold definition takes advantage of the known unhealthy data to make an evaluation of the generated f1-score. The adoption of the f1-score metric for the threshold definition balances the model's ability for both healthy and unhealthy data detection. A shortcoming of this approach is that the present workflow does not achieve a fully correct classification for healthy data. In fact, the chosen threshold achieved an accuracy of %, a precision of
%, and a recall of
%.
Finally, when the presented workflow detects abnormal behavior, it can produce notifications that alert the user. However, as indicated by the results (Section 4.4) and earlier discussed in this section, the presented model can classify healthy data as unhealthy. The workflow can use a severity value accumulated during a predefined time-window to avoid a misclassification to generate a notification. This strategy is based on the fact that healthy data misclassification is rare and sparse, as depicted on Figure B7. In this way, by comparing the severity value with a predefined severity threshold, the workflow can select whether to notify the user or not, which can reduce the number of false-positive notifications.
Conclusion
In this paper, we present an approach for anomaly detection in Wind Turbine generators based on Deep Learning analysis of the vibration signals. The proposed solution operates as a workflow that is integrated into an IoT Platform and, thus, can deal with real-time collected data.
The model generation relies on a GridSearch approach to determine the best configuration for the layers, dropout, activation function, optimizer, kernel initializer, and regularizer. Once these configurations are defined, the threshold definition process focuses on establishing the best threshold value for the evaluation metrics (i.e., accuracy, precision, recall, and f1-score). Finally, the selected threshold is the one that presents the highest f1-score.
The normality model is used to build a workflow that gathers necessary data, preprocesses it, extracts features, and scales them to compose an entry to classify with the normality model. The classification is done by comparing the reconstruction error for the computed entry to the normality threshold.
The detection model achieved an accuracy of %, a precision of
%, and a recall of
%. Moreover, the proposed workflow can produce notifications to the users whenever abnormal behavior is noticed.
Disclosure Statement
The authors declare no conflict of interest.
Additional information
Funding
References
- Amina, B., A. Tayeb, and D. Mouloud. 2016. Intelligent open switch fault detection for power converter in wind energy system. Applied Artificial Intelligence 30 (9):886–98. doi:https://doi.org/10.1080/08839514.2016.1277294.
- Aygun, R. C., and A. G. Yavuz. 2017. “Network anomaly detection with stochastically improved autoencoder based models.” In 2017 IEEE 4th International Conference on Cyber Security and Cloud Computing (CSCloud), New York, NY, USA, 193–98.
- Baldi, P., and P. Sadowski. 2013. “Understanding dropout.” In Proceedings of the 26th International Conference on Neural Information Processing Systems - Volume 2, NIPS’13, Red Hook, NY, USA, 2814–2822. Curran Associates Inc.
- Bengio, Y., P. Lamblin, D. Popovici, and H. Larochelle. 2006. “Greedy layer-wise training of deep networks.” In Twentieth Annual Conference on Neural Information Processing Systems, NIPS’06, Cambridge, MA, USA, 153–60. MIT Press.
- C. J. Van, R. 1979. Information Retrieval. 2nd ed. USA: Butterworth-Heinemann.
- Caesarendra, W., and T. Tjahjowidodo. 2017. A review of feature extraction methods in vibration-based condition monitoring and its application for degradation trend estimation of low-speed slew bearing. Machines 5 (4):21. doi:https://doi.org/10.3390/machines5040021.
- Freitas, F. L., M. H. Nishioka, and G. L. Mourão. 2019. “Supervised machine learning applied to diagnosis of wind turbine gearbox using vibration harmonic distortion feature.” In International Conference on Condition Monitoring, Diagnosis and Maintenance CMDM 2019 (5th edition), Bucharest, Romania.
- Fröhlich, A. A. 2018. SmartData: An IoT-ready API for sensor networks. International Journal of Sensor Networks 28 (3):202. doi:https://doi.org/10.1504/IJSNET.2018.096264.
- Galloway, G. S., V. Catterson, T. Fay, A. J. Robb, and C. Love. 2016. “Diagnosis of tidal turbine vibration data through deep neural networks.” In European Conference of the Prognostics and Health Management Society 2016, Bilbao, Spain.
- Goodfellow, I., Y. Bengio, A. Courville, and Y. Bengio. 2016. Deep learning, vol. 1. MIT Press, Cambridge, USA.
- ISO/IEC. 2015. Mechanical vibration — Evaluation of machine vibration by measurements on non-rotating parts — Part 21: Horizontal axis wind turbines with gearbox. Technical Report. International Organization for Standardization, Geneva, Switzerland.
- ISO/IEC. 2020. ISO 16079-2:2020 - Condition monitoring and diagnostics of wind turbines — Part 2: Monitoring the drivetrain. Technical Report. International Organization for Standardization, Geneva, Switzerland.
- Jiménez, A. A., C. G. Muñoz, and F. G. Márquez. 2017. Machine learning for wind turbine blades maintenance management. Energies 11 (1):13. doi:https://doi.org/10.3390/en11010013.
- Liu, Z., and L. Zhang. 2020. A review of failure modes, condition monitoring and fault diagnosis methods for large-scale wind turbine bearings. Measurement 149:107002. doi:https://doi.org/10.1016/j.measurement.2019.107002.
- Menezes, E., J. Novaes, A. M. Araújo, and N. S. B. Da Silva. 2018. A review on wind turbine control and its associated methods. Journal of Cleaner Production 174:945–53. doi:https://doi.org/10.1016/j.jclepro.2017.10.297.
- Mishra, K. M., T. R. Krogerus, and K. J. Huhtala. 2019. “Fault detection of elevator systems using deep autoencoder feature extraction.” In 2019 13th International Conference on Research Challenges in Information Science (RCIS), Brussels, Belgium. IEEE. Doi: https://doi.org/10.1109/rcis.2019.8876984.
- Nie, X., S. Liu, and G. Xie. 2020. A novel autoencoder with dynamic feature enhanced factor for fault diagnosis of wind turbine. Electronics 9 (4):600. doi:https://doi.org/10.3390/electronics9040600.
- Porté-Agel, F., M. Bastankhah, and S. Shamsoddin. 2019. Wind-turbine and wind-farm flows: A review. Boundary-Layer Meteorology 174 (1):1–59.
- Qihe, L. 2019. “Integration of vibration acceleration signal based on LabVIEW.” Journal of Physics: Conference Series 1345: 042067, Guangzhou, China. Doi: https://doi.org/10.1088/1742-6596/1345/4/042067.
- Qin, Z., W. Yu-Ting, and S.-K. Lyu. 2018. A review of recent advances in design optimization of gearbox. International Journal of Precision Engineering and Manufacturing 19 (11):1753–62. doi:https://doi.org/10.1007/s12541-018-0203-z.
- Shalabi, L. A., Z. Shaaban, and B. Kasasbeh. 2006. Data mining: A preprocessing engine. Journal of Computer Science 9 (2):735–39.
- Shao, H., H. Jiang, H. Zhao, and F. Wang. 2017. A novel deep autoencoder feature learning method for rotating machinery fault diagnosis. Mechanical Systems and Signal Processing 95:187–204. doi:https://doi.org/10.1016/j.ymssp.2017.03.034.
- Stetco, A., F. Dinmohammadi, X. Zhao, V. Robu, D. Flynn, M. Barnes, J. Keane, and G. Nenadic. 2019. Machine learning methods for wind turbine condition monitoring: A review. Renewable Energy 133:620–35. doi:https://doi.org/10.1016/j.renene.2018.10.047.
- Tian, Y., H. Zhang, X. Wei, H. Zhang, L. Yang, S. Zheng, and Y. Shi. 2017. Spectral entropy can predict changes of working memory performance reduced by short-time training in the delayed-match-to-sample task. Frontiers in Human Neuroscience 11. https://doi.org/10.3389/fnhum.2017.00437
- Tyagi, S., and S. K. Panigrahi. 2017. An SVM—ANN hybrid classifier for diagnosis of gear fault. Applied Artificial Intelligence 31 (3):209–31. doi:https://doi.org/10.1080/08839514.2017.1413066.
- Vallat, R. 2020. “Spectral Entropy.” Online article. Accessed 2020July-20. https://raphaelvallat.com/entropy/build/html/generated/entropy.spectral_entropy.html
- Weyant, J. P. 1993. Costs of reducing global carbon emissions. Journal of Economic Perspectives 7 (4):27–46. doi:https://doi.org/10.1257/jep.7.4.27.
- Yiakopoulos, C. T., K. C. Gryllias, and I. A. Antoniadis. 2011. Rolling element bearing fault detection in industrial environments based on a K-means clustering approach. Expert Systems with Applications 38 (3):2888–911. doi:https://doi.org/10.1016/j.eswa.2010.08.083.
- Ziegler, L., E. Gonzalez, T. Rubert, U. Smolka, and J. J. Melero. 2018. Lifetime extension of onshore wind turbines: A review covering Germany, Spain, Denmark, and the UK. Renewable and Sustainable Energy Reviews 82:1261–71. doi:https://doi.org/10.1016/j.rser.2017.09.100.
Appendix A. Tables
Table A1. Gearbox instrumentation details
Table A2. Grid search: Best layers configuration
Appendix B
Figures
Figure B1. Raw vibration sample
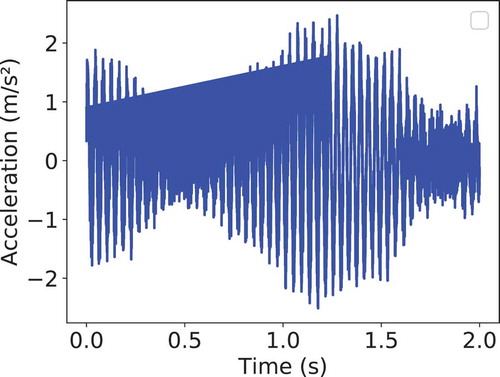
Figure B2. Vibration sample after DC and band-pass filters
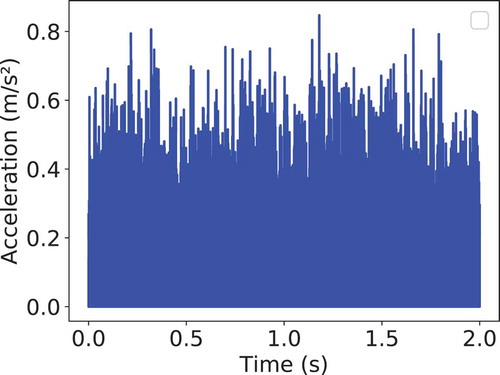
Figure B3. Vibration sample after filtering and rotation speed multiplication

Figure B4. Vibration sample FFT with and without preprocessing
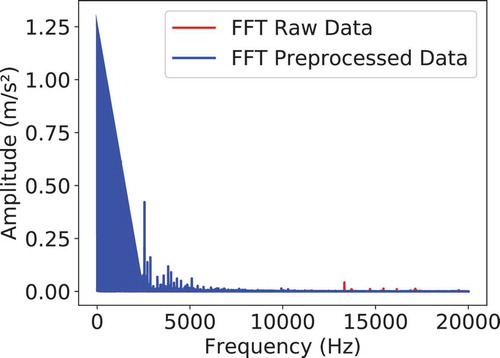
Figure B5. Threshold selection and the respective metrics
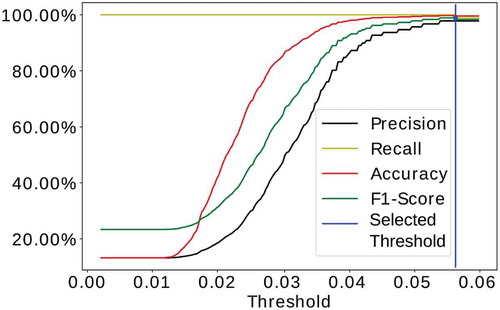
Figure B6. Reconstruction error distribution for healthy and unhealthy data-set
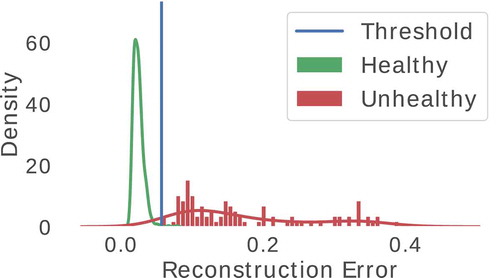
Figure B7. Reconstruction error of Healthy data-set over time
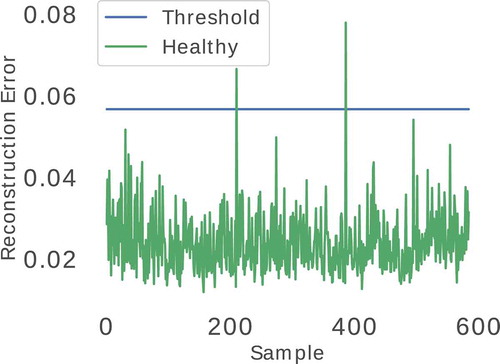
Figure B8. Reconstruction error of Unhealthy data-set over time