
ABSTRACT
Parkinson’s disease (PD) is a progressive neurodegenerative disorder that affects a sizable fraction of the population and degrades the quality of life. Levodopamine (L-Dopa) is the first-line treatment drug for PD and remains ubiquitously used. However, the drug response prediction of L-Dopa is still an exigent task and there is an unresolved absence of any substantial biomarkers for a robust prediction of L-Dopa response for a robust prediction of L-Dopa response in Parkinson’s disease. The present study intends to develop a robust prediction model to predict the L-Dopa drug response in PD using machine learning approaches. This work intended to utilize the MJFF Levodopa Response Study data of Parkinson’s subjects with conclusive pre-clinical and clinical assessments for resolving the significantly impending task of drug response prediction. The problem was identified as a classification task which employed four different supervised machine learning classification algorithms for data analysis and predictive learning. The underlying task of predictive classification of drug response classified the responders as “good” and “bad,” based on comprehensive analysis on the selected feature space which identified the participants with an improvement in the symptoms as “good” responders and the ones with degraded or no improvement in the symptoms as “bad” responders. The decision tree’s (classification and regression tree) classification accuracy was 88.89% (area under receiver operating characteristics curve 0.9) for predicting levodopamine response. The presence or absence of the symptoms along with Unified Parkinson’s Disease Rating Scale (UPDRS) scores and Hoehn and Yahr scale (H and Y) scores were recognized as the most distinguishing feature subset. The research stipulates the required preliminary evidence to the adaptive advancement of decision trees as an illuminating technique that can facilitate the prediction of the drug treatment response for Parkinson’s disorder, however, an extended effort is necessary to provide efficient predictive performance.
Introduction
Parkinson’s disorder (PD) is a persistent, progressive neurodegenerative disorder impacting around seven to ten million people across the globe (Ritika et al. Citation2020; McGuire et al., Citation2012). It is a multi-systemic condition that arises due to the dysfunction in various neural networks of the brain (Khoo et al. Citation2013; Luo et al., Citation2014; Erik et al. Citation2014). PD is characterized by various motor and non-motor symptoms – with tremors, gait impediments, and muscle rigidity among the most common motor symptoms, and cognitive disorders and depression-like mental health issues among the most common non-motor symptoms (Jankovic Citation2008; Brooks and Pavese, Citation2011; Khoo et al., Citation2013). Levodopamine (L-Dopa) remains the most sought-after drug to ameliorate the symptoms of PD to date (Poewe et al. Citation2010). As a result of its persistence in the treatment of the disorder, L-Dopa remains a benison after more than 50 years of its discovery and is hitherto used in the primary treatment of symptomatic PD, hence, acting as the first-line medicament in the course of PD treatment (Rao et al. Citation2006; Thanvi et al. Citation2004). Despite its high response rates and being a highly prescribed drug for the treatment of PD, the subject of its responsiveness remains a prominent issue in the field of medicine. Being valuable in the inceptive phase of the dysfunction, various shortcomings also follow the administration of the drug comprising of dopa resistant motor (posture instability) and non-motor (cognitive impairment) symptoms along with drug-induced side effects including psychosis and dyskinesia as the most perilous disorders. Due to this underlying disparity between an individual’s response to the treatment and the absence of any clinical biological markers, which can immaculately predict the treatment response of L-dopa, the exigency of L-Dopa drug response prediction is perceptible.
PD has an estimated heritability of 0.41 and is mostly regarded as an autosomal disorder (Hamza and Haydeh Citation2010). The mutations in LRRK2 (PARK8) and SNCA (PARK1 = 4) account for the autosomal dominant form of PD whereas, the mutations in the Parkin (PARK2), ATP13A2 (PARK9), PINK1 (PARK6), and DJ-1 (PARK7) are responsible for the autosomal recessive variant of the disorder (Klein and Westenbergeret Citation2012). In response to the genetic mutations, several potential neurochemical biomarkers like orexin (GFAP), α-Synuclein (α-syn) and Apolipoprotein A1 (ApoA1) have also been hypothesized to aid the modification and detection of therapeutic response to PD. Further, the severity of PD can be directly related to D3R dopamine receptor along with MHPG as a substantial biomarker to distinguish the various forms of PD and CSF concentrations of DOPAC and DOPA which when notably depleting, can facilitate the detection of at-risk individuals within the healthy population. In addition to this, the prolonged increase in accumulation of the catecholaldehyde metabolite of dopamine, DOPAL, can result in the decrease of dopamine levels as it can engender the death of dopaminergic neurons. However, after all the substantial progress in theorizing PD with the genetic heritability, the early onset of familial PD is reported in only 10–15% of PD cases. This clearly states that the disorder has more idiopathic cases, evincing a major contribution of non-genetic factors (Emamzadeh and Surguchov Citation2018). PD, therefore, has a complex pathology, where the amalgamation of genetics, epigenetics, and environmental factors play a significant role in determining the onset of the disease as well as its therapeutic response.
The existing studies elucidating the structural and functional imaging of PD subjects have insinuated the association of palladium and thalamus regions along with caudate and putamen regions with the correlation in PD and L-Dopa response as neuroimaging shreds of evidence. Although the putamen and caudate regions are less prominent contributors when compared to the palladium and thalamus region, this PD-related covariance pattern evaluation itself has unearthed the relationship between regions of basal ganglia and L-Dopa response. The reduced functional connectivity magnetic resonance imaging (fcMRI) between striatum, palladium, and thalamus corresponds to a degraded L-Dopa response. There has been an identified association of the nonconformity in the BG connectivity patterns mapped using resting state functional magnetic resonance imaging (fMRI) with the disparate degrees of response to L-Dopa therapy. This is in line with the rationale that the remapping of functional connectivity in the brain translates into the clinical effects of dopamine. Relatively higher connectivity is exhibited by the networks linked to cognitive motor inhibition as opposed to lower connectivity of networks linked to reactive motor inhibition with an improved dopamine response. Moreover, there is relatively stronger connectivity in-between BG structures having improved dopaminergic response (Harith et al. Citation2017). The above discussed factors evidence their large medical significance in the robust prediction of L-Dopa treatment response in PD. Machine learning is a scientific endeavor in the ambit of artificial intelligence pertaining to the study and development of systems that can train on large scores of data (Graziella et al. Citation2012). Recent shreds of evidence are suggestive of the fact that response predictive analysis in psychiatry can benefit from the pervasive use of machine learning at an individual level (McGuire et al. Citation2012). It is maintained that these methods can be very helpful in informing and assisting medical experts to make more efficient objective choices before the treatment, thereby leading to increased trial success rates and higher response rates. More effective predictive analytics could be beneficial for PD, in particular, because of the clinical heterogeneity, high prevalence, and societal costs associated with the disease (Lang Anthony and Andres Citation1998). Machine learning techniques are being extensively used in the field of medicine to identify drug responsiveness toward a particular disease. These measures are rising to prevalence due to their noninvasive approach, decreased costs, and reduced risk of inflicting side effects. However, trivial work has been done in mapping the L-Dopa responsiveness in PD patients also, due to the lack of any evident biomarkers for a robust prediction of the drug response. Further, no study has shown up which resorts to finding the response of PD patients to L-Dopa drug using demographic, clinical, and sensor data.
The current study is an attempt to redefine the technique of predictive analysis with respect to PD. The present study aims to employ machine learning algorithms using the pretreatment demographics, clinical assessments, and sensor data for a robust prediction of the L-Dopa treatment response in PD subjects. Further, the study aims at classifying the predicted response as “Good” or “Bad” to give an overview of the long-term administration of the drug for the subject and to give a convenient and summarized result for further facilitating the decision of drug administration.
shows the basic idea behind the proposed model. The intention of selecting the most accurate model remains to classify the treatment responders as an overall “Good” or “Bad,” based on a comprehensive assessment of the collected data. Moreover, the study brings about a comparative analysis between various machine learning models deployed to accomplish the above-mentioned task. It further aims at selecting the most accurate and reliable machine learning algorithm for accomplishing the task in an efficient manner. The study emphasizes the use of pre-clinical information and diagnostic data for drug response prediction which can give deeper insights into the effect of the drug at a very early stage, preventing patients from any unresponsive, aggressive or inappropriate medication.
Figure 1. Overview of the proposed pipleline.
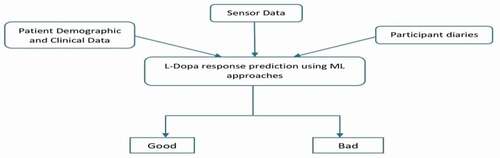
As it is, the whole concept of using machine learning approaches for predictive analysis is new to the industry and with not many attempts, it remains a comparatively unexplored field in the area of unconventional science. The present study, being one of a kind, works on similar grounds of predictive analysis and incorporates it in a profound neurodegenerative disorder in an attempt to improve the quality of life of the affected population. The study adds a novel approach of using pre-clinical data as the data input to predict the drug response at an extremely early stage to save the patient from further ordeal. The current work, being first of its kind, presents a fresh and novel outlook on the use of predictive analysis by deploying it in drug response prediction for PD. However, just like any other unique invention, the present research does come with some limitations. Firstly, the study restricts itself to deploying the supervised machine learning algorithms for the predictive classification of the drug response. Whereas, with the increasing scope of the unsupervised machine learning algorithms, they present a huge potential for better and more efficient response prediction. Also, the usage of pre-clinical and diagnostic information as the foundation of drug response prediction might not be the best approach for the task as it can be a little misleading on judging the condition of the subject, very early in the disorder. Furthermore, as the study remains limited to the diagnostic information, it also remains rudimentary with its dataset as it lacks neuroimaging data and advanced genetic information which might bring about some correlation of subjects to PD. The above-listed limitations, present the currently existing constraints in the study. However, as the study is an all-together new and innovative step toward integrating different sciences, it does set up the foundation of a potent breakthrough in therapeutic science.
Materials and methods
MJFF dataset
The current study employed the synapse dataset from the Levodopa Response Study conducted by Michael J. Fox Foundation (MJFF) for Parkinson’s Research (Bionetworks, Citation2020). The study comprised of 28 PD subjects (66.5 ± 8.8 years, 19 males) enrolled from two different clinical sites in Boston, Massachusetts, and New York City, New York in the United States. All the participants were mostly in the preliminary stage of the disorder, being at least in the second stage of PD. The subjects were assessed as a part of the pre-clinical diagnosis, based on symptoms experienced by them so far, in the course of the disorder. The subject evaluation also included the H and Y score (Hoehn and Yahr scale) and the UPDRS score (Unified Parkinson’s disease rating scale) assessment along with the demographic data evaluation. The study was originally intended to understand the viability of monitoring the PD motor fluctuations and symptoms at home, which was later utilized in the present research to predict the L-Dopa treatment response in PD. The subjects volunteered for a 4-day trial study which included both in-clinic and at-home activity assessment. The study tried to map the fluctuations in the UPDRS scores of the patients by comparing the “ON” state of medication with the “OFF” state of medication, in the 4-day trial program. The “on” state of medication implied the action of taking their medication by the patient (administration of L-Dopa), whereas the “off” state denotes the patient’s response when the patient does not take the medication.
The day-one of the study evaluated the patient response based on a set of activities that were conducted during in-clinic assessment when the patients were required to be present in an “on” state of medication while wearing all the required sensors. The activities included all the sections, that is, parts I, II, III, and IV of the MDS-UPDRS (Movement Disorder Society-Sponsored Revision of the Unified Parkinson’s Disease Rating Scale), which is a more sensitive scale as compared to the traditional UPDRS. Subsequently, the patients were required to perform a set of additional motor tasks based on activities of daily living (ADL). The activities were continuously evaluated by clinicians to measure the severity of symptoms as well as the disorder and side effects (if any). Following these evaluations, the patients were sent home, still wearing the sensors.
The following two days of the study, that is, Day 2 and Day 3, the participants were required to continue with their daily activities being at home. On the last day of the 4-day response trial study, the sequence of events from the first day was followed, with the patients being in an “off” state of medication. The study being completely voluntary, a continuous feedback was also taken from the subjects (Bionetworks, Citation2020). The current study employed the previously discussed levodopa response trial study dataset and additionally mapped the drug response by mapping the difference between the UPDRS scores of participants in the “on” state and “off” state of medication which is further used for robust prediction model to classify the treatment response as “good” or “bad.”
Computational methods
The recent advancement in high-throughput sequencing technologies has made it possible for the scientific community to have access to large scores of datasets. With the growth of these datasets and the extensive use of internet services, researchers were able to put large amounts of data online for scientific purposes. This paved the way for the scientific community to search for novel methods to analyze, interrogate and process data thereby infer associated knowledge and make new inferences. Because of its ability to handle large datasets, and to make predictions on them through accurate statistical models, machine learning has spread rapidly and became extensively used in the scientific community, particularly in computational biology. Machine learning is a computational approach based upon statistics, implemented in software, able to discover hidden patterns in a dataset and to make reliable statistical predictions about similar new data. The basic idea behind machine learning is that a computer algorithm is trained to learn behavior presented as part of previous experience or dataset to the extent that an outcome can be produced by the computer algorithm when it is presented with a never-before-seen dataset or situation.
ML offers three broad categories of learning: Supervised – the target is known and learning is based on the data that contains both the inputs and the desired outputs, Unsupervised – the data is unlabeled and the learning is done by finding structures in the data by grouping or clustering data points, and Reinforcement – based on the idea of reward learning where the machine takes actions to maximize the cumulative reward. Depending upon the complexity and the nature of the scientific problem, these learning techniques are extensively used in the scientific community to provide a robust solution to real-life problems. A machine learning problem requires three pivotal steps to ensure a solution – understanding and manipulating the data to remove inconsistencies, training and testing various machine learning models on the data, and selecting the most efficient model and fine-tuning it to improve its efficacy. Machine learning models are the statistical algorithms that perform various mathematical calculations and manipulations on the data to provide significant inferable results. The recent advancement in machine learning has ushered in new and more robust algorithms that can yield surprising results. With the increase in more and more robust algorithms, machine learning has seen extensive use in numerous computational biology problems allowing scientific researchers to unearth knowledge about various facets of biology.
The current problem required to predict the responsiveness of an individual to a drug. Analyzing the dataset, the availability of labeled data, and the suitability of the data with the various statistical measures in machine learning, supervised learning was chosen to be the best resort in finding the optimal solution to the problem. Moreover, an individual can respond to a particular drug positively or negatively. Therefore, the responsiveness can be seen as a categorical measure classifying a patient’s responsiveness into two categorical values. Considering the need for classification in the current task, classification algorithms were deemed to be suited best for the problem. Of all the classification algorithms four potent algorithms were chosen to be used for predicting levodopa response – decision tree (a tree-like model of decisions and their possible consequences), logistic ridge regression (a regression-based algorithm which suitably deals with multi-collinearity in data), random forest (Zlotnik et al., Citation2015) (a collaborative training machine taken as an ensemble of decision trees), and support vector machines (a supervised algorithm based on the idea of finding a hyperplane that best divides a dataset into two classes). The main reasons behind choosing these algorithms were their extensive use in computational biology and strong potential to yield robust results. Another reason for resorting to only a set of four selected algorithms out of a large number of potential classifiers was that training only a specific set of algorithms was computationally more time and cost effective as compared to using all the algorithms to solve the problem.
The proposed pipeline
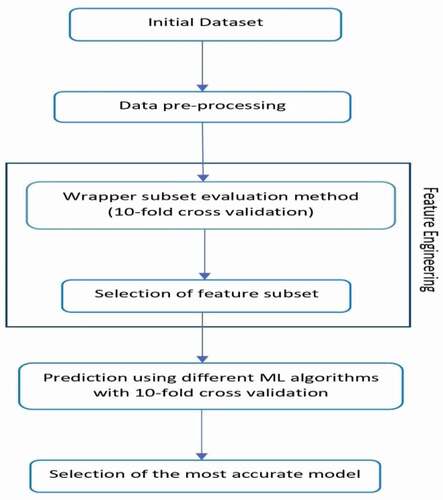
The underlying objective of the research remains the classification of the L-Dopa treatment response as “good” or “bad” in PD subjects. Hence, the problem definition robustly determines the objective as a classification task in the expanse of supervised machine learning approaches. Furthermore, the pipeline included several steps of data processing applied to the synapse data to conclusively classify the therapeutic response of the drug. shows a detailed structure of the proposed pipeline. The dataset comprised of participant demographics, clinical data like UPDRS, and other scores along with symptom assessments, which then followed the sequence of several machine learning tasks. The data preprocessing was performed as the initial step of implementing machine learning algorithms consisting of tasks like noise removal, filling up of missing values, and label encoding for enhancing the overall functional efficacy of the classification algorithms. Subsequently, the difference between the UPDRS scores was calculated for all the subjects while in “on” and “off” medication states.
Figure 2. Research methodology.
Training and testing
The data was subjected to the process of feature selection for which the Wrapper Subset Evaluation method was employed. The method assessed the features by deploying a training stratagem and detected the attribute sets which enhanced the overall predictive efficiency (Ron and George Citation1997). The bidirectional variant of the feature selection algorithm was applied which searched the feature space performing continuous feature evaluation by the means of an exhaustive approach. This method extended an optimized solution by implementing a greedy hill-climbing algorithm enhanced with a back-propagation algorithm that probes into the attribute set and identifies a feature subset. To overcome the issues like overfitting, which are prominent in classification tasks and to increase the computation of more generalized outcomes, the wrapper subset evaluation method was employed with 10-fold cross-validation. Further, this generated a feature subset in addition to the number of times they were selected (varied from 0% to 100%) out of the 10 folds. The attributes, which were iteratively selected across every fold, exhibited a selection weight of 100%, whereas, the attributes which were not ever chosen carried a selection weight of 0%. The resulting feature space generated for the current study was selected from the set of features selected across each fold of the 10 folds. The subset of features comprised principally of features with uniformly good performance across all the 10 folds (25% or more) of the cross-validation framework. Subsequently, the outcome was less vulnerable to overfitting and was more generalized to new inputs. The final set of features in the dataset were filtered on the basis of the feature space generated by the wrapper subset evaluation method. The dataset was divided into two mutually exclusive datasets – training and testing dataset. The splitting of the dataset was performed in such a way so as to avoid the possibility of underfitting and overfitting. The training dataset contained 70% of the data while the testing dataset contained 30% of the data. The initial dataset was reshuffled several times before splitting into training and testing datasets to ensure uniform distribution of data in both the datasets. The training and testing datasets remained the same for all the machine learning algorithms.
The study employed four distinct supervised machine learning algorithms: decision tree, logistic ridge regression, random forest, and support vector machines. The models were first tuned by altering the training parameters so as to improve the efficacy. For SVM, the grid search cross-validation method was used with 10-folds cross validation to find the optimal parameters for training the model (‘C’: 100, ‘gamma’: 0.0001, ‘kernel’: ‘rbf’). Similarly, the parameters for Logistic Regression were optimized (penalty = ‘l2ʹ, max_iter = 1000, solver = ‘bilinear,’ dual = True) so as to provide maximum efficacy with the given data. The parameters of Random Forest and Decision Tree algorithms were optimum at default. All the models were trained using the training dataset and validated against the testing dataset with 10-fold cross validation for performing a comparative analysis in the implementation of these assorted algorithms. The 10-fold cross-validation has been regarded as an improved estimate for assessing the implemented accuracy and efficiency of the different classifiers for datasets with a small sample size (Kim Jae, Sharma, and Ryan Citation2015; Hawkins et al. Citation2003). The confusion matrices were calculated in order to evaluate the predictive ability of the models. Successively, the classification accuracy and area under the receiver operating characteristics (ROC) curve (AUC) of the employed algorithms were evaluated to select the most reliable and the most suitable classifier for the predictive analysis of therapeutic response.
Results and discussion
Participant characteristics
The characteristics of the subjects were calculated based on the various clinical and pre-clinical assessments across the selected feature subset. Amongst the 28 participants studied, 17 patients showed a “good” response and hence were characterized as good responders to the drug therapy, leaving the remaining 11 participants as bad responders who are prone to drug-induced side effects and inhibitory drug-resistant mechanisms. There were no notable peripheral differences that were discovered in their demographic characteristics including age, heights and weight, symptoms and PD stages, and clinical scoring comprising of UPDRS scores and H and Y scores ().
Table 1. Demographic and clinical characteristics along with clinical scores of the good and poor responders to L-Dopa in PD subjects
H and Y, Hoehn and Yahr score; UPDRS, Unified Parkinson’s Disease Rating Scale score.
Prediction of treatment response
The classification accuracy of the CART decision tree was 88.89% (AUC 0.9) for the prediction of L-Dopa drug response in PD (). The feature space generated by the Wrapper subset evaluation method comprised of patient demographics including gender, age, height, weight, along with the presence or absence of symptoms and quantification of clinical scores comprising of: the most affected side, gait impediments, posture instability, tremors, Bradykinesia, disrupted sleep, freeze of gait, dyskinesia and rigidity, followed by UPDRS and H and Y scores. SVM, Logistic Ridge Regression and Random Forest classification accuracies (and AUCs) were calculated as follows: 55.56% (AUC 0.575), 77.78% (AUC 0.8) and 66.67% (AUC 0.7), respectively. shows a comparison of AUCs of the various applied classifier algorithms for the prediction of L-Dopa response.
Table 2. Classification accuracy and area under receiver operating characteristics (ROC) curve (AUC) performance of the classifiers for predicting L-Dopa response
Figure 3. Comparison of area under the curve (AUC) performance of the classifiers on levodopamine response. ROC, area under receiver operating characteristic (ROC) curve.
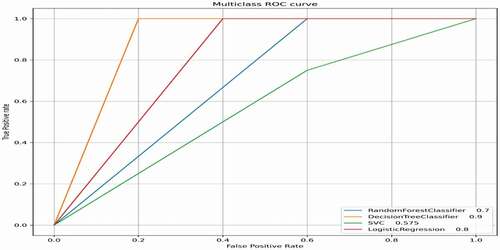
exhibits the confusion matrix of the performance of the classifiers on the L-Dopa response. The employed classification algorithms furnish a decision curve acknowledging the distinct alternatives for the tradeoff between the false-positive rate and sensitivity (1-sensitivity). An increased sensitivity generally results in an increased false-positive rate, making the two directly proportional to each other and varying the best tradeoffs with respect to the usage.
Table 3. Classification of L-Dopa response (confusion matrix)
Response (+), good responder; Response (-), poor responder
Discussions
The current study, in the purview of research, is the first of its kind to apply machine learning approaches for an effective prediction of the L-Dopa drug response in PD. The study incorporates demographic data along with symptoms and clinical scores for the predictive analysis. The indagation led to the unearthing of a potentially useful approach for the development of substantial biomarkers for a robust prediction of the drug response. The feature space used for training the machine learning models, incorporated the patient demographics, the clinical scores including the UPDRS scores and the H and Y scores, and the presence or absence of various symptoms associated with the disorder. The subset of features that were identified to increase the overall predictive performance included gender, age, height, weight, the most affected side, gait impediments, posture instability, tremors, Bradykinesia, disrupted sleep, freeze of gait, dyskinesia and rigidity, followed by UPDRS and H and Y scores. It was noted that the physical measures including, dominant_hand, upper_arm_length, lower_arm_length, thigh_length, shank_length significantly reduced the predictive performances of the machine learning models.
It is obvious that other than the diagnosis, the presence or absence of the symptoms can also describe any significant effect (positive or negative) of the treatment on the patient. Therefore, the symptomatic analysis of a patient has been widely associated with treatment response monitoring and prediction for PD (He et al. Citation2018). In addition to this, the outcomes of the current study have evinced the relevance of the symptomatic analysis in the prediction of L-Dopa drug response in PD. As noted, very few outlining differences were identified in the demographics and clinical scorings of the patients. This included the mean weight and mean UPDRS 3 scoring. It was noted that the good responders were on the heavier side whereas the poor responders were on the lighter side of the weighing scale. It is also worth mentioning that the mean UPDRS 3 scoring of the poor responders surpassed the mean UPDRS 3 scoring of the good responders with a good margin. It was identified that an increase in the UPDRS 3 score resulted in the bad response of the patients to the L-Dopa treatment. The symptomatic analysis also included the presence or absence of signs of dyskinesia in the participants, enhancing the overall predictive potential of the model. Dyskinesia is a class of involuntary movement disorders that develop as a side-effect of long-term L-Dopa drug administration. It is observed in PD patients with prolonged administration of L-Dopa which leads to muscle spasms, reduced magnesium levels, and weakened muscles (Ritika et al. Citation2020; The Michael J. Fox Foundation for Parkinson’s Research, Parkinson’s Disease Citation2020). Hence, the presence of dyskinesia can act as a significant indicator of the patient response to the drug therapy which was further evident in the outcomes of the current research. Subsequently, (Movement Disorder Society Task Force on Rating Scales for Parkinson’s Disease Citation2003) discussed the clinical scores like the UPDRS scores and the H and Y scores which have been largely instrumental in diagnosing and assessing the severity of PD. Hence, along with the disease progression, such clinical scores can also potentially act as an insightful clinical marker for the prediction of the treatment response in PD. The present study comprised of such clinical scores as inputs, which made the results insightful and improved the overall performance of the model, making it more effective and accurate in its predictive performance. The performance of the models was cumulatively evaluated using the accuracy and the roc_auc metrics. The overall performance of the models was identified in the following order – Decision Tree, Logistic Regression, Random Forest, SVM. Significant improvement was shown by the Decision Tree after fine-tuning the parameters.
The relevance of the patient demographics in the drug response prediction is presently uncertain. As per genetic information, neuroimaging data, and other environmental factors no other diagnostic information for PD was used in the predictive analysis conducted in the current study. However, such factors do exhibit a substantial predictive potential for drug response in PD. Further, there is an underlying potential in the neural structural and functional imaging of the brain to map any variation in the connectivity patterns of the brain which can further be of great importance in the drug response prediction. Also, the genetic data can identify the potential risk of any ill effects that the patient is prone to, which when added to the input data can enhance the overall predictive ability of the model. Additionally, PD being a commonly occurring clinically heterogeneous disorder, any additional information has great potential in a more efficient clinical prediction. However, the current model also provides a substantial basis to predict the treatment response using all attributes. Even so, with the current cost of genetic screening and neuroimaging with a reduced risk of L-Dopa treatment, the availability of such data might not add to the existing clinical purpose.
The unavailability of appropriate neurobiological markers for PD and other neurodegenerative disorders has led to a more potential opportunity for computer science technology. With the current development of different machine learning approaches like decision trees (CART) with adequate classification accuracy and confidence levels, the extent of possibilities and abilities of computer science in aiding medical treatment is substantial. The underlying belief of the present research determines ways in which machine learning approaches using multi-dimensional and multi-collinear clinical data have an infinite scope of positively influencing the ambits of predictive treatment and analysis in medicine.
Nevertheless, the study, being a first of its kind is not completely infallible and has a few limitations to its investigation. First of all, the size of the sample was quite small (<250) leading to a high probability (80–90%) of change in AUC by at least 0.15. The results and outcomes of the present should be reproduced on a larger sample size (>250) with an amplified feature space including more biological/cognitive attributes (Douglas et al. 2003). Secondly, the extent of the experimentation carried out in the research was not in fact in relation to the analysis carried out. As a result, the duration of experimentation was quite short, which needs to be replicated for a prolonged duration to closely monitor the fluctuations and its effects over a longer period of time. Also, the scope of the experiment was limited to sensor data and the clinical scores, which can further be outstretched to other biological and neurochemical assessments. Thirdly, the place of conducting the experiments was restricted to two locations within the United States, thus, making the generalization of inferences an abstruse task across various ethnic groups and across different locations. Lastly, the evaluation of drug treatment response for PD subjects was with their respective prescribed medication which can again limit the generalization of results across various different pharmacological and non-pharmacological treatments of PD, requiring further investigation for determining their respective predictive potential.
The present research gives evidence to show that using the pre-clinical diagnostic information like patient demographics along with clinical scoring and symptomatic analysis, the L-Dopa treatment response in PD can be efficiently predicted on an individual level. Objectively, the study provides a primary basis to the interpretation of CART as an insightful technique and an efficacious implementation of machine learning approaches that have a huge predictive potential and can be used in accurate prediction of treatment response in PD. The further application of such methods in medical science would require greater levels of accurate classification performance than reported in the current study. Moreover, the recent prevalence of predictive analysis of therapeutic response has aided the medical experts and clinicians in controlling and eschewing any possible ill effects of a drug that could potentially apprise the clinicians for developing efficient and enhanced clinical care measures. Hence, such studies are a significant attempt in making extensive efforts in amalgamating computer science technology with medical science.
Conclusion
Parkinson’s Disease is a neurodegenerative disorder, which affects people of age group 50 and above, across the globe. Levodopamine (L-dopa) is known as the first in-line therapeutic used for the disorder but has been known to cause various side-effects like psychosis, dyskinesia, etc., undermining the treatment effect of the drug itself. The study is an attempt at predicting drug response using machine learning approaches. It identified the problem as a classification task in order to classify the treatment response as “Good” or “Bad.” The study showed that the pre-clinical information and diagnostic data along with clinical scoring can give valuable insights into the disease prediction and evaluation tasks such as that in the present study. The results further presented CART as the most accurate of the four employed machine learning algorithms which identified the potential of the algorithm as a valuable approach for classification problems.
Acknowledgments
The authors would like to express their sincere thanks to The Michael J. Fox Foundation for Parkinson’s Research for providing the “Levodopa Response Trial Wearable Data” from the “Levodopa Response Study” for modeling and classification.
Disclosure Statement
No potential conflict of interest was reported by the author(s).
Correction Statement
This article has been republished with minor changes. These changes do not impact the academic content of the article.
References
- Bionetworks, S., (2020). Sage Bionetworks”, Synapse. [Online]. [Accessed: 30 January 2020], synapse ID: syn20681023. https://www.synapse.org/#!Synapse:syn20681023/wiki/
- Brooks, D. J., and N. Pavese. 2011. Imaging biomarkers in Parkinson’s disease. Progress in Neurobiology 95 (4):614–28. doi:https://doi.org/10.1016/j.pneurobio.2011.08.009.
- Emamzadeh, F. N., and A. Surguchov. 2018. Parkinson’s disease: Biomarkers, treatment, and risk factors. Frontiers in Neuroscience 12: 612. eCollection 2018. doi:https://doi.org/10.3389/fnins.2018.00612.
- Erik, Z., R. Maud, A. Elodie, C. Tim, S. Johan, B. Evelyne, P. Christophe, and G. Gaëtan. 2014. Mapping track density changes in nigrostriatal and extranigral pathways in Parkinson’s disease. Neuroimage 99:498–508.
- Graziella, O., P. Y. William, F. M. Andre, S. Giuseppe, and M. Andrea. 2012. Using support vector machine to identify imaging biomarkers of neurological and psychiatric disease: A critical review. Neuroscience and Biobehavioral Reviews 36 (4):1140–52.
- Hamza, T. H., and H. Payami. 2010. The heritability of risk and age at onset of Parkinson’s disease after accounting for known genetic risk factors. Journal of Human Genetics 55 (4):241–43. doi:https://doi.org/10.1038/jhg.2010.13.
- Harith, A., W. Chengyuan, H. Jonathan, F. Thomas, L. Patricia, D. V. Enrico, Y. Tarek, J. Marjan, H. Marwan, B. Timothy, et al. 2017. L-Dopa responsiveness is associated with distinctive connectivity patterns in advanced Parkinson’s disease. Movement Disorders 32 (6):874–83. doi:https://doi.org/10.1002/mds.27017.
- Hawkins, D. M., C. Basak, and D. M. Mills. 2003. Assessing model fit by cross-validation. Journal of Chemical Information and Computer Sciences 43 (2):579–86. doi:https://doi.org/10.1021/ci025626i.
- He, R., X. Yan, J. Guo, Q. Xu, B. Tang, and Q. Sun. 2018. Recent advances in biomarkers for Parkinson’s disease. Frontiers in Aging Neuroscience 10: 305. eCollection 2018. doi:https://doi.org/10.3389/fnagi.2018.00305.
- Jankovic, J. 2008. Parkinson’s disease: Clinical features and diagnosis. Journal of Neurology, Neurosurgery & Psychiatry 79 (4):368–76. doi:https://doi.org/10.1136/jnnp.2007.131045.
- Khoo, T. K., J. Y. Alison, W. Gordon, S. C. Duncan, T. O. B. John, J. B. David, A. Roger, and D. J. B. Barker. 2013. The spectrum of nonmotor symptoms in early Parkinson disease. Neurology 80 (3):276–81.
- Kim Jae, W., V. Sharma, and N. D. Ryan. 2015. Predicting methylphenidate response in ADHD using machine learning approaches. International Journal of Neuro-psychopharmacology 18 (11):1–7. doi:https://doi.org/10.1093/ijnp/pyv052.
- Klein, C., and A. Westenberger. 2012. Genetics of Parkinson’s disease. Cold Spring Harbor Perspectives in Medicine 2 (1):a008888. PMID: 22315721; PMCID: PMC3253033. doi:https://doi.org/10.1101/cshperspect.a008888.
- Lang Anthony, E., and M. L. Andres. 1998. Parkinson’s disease. New England Journal of Medicine 339 (16):1130–43.
- Luo, C. Y., S. Wei, C. Qin, Z. Zhen, C. Ke, C. Bei, Y. Jing, P. L. Jian, H. Xiao, G. QiYong, et al. 2014. Reduced functional connectivity in early-stage drug-naive Parkinson’s disease: A resting-state fMRI study. Neurobiology of Aging 35 (2):431–41.
- McGuire, L. I., H. P. Alexander, D. O. Christina, M. W. Jason, E. A. Nigel, M. Gary, A. Mary, W. H. Mark, C. Byron, G. W. Robert, et al. 2012. Real time quaking-induced conversion analysis of cerebrospinal fluid in sporadic Creutzfeldt-Jakob disease. Annals of Neurology 72 (2):278–85.
- The Michael J. Fox Foundation for Parkinson’s Research, Parkinson’s Disease (2020). Dyskinesia. [online]. [Accessed 1 August 2020]. https://www.michaeljfox.org/news/dyskinesia
- Movement Disorder Society Task Force on Rating Scales for Parkinson’s Disease. 2003. The unified Parkinson’s disease rating scale (UPDRS): Status and recommendations. Movement Disorders 18(7): 738–50. PMID: 12815652. doi:https://doi.org/10.1002/mds.10473.
- Poewe, W., A. Angelo, C. M. Z. Jan, R. B. Pierre, and V. François. 2010. Levodopa in the treatment of Parkinson’s disease: An old drug still going strong. Clinical Interventions in Aging 5:229–38.
- Rao, S. S., A. H. Laura, and S. Amer. 2006. Parkinson’s disease: Diagnosis and treatment. American Family Physician 74 (12):2046–54.
- Ritika, A., H. R. Bullah, A. Prabhakar, A. Jatain, S. B. Bajaj, and V. Jaglan. 2020. Parkinson’s disease: Taking a Step towards Homogenizing Machine Leaning and Medical Science. International Journal of Psychosocial Rehabilitation 24 (4):6558–69. doi:https://doi.org/10.37200/IJPR/V24I4/PR2020466.
- Ron, K., and H. J. George. 1997. Wrappers for feature subset selection. Artificial Intelligence 97 (2):273–324.
- Thanvi, B. R., and T. C. N. Lo. 2004. Long term motor complications of levodopa: Clinical features, mechanisms, and management strategies. Postgraduate Medical Journal 80 (946):452–58. doi:https://doi.org/10.1136/pgmj.2003.013912.
- Zlotnik, A., M. M. Juan, S. S. Rubén, and G. A. Ascensión (2015). Random forest-based prediction of Parkinson’s disease progression using acoustic, ASR and intelligibility features. In the proceedings of ‘Sixteenth Annual Conference of the International Speech Communication Association. Interspeech, Dresden, Germany: 503–07.