
 ?Mathematical formulae have been encoded as MathML and are displayed in this HTML version using MathJax in order to improve their display. Uncheck the box to turn MathJax off. This feature requires Javascript. Click on a formula to zoom.
ABSTRACT
Accurate prediction of crop prices assists farmers to decide the best time to sell their produce so as to get maximum benefit and assists Government for post-harvest storage and management of the produce so as to stabilize the price volatility throughout the year. At the same time, pricing of crop depends on various factors including the amount of cultivation, demand of consumers, climate, etc. Hence, the prediction of crop prices is a challenging and important problem. Inspired from this, in this study, we have proposed two additive hybrid methods (Additive-ETS-SVM, Additive-ETS-LSTM) and five multiplicative hybrid methods (Multiplicative-ETS-ANN, Multiplicative-ETS-SVM, Multiplicative-ETS-LSTM, Multiplicative-ARIMA-SVM, Multiplicative-ARIMA-LSTM) to predict the monthly retail and wholesale price of three most commonly used vegetable crops of India, namely, tomato, onion, and potato (TOP). The obtained results are compared with two most promising statistical models, three leading machine learning models and five hybrid methods existing in the literature. Extensive statistical analyses of simulation results considering mean absolute error (MAE), symmetric mean absolute percentage error (SMAPE), and root mean square error (RMSE) confirm the superiority of the hybrid methods in predicting the TOP prices.
Introduction
Vegetable crops play a vital role in India’s economy, enhancing income of rural households. Cultivation of fruits and vegetables is a labor intensive task and hence generates a lot of employment in the rural areas. India has diverse kinds of soil and climate, across several agro-ecological regions that make production of a wide variety of horticultural crops possible. Vegetables, fruits, tubers, roots, ornamental plants, medicinal, aromatic, flowers, condiments, spices, mushrooms, and plantation crops form the major part of the total produce in agricultural domain of the country (available at: www.businessworld.in, accessed August 17, 2020).
Tomato, onion, and potato (TOP) crops are considered as a regular food commodity across India. However, the management of TOP crops is at high risk because they are only abundantly available in short spells, which is coupled with the problems of storage, transportation and the consequent post-harvest losses. Hence, it poses a challenge to marketing the produce (available at: www.nhb.gov.in, accessed March 20, 2020) and wide price fluctuations in the market. The volatility of TOP crop prices causes a chaos in the households of this country (Kumar and Joshi Citation2016). Operation Green is a project introduced by the Ministry of Food Processing Industries of Government of India with the target to stabilize the supply of TOP crops in India by ensuring their availability throughout the year without price volatility (Kumar et al. Citation2012).
Statistical forecasting models have been widely used to assist decision maker to plan the future more efficiently and effectively. In a developing country like India, proper planning by using efficient forecasting is of utmost importance for the sustainable growth of the country. Considering these facts, a systematic study is carried out to model and predict the wholesale and retail price of TOP crops in India. Traditional linear statistical models, viz., moving average (MA), autoregressive (AR), autoregressive integrated moving average (ARIMA), autoregressive moving average (ARMA), exponential smoothening, etc., can be used to predict the TOP prices. However, the linear statistical models work under the assumption of linear correlation structure of time series data. Hence, these models are quite competent in capturing the linear patterns existing in time series data. However, these models often fail to handle the nonlinear patterns equally well (Zhang Citation2003). In order to handle the nonlinear patterns efficiently, nonlinear machine learning models like long short-term memory (LSTM), artificial neural network (ANN), and support vector machine (SVM) have been increasingly considered in the literature. Both linear statistical-based methods and nonlinear machine learning based methods have achieved unparalleled success in their respective linear and nonlinear time series forecasting (TSF) domains. However, the application of nonlinear machine learning methods to linear time series and statistical based methods to nonlinear time series often produces poor forecasts. Additionally, when a series contains both linear and nonlinear patterns, neither the linear statistical models nor the nonlinear machine learning models can provide satisfactory result (Zhang Citation2003). However, the application of hybrid models by integrating linear statistical models with nonlinear models provide a better chance to capture the underlying combined linear and nonlinear correlation structure of time series. Therefore, a variety of hybrid methods by integrating linear statistical models with nonlinear machine learning models have been developed.
Zhang (Citation2003) introduced the concept of integrating linear and nonlinear models for TSF. Zhang assumed the time series as an addition of two components, namely, linear and nonlinear component. In his approach, at first ARIMA model is applied to a time series to capture the linear component of the time series. Then, the predictions from ARIMA model are obtained, which are subtracted from the original time series to attain the residual series. The obtained residual series is considered as nonlinear, and ANN is used to attain the forecasts on residual series. The final forecasts are calculated by adding ARIMA forecasts and ANN forecasts. Using the same concept, Faruk (Citation2010) proposed a hybrid ARIMA-ANN model, which is trained using an optimized conjugated algorithm and used for forecasting the water quality time series.
Khashei and Mehdi (Citation2011) presented another variant of hybrid ARIMA-ANN model with improved forecasting accuracy. In their model, first the ARIMA model is fitted directly to the given time series and a single data value is forecasted. Then the time series, ARIMA forecasted values, and the forecast error are given as input to ANN to compute the future values. Khashei and Mehdi’s (Citation2011) model provided better forecasting accuracy than Zhang’s (Citation2003) model, ARIMA and ANN.
Contrasting to the additive hybrid models, Wang et al. (Citation2013) assumed the time series data to be a multiplication of two components, namely, linear and nonlinear component. In their hybrid model, the ARIMA model is applied on the time series data and ARIMA forecasts are calculated. Then, the residual series is computed by dividing ARIMA forecasts from original series. Considering the obtained residual series as nonlinear, ANN is used to obtain the forecasts on nonlinear component. The final forecasts are computed by multiplying ARIMA forecasts with ANN forecasts. Wang et al.’s (Citation2013) model has shown improved forecasting accuracy than Zhang’s (Citation2003) model in three time series. However, the method can’t be applied on a series when the ARIMA forecasts contain zero values.
In the aforementioned hybrid models, ARIMA model is directly applied on a given time series to model the linear patterns of time series. However, ARIMA model can be suitably applied on a series when the series is stationary and Gaussian in nature. This is because; the ARIMA model parameters are obtained by using GMLE (Yao and Brockwell Citation2006) procedure, which considers the time series data as Gaussian. Hence, when the time series is non-Gaussian in nature, the direct use of ARIMA to such time series consequences in deprived fitting of ARIMA and hence adversely impacts the performance of aforementioned hybrid models. In order to overcome this, Panigrahi and Behera (Citation2017) developed an additive hybrid ETS-ANN model by assuming the time series has two components. The components may have linear or nonlinear characteristics. The ETS-ANN model provided better forecasting accuracy than Babu and Reddy (Citation2014) and Zhang (Citation2003) hybrid models considering 16 time series datasets.
Despite strong approximation capability and superior performance of SVM and LSTM, the performance of SVM and LSTM models in hybrid forecasting methods have not yet been tested. Therefore, we have introduced and analyzed the performance of Additive-ETS-SVM and Additive-ETS-LSTM and Multiplicative-ETS-ANN, Multiplicative-ETS-SVM, Multiplicative-ETS-LSTM, Multiplicative-ARIMA-SVM, and Multiplicative-ARIMA-LSTM models in addition to the existing hybrid models to forecast the TOP prices.
The rest of the paper is structured as follows. Section 2 presents the material and methodology used to predict the TOP prices. The simulation results are discussed and presented in Section 3. Section 4 concludes the findings of this paper.
Material and Methodology
Yearly data on yield (MT ha-1) of tomato, onion, and potato from 2013 to 2018 were collected from the report of Horticultural Statistics Division, Department of Agriculture, Cooperation and Farmer Welfares, Govt. of India (available at: http://agricoop.gov.in/, accessed March 12 2020) and Database of National Horticulture Board (NSB) (available at: http://nhb.gov.in/, accessed March 12 2020). The descriptive statistics of the monthly retail price of onion (Onion_Retail), potato (Potato_Retail), and tomato (Tomato_Retail) and monthly wholesale price of onion (Onion_Wholesale), potato (Potato_Wholesale), tomato (Tomato_Wholesale) are presented in . It can be observed that all the time series data are right asymmetric and platykurtic (non-Gaussian). The non-Gaussian series are highly volatile and are difficult to predict (Babu and Reddy Citation2014). This demands a systematic study on forecasting methods to efficiently predict these time series datasets.
Table 1. Descriptive statistics of time series datasets
In this study, we have considered two most popular statistical forecasting models, namely, ARIMA, exponential smoothing with error, trend, and seasonality (ETS); and three most popular machine learning models, namely, support vector machine for regression (SVM), long short-term memory (LSTM), and multilayer perceptron (MLP). Additionally, additive and multiplicative hybrid methods considering the aforementioned statistical and machine learning models are considered. The most parsimonious ARIMA and ETS models for the time series are determined using the Forecast package of R (Hyndma and Khandakar Citation2008), while the MLP, SVM, and LSTM are implemented by using the corresponding toolboxes of MATLAB. The MLP network is trained using the Levenberg–Marquardt algorithm and early stopping is used for model validation. The used ARIMA and ETS models; the significant number of lags for MLP, SVM, and LSTM model; and the length of train, validation, and test are presented in .
Table 2. Models used in simulations and division of dataset
In the additive hybrid methods as in , the time series is considered as an addition of a linear (
) and a nonlinear (
) component as in EquationEquation (1)
(1)
(1) . First, a linear model is applied on the time series to obtain the forecasts on linear component (L). Then, the residual series (e) is computed by subtracting the forecasts on linear component (
) from the original time series
as in EquationEquation (2)
(2)
(2) . The residual series is used by a nonlinear model to obtain the forecasts on nonlinear component
. Then, the final forecasts are obtained by adding the forecasts on linear component with the forecasts on nonlinear component as in EquationEquation (3)
(3)
(3) . In this paper, we have used ARIMA and ETS as the linear model; and MLP, SVM, and LSTM as the nonlinear model. Hence, a total of six different combinations, namely, Additive-ARIMA-ANN, Additive-ARIMA-SVM, Additive-ARIMA-LSTM, Additive-ETS-ANN, Additive-ETS-SVM, and Additive-ETS-LSTM are obtained and used for forecasting.
Figure 1. Schematic representation of additive hybrid methods.
In the multiplicative hybrid methods as in , the time series is considered as a multiplication of a linear (
) and a nonlinear (
) component as in EquationEquation (4)
(4)
(4) . First, a linear model is applied on the time series to obtain the forecasts on linear component (
). Then the residual series (e) is computed by dividing the forecasts on linear component (
) from the original time series
as in EquationEquation (5)
(5)
(5) . The residual series is used by a nonlinear model to get the forecasts on nonlinear component
. Then, the final forecasts are computed by multiplying the linear component forecasts with nonlinear component forecasts as in EquationEquation (6)
(6)
(6) . In this paper, we have used ARIMA and ETS as the linear model; and MLP, SVM, and LSTM as the nonlinear model. Hence, a total of six different combinations namely, Multiplicative-ARIMA-ANN, Multiplicative-ARIMA-SVM, Multiplicative-ARIMA-LSTM, Multiplicative-ETS-ANN, Multiplicative-ETS-SVM, and Multiplicative-ETS-LSTM are obtained and used for forecasting. The Multiplicative-ARIMA-ANN (Wang et al. Citation2013) is an existing method while the others are proposed in this paper. The multiplicative hybrid methods have the problem of division by zero and it occurs when the forecast on linear component (
) is zero. Hence, to avoid this problem we have set
to 0.1 when it has a value 0.
Figure 2. Schematic representation of multiplicative hybrid methods.
Results and Discussion
This section presents the simulation results using mean absolute error (MAE), symmetric mean absolute percentage error (SMAPE), and root mean square error (RMSE). Since the stochastic models like MLP and LSTM are used in the hybrid methods, we have repeated the simulations fifty times for each dataset and method separately and measured the forecasting accuracy. To draw decisive conclusions, we have conducted statistical tests such as Wilcoxon signed-rank test (Hollander, Wolfe, and Chicken Citation1999) with 95% confidence level. The results are presented in three subsections such as i) Results for onion time series, ii) Results for potato time series and iii) Results for tomato time series.
Results for Onion Time Series
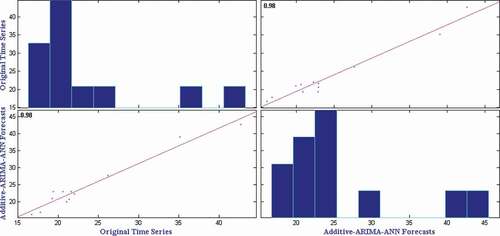
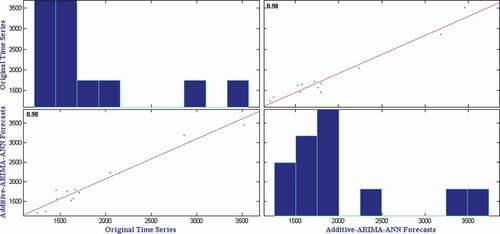
presents the mean RMSE, SMAPE and MAE over fifty independent simulations on monthly onion retail price time series. It can be observed from that the Additive-ARIMA-ANN method provides the best RMSE, SMAPE, and MAE in Onion retail price time series. However, the Wilcoxon signed-rank test (Hollander, Wolfe, and Chicken Citation1999) is applied on the obtained results to check the statistical superiority of the Additive-ARIMA-ANN method over other methods. presents the test results on monthly onion retail price time series. It can be observed from that the Additive-ARIMA-ANN method provides statistically superior RMSE, SMAPE, and MAE than other methods considered in this study. To show the closeness of original time series and Additive-ARIMA-ANN forecasts, we have plotted the comparison graph for onion retail price time series and presented it in . Furthermore, the correlation plot as in shows a strong correlation between predicted and observed values with a correlation coefficient of 0.98.
Table 3. Mean RMSE, SMAPE, and MAE of different methods by considering monthly onion retail price time series data
Table 4. Wilcoxon signed-rank test results using forecasting accuracies indicating the equivalent (≈),inferior (−) or superior (+) method with respect to the Additive-ARIMA-ANN method by considering monthly onion retail price time series data
Figure 3. Prediction of onion retail price time series.
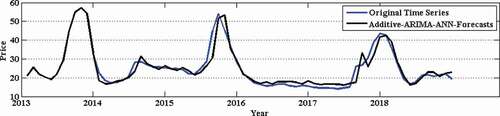
Figure 4. Correlation plot for onion retail price time series.
presents the mean RMSE, SMAPE, and MAE over fifty independent simulations on monthly onion wholesale price time series. It can be observed from that the Additive-ARIMA-ANN method provides the best RMSE and MAE in onion wholesale price time series. Although the Additive-ARIMA-LSTM method provides the best SMAPE, it can be observed from (showing the Wilcoxon signed-rank test results) that the SMAPE of Additive-ARIMA-LSTM is statistically equivalent to Additive-ARIMA-ANN method. It can also be seen from that the MAE obtained by Additive-ARIMA-ANN and Additive-ARIMA-LSTM are statistically equivalent to each other. However, the Additive-ARIMA-ANN method provides statistically superior RMSE than Additive-ARIMA-LSTM method. Hence, it is concluded that the Additive-ARIMA-ANN method is the best method to forecast the monthly onion wholesale price time series data. To show the closeness of original time series and Additive-ARIMA-ANN forecasts, we have plotted the comparison graph for onion wholesale price time series and presented it in . Furthermore, the correlation plot as in shows a strong correlation between predicted and observed values with a correlation coefficient of 0.98.
Table 5. Mean RMSE, SMAPE, and MAE of different methods by considering monthly onion wholesale price time series data
Table 6. Wilcoxon signed-rank test results using forecasting accuracies indicating the equivalent (≈),inferior (−) or superior (+) method with respect to the Additive-ARIMA-ANN method by considering monthly onion wholesale price time series data
Figure 5. Prediction of onion wholesale price time series.
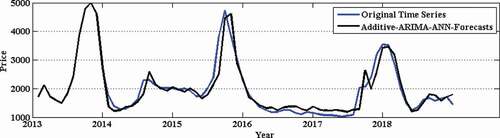
Figure 6. Correlation plot for onion wholesale price time series.
Results for Potato Time Series
presents the mean RMSE, SMAPE, and MAE over fifty independent simulations on monthly potato retail price time series. It can be observed from that the Multiplicative-ETS-SVM method provides the best RMSE, SMAPE, and MAE in potato retail price time series. However, the Wilcoxon signed-rank test (Hollander, Wolfe, and Chicken Citation1999) is applied on the obtained results to check the statistical superiority of the Multiplicative-ETS-SVM method over other methods. presents the test results on monthly potato retail price time series. It can be observed from that the ARIMA method provides statistically equivalent RMSE to Multiplicative-ETS-SVM method, and in all other cases, the Multiplicative-ETS-SVM method provides statistically superior forecasting accuracy. To show the closeness of original time series and Multiplicative-ETS-SVM forecasts, we have plotted the comparison graph for potato retail price time series and presented it in . Furthermore, the correlation plot as in shows a strong correlation between predicted and observed values with a correlation coefficient of 0.96.
Table 7. Mean RMSE, SMAPE, and MAE of different methods by considering monthly potato retail price time series data
Table 8. Wilcoxon signed-rank test results using forecasting accuracies indicating the equivalent (≈), inferior (−) or superior (+) method with respect to the multiplicative-ETS-SVM method by considering monthly potato retail price time series data
Figure 7. Prediction of potato retail price time series.
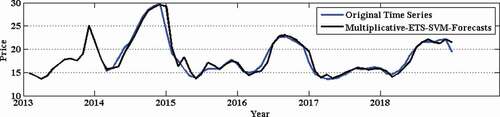
Figure 8. Correlation plot for potato retail price time series.
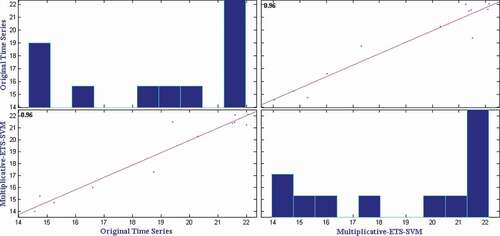
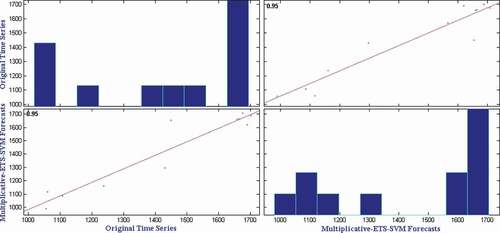
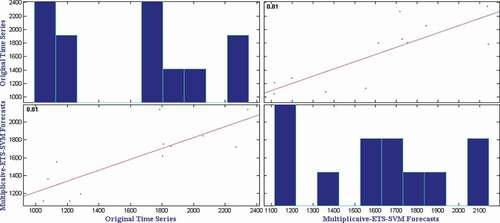
presents the mean RMSE, SMAPE, and MAE over fifty independent simulations on monthly potato wholesale price time series. It can be observed from that the Multiplicative-ETS-SVM method provides the best SMAPE and MAE in potato wholesale price time series. The ARIMA method provides the best RMSE and the Additive-ARIMA-LSTM method provides same SMAPE to that of Multiplicative-ETS-SVM method. For a statistical evaluation of the obtained results, we have applied Wilcoxon signed-rank test and presented the test results in . It can be observed from that the ARIMA method provides statistically superior RMSE than the Multiplicative-ETS-SVM method and the Additive-ARIMA-LSTM method provides statistically equivalent SMAPE to Multiplicative-ETS-SVM method. In all other cases, the Multiplicative-ETS-SVM method provides statistically superior forecasting accuracy than other methods considered in this study. Hence, it is concluded that the Multiplicative-ETS-SVM method is the best method to forecast the monthly potato wholesale price time series data. To show the closeness of original time series and Multiplicative-ETS-SVM forecasts, we have plotted the comparison graph for potato wholesale price time series and presented it in . Furthermore, the correlation plot as in shows a strong correlation between predicted and observed values with a correlation coefficient of 0.95.
Table 9. Mean RMSE, SMAPE, and MAE of different methods by considering monthly potato wholesale price time series data
Table 10. Wilcoxon signed-rank test results using forecasting accuracies indicating the equivalent (≈), inferior (−) or superior (+) method with respect to the multiplicative-ETS-SVM method by considering monthly potato wholesale price time series data
Figure 9. Prediction of potato wholesale price time series.
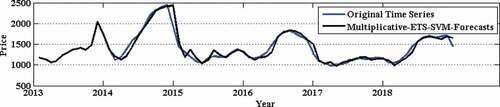
Figure 10. Correlation plot for potato wholesale price time series.
Results for Tomato Time Series
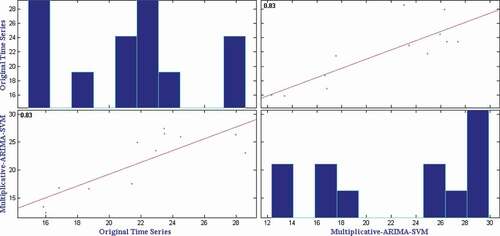
presents the mean RMSE, SMAPE, and MAE over fifty independent simulations on monthly tomato retail price time series. It can be observed from that the Multiplicative-ARIMA-SVM method provides the best RMSE and MAE in tomato retail price time series. It is also observed that the Multiplicative-ETS-SVM method provides the best SMAPE in tomato retail price time series. Additionally, the Wilcoxon signed-rank test (Hollander, Wolfe, and Chicken Citation1999) is applied on the obtained results to check the statistical superiority of the Multiplicative-ARIMA-SVM method over other methods. presents the test results on monthly tomato retail price time series. It can be observed from that the Multiplicative-ARIMA-SVM method provides statistically superior RMSE, SMAPE, and MAE than other methods except Multiplicative-ETS-SVM method in SMAPE measure. Hence, it is concluded that the Multiplicative-ARIMA-SVM method is the best method to forecast the monthly tomato wholesale price time series data. To show the closeness of original time series and Multiplicative-ARIMA-SVM forecasts, we have plotted the comparison graph for tomato retail price time series and presented it in . Furthermore, the correlation plot as in shows a strong correlation between predicted and observed values with a correlation coefficient of 0.83.
Table 11. Mean RMSE, SMAPE, and MAE of different methods by considering monthly tomato retail price time series data
Table 12. Wilcoxon signed-rank test results using forecasting accuracies indicating the equivalent (≈), inferior (−) or superior (+) method with respect to the multiplicative-ARIMA-SVM method by considering monthly potato retail price time series data
Figure 11. Prediction of tomato retail price time series.
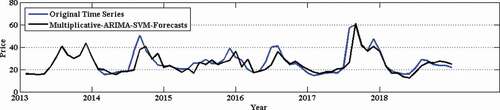
Figure 12. Correlation plot for tomato retail price time series.
presents the mean RMSE, SMAPE, and MAE over fifty independent simulations on monthly onion wholesale price time series. It can be observed from that the Multiplicative-ETS-SVM method provides the best RMSE, SMAPE, and MAE in tomato wholesale price time series. However, for a statistical significance test of the obtained results, we have employed Wilcoxon signed-rank test (Hollander, Wolfe, and Chicken Citation1999) and presented the test results in . It can also be observed from that the Multiplicative-ETS-SVM method provides statistically superior RMSE, SMAPE, and MAE than all other methods considered in this study. Hence, it is concluded that the Multiplicative-ETS-SVM method is the best method to forecast the monthly tomato wholesale price. To show the closeness of original time series and Multiplicative-ETS-SVM forecasts, we have plotted the comparison graph for tomato wholesale price time series and presented it in . Furthermore, the correlation plot as in shows a strong correlation between predicted and observed values with a correlation coefficient of 0.81.
Table 13. Mean RMSE, SMAPE, and MAE of different methods by considering monthly tomato wholesale price time series data
Table 14. Wilcoxon signed-rank test results using forecasting accuracies indicating the equivalent (≈), inferior (−) or superior (+) method with respect to the Multiplicative-ETS-SVM method by considering monthly tomato wholesale price time series data
Figure 13. Prediction of tomato wholesale price time series.
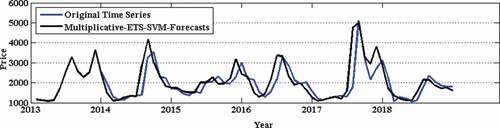
Figure 14. Correlation plot for tomato wholesale price time series.
Conclusion
In this paper, we have considered three most prominent horticultural commodities of India, namely, tomato, potato, and onion, and tried to efficiently predict their prices by using the most popular statistical (ARIMA, ETS), machine learning (MLP, SVM, LSTM), and hybrid methods. In addition to the existing hybrid methods (Additive-ARIMA-ANN [5], Multiplicative-ARIMA-ANN [8], Additive-ETS-ANN [10], Additive-ARIMA-SVM), we have proposed and considered Additive-ETS-SVM, Additive-ETS-LSTM, Multiplicative-ARIMA-SVM, Multiplicative-ARIMA-LSTM, Multiplicative-ETS-ANN, Multiplicative-ETS-SVM, and Multiplicative-ETS-LSTM methods to forecast the monthly retail and wholesale TOP prices. It is observed that none of the methods provide the best forecasts in all the considered crop price time series data. Hence, different methods need to be considered for different crop price time series data. Simulation results reveal that the hybrid methods provide better result than the individual models in predicting the crop prices. The Additive-ARIMA-ANN [5] method provides the best forecasts in monthly retail and wholesale onion price; the proposed Multiplicative-ETS-SVM method provides the best forecasts in monthly retail and wholesale potato price; the proposed Multiplicative-ARIMA-SVM method provides the best forecasts in monthly retail tomato price; the proposed Multiplicative-ETS-SVM method provides the best forecasts in monthly wholesale tomato price. Additionally, the proposed hybrid methods can be applied to forecast other time series data.
Acknowledgments
The authors would like to thank Dr. Prabhat Kumar Sahu, Reader, Sambalpur University, Odisha, India for providing the computational resources.
Disclosure statement
No potential conflict of interest was reported by the author(s).
References
- Babu, C. N., and B. E. Reddy. 2014. A moving-average filter-based hybrid ARIMA–ANN model for forecasting time series data. Applied Soft Computing 23:27–38. doi:https://doi.org/10.1016/j.asoc.2014.05.028.
- Faruk, D. Ö. 2010. A hybrid neural network and ARIMA model for water quality time series prediction. Engineering Applications of Artificial Intelligence 23 (4):586–94. doi:https://doi.org/10.1016/j.engappai.2009.09.015.
- Hollander, M., D. A. Wolfe, and E. Chicken. 1999. Nonparametric statistical methods. Hoboken: Wiley. doi:https://doi.org/10.1002/9781119196037.biblio.
- Hyndma, R. J., and Y. Khandakar. 2008. Automatic time series forecasting: The forecast package for R. Journal of Statistical Software 27 (3). doi: https://doi.org/10.18637/jss.v027.i03.
- Khashei, K., and B. Mehdi. 2011. A novel hybridization of artificial neural networks and ARIMA models for time series forecasting. Applied Soft Computing 11 (2):2664–75. doi:https://doi.org/10.1016/j.asoc.2010.10.015.
- Kumar, A., C. Bantilan, P. Kumar, S. Kumar, and S. Jee. 2012. Food security in India: Trends, patterns and determinants. Indian Journal of Agricultural Economics 67:445–63. doi:https://doi.org/10.22004/ag.econ.204827.
- Kumar, P., and P. K. Joshi. 2016. Food demand and supply projections to 2030: India. In International trade and food security: The future of Indian agriculture, eds. Floor Brouwer and P.K. Joshi. Part 2, Chapter 4: 29–63.
- Panigrahi, S., and H. S. Behera. 2017. A hybrid ETS–ANN model for time series forecasting. Engineering Applications of Artificial Intelligence 66:49–59. doi:https://doi.org/10.1016/j.engappai.2017.07.007.
- Wang, L., H. Zou, J. Su, L. Li, and S. Chaudhry. 2013. An ARIMA‐ANN hybrid model for time series forecasting. Systems Research and Behavioral Science 30 (3):244–59. doi:https://doi.org/10.1002/sres.2179.
- Yao, Q., and P. J. Brockwell. 2006. Gaussian maximum likelihood estimation for ARMA Models. I. Time series. Journal of Time Series Analysis 27 (6):857. doi:https://doi.org/10.1111/j.1467-9892.2006.00492.x.
- Zhang, G. P. 2003. Time series forecasting using a hybrid ARIMA and neural network model. Neurocomputing 50:159–75. doi:https://doi.org/10.1016/S0925-2312(01)00702-0.