
 ?Mathematical formulae have been encoded as MathML and are displayed in this HTML version using MathJax in order to improve their display. Uncheck the box to turn MathJax off. This feature requires Javascript. Click on a formula to zoom.
ABSTRACT
Electromyography (EMG) -based control is the most convenient and robust way to classify body movements for controlling prosthetic as well as orthotic devices. Its translation from lab-based approach to assistive devices demands a problem-centric and cost-effective solution. This paper demonstrates its utility for the classification of four foot movements, viz Plantar flexion, Dorsi flexion, Eversion and Inversion. For the experimental study, four superficial muscles (viz. Tibialis Anterior, Extensor Hallucis Longus, Gastrocnemius Medial and Fibularis Longus) were identified as electrode positioning locations for the EMG data acquisition. This work is aimed to minimize the number of electrode locations without significantly affecting the classification performance. Channel-set CH2,4 corresponding to the combination of Hallucis Longus and Fibularis Longus muscles is found to be the most optimal. The maximum classification accuracy obtained for the given set with the selected feature-set has been (91.85 ± 3.57)%. The classification performance has been assessed on the basis of parameters such as the type of classifier, window length, data sampling and also the body mass index of the participants. The developed technique can be applied for control of ankle exoskeletons for healthy as well as person with certain disabilities.
Introduction
Electromyography (EMG) represents the recording of neuromuscular activity generated by the muscles to exhibit movement. EMG signals have been widely used for active control of man-machine interfaces. The electrical signals generated through the muscle activation have been used for variety of applications including medical, sports as well as industries. This electrical potential is collectively generated by muscle fibers through its contraction (Konrad Citation2005). Considering this, there are three types of muscle activations: Isotonic, Isometric and Isokinetic contractions.
Isotonic activations produce movement as the result of change in length of the muscle fibers. Based upon the change in muscle length, contraction and elongation, it has further been divided into Concentric and Eccentric contraction, respectively (Behrens et al. Citation2016). Contrary to this, Isometric activations occur without any change in muscle length. Isotonic activations produce force to generate actual limb movements whereas Isometric activations produce force in resistance to the force applied externally (Rogers and MacIsaac Citation2013). Isokinetic activations however produce constant speed movements with change in muscle length. EMG analysis for Isotonic and Isokinetic contractions include strength and fatigue estimation (Rogers and MacIsaac Citation2013; Subasi Citation2013), meanwhile EMG during isometric contractions proved better for therapeutical rehabilitation (Rechy-Ramirez and Huosheng Citation2015; Tsai et al. Citation2014). Using one or more of these, several researchers have employed the EMG-based control for rehabilitation or assistance of upper limbs. Plenty of research include control of powered orthotic or exoskeleton (Lo and Xie Citation2012) and prosthetic devices (Resnik et al. Citation2012), robotics based on pattern classification for several upper limb movements (Maciejasz et al. Citation2014). However, assistive strategies for the lower limbs dominantly used passive controllers (Yan et al. Citation2015). Although lower limb exoskeletons are comparatively simpler to design than its upper limb counterparts, but it demands stringent cognitive and physical adjustments (Aoi et al. Citation2012). Hence more scope of research is available in the area.
Nevertheless, the accurate identification and classification of lower limbs’ movements will employ similar processing steps as for upper limbs. These steps include: data pre-processing, feature extraction and selection, movement classification. The pre-processed EMG signal is used to extract the useful information, in form of features. Feature extraction and selection is the most important step as it defines the classification accuracy calculated in the last step. Although a vast number of features are available for the task, but these need to be chosen appropriately. The addition of more features increases computational complexity and classification time as well. Some features are highly sensitive to noise and hence may reduce the classification accuracy under some conditions (Boostani and Moradi Citation2003; Phinyomark, Limsakul, and Phukpattaranont Citation2009b). In addition appropriate features will directly achieve significant accuracy (Oskoei and Huosheng Citation2008). Although researchers have examined and provided some appropriate feature sets for particular actions (Naik, Kumar, and Palaniswami Citation2014; Oskoei and Huosheng Citation2008; Phinyomark, Limsakul, and Phukpattaranont Citation2009b), similar cannot be generalized for use in other movement classifications (Arjunan, Kumar, and Naik Citation2014; Xi et al. Citation2017). Additionally, the use of redundant (Farfán, Politti, and Felice Citation2010; Kim et al. Citation2011; Yi-Chun et al. Citation2010) and complex features (Khushaba, Al-Ani, and Al-Jumaily Citation2010; Li et al. Citation2011; Lorrain, Jiang, and Farina Citation2011) increases computational complexity with classification results comparable to simple approaches only. Along with this, many researches have tried to optimize the redundant information available from the recording sites, i.e. EMG channels to enhance the system’s performance. This majorly includes the application of dimensionality reduction techniques after feature calculation employed for upper (Andrews, Morin, and Linda Citation2009; Mesa et al. Citation2014; Wang et al. Citation2016) and lower limbs’ (Liu et al. Citation2014) movements. Al-Ani et al. (Al-Ani et al. Citation2016) described the novel method of dynamic channel selection that identifies optimal set of channels corresponding to each time segment of the signal but after the required feature extraction. The disadvantage of such methods is huge data calculation that will ultimately be rejected before classification. To overcome this problem, techniques have been developed for EMG channel selection during preprocessing and before feature extraction (Bai, Chen, and Yang Citation2019; Geng et al. Citation2014; Naik, Ali, and Nguyen Citation2016). Tenore et al. (Tenore et al. Citation2008) have shown that different number of electrodes used for healthy and transradial amputee does not significantly affect the classification of individual finger movements. Further methods have been developed for dexterous hand and finger movement recognition with only two surface EMG electrodes (Khushaba et al. Citation2012; Naik and Nguyen Citation2015; Wang, Lao, and Zhang Citation2017). Such elaborative research in the area of upper limb signal classification motivated the authors to assess the optimal channel as well as feature combinations for lower limbs. Recent work also highlighted the significance of channel selection for lower limb movements (Joshi, Nakamura, and Hahn Citation2015; Toledo-Pérez et al. Citation2019).
Hence, the objective of the current study is to select the optimal electrode locations, pertaining to a set of non-redundant features, for classification of four basic foot movements. The rest of the paper is organized as follows: Section 2 presents a collection of non-redundant and simple time and frequency domain features and then provides experimental results in Sections 3 and 4, for the identification of optimal channel set based upon acquired EMG signals. Features have further been scrutinized employing a trade-off between classification accuracy and computational cost of the design. Finally, Section 5 presents the concluding remarks.
Materials and methods
EMG Features
Features used for analysis of EMG signals mostly include time domain (TD) and frequency domain (FD) characteristics. However there also exists a third category, i.e. Time-Frequency Domain (TFD). But TFD features require signal transformation and dimensionality reduction before classification (Hariharan et al. Citation2012; Phinyomark, Phukpattaranont, and Limsakul Citation2012). This increases complexity at not much added accuracy (Englehart, Hudgin, and Parker Citation2001; Phinyomark et al. Citation2013).
As raw EMG data is time dependent, TD features are simplest to implement for feature extraction. The mathematical definitions are simple and can be directly applied to raw data without the need of any transformation. Although results in this group may change due to non-stationarity of EMG signals, improvement can be achieved by the addition of more training samples (Oskoei and Huosheng Citation2007). Further, as TD features depend upon the amplitude of input signal, contamination from noise signals is highly likely (Phinyomark, Limsakul, and Phukpattaranont Citation2009a). Additionally, electrode location shift significantly reduces classification accuracy even more than varying level of effort and fatigue (Tkach, Huang, and Kuiken Citation2010). Special care should be taken during recording to acquire noise-free data, as this ensures good classification accuracy. Further, FD features mostly define the fatigue of the muscles (Al-Mulla, Sepulveda, and Colley Citation2011; Phinyomark, Phukpattaranont, and Limsakul Citation2012). These include parameter estimation through periodogram of the signal. These are insensitive to noise but highly complex and computationally expensive. This paper only uses one of FD features along with TD features, as it improves the classification performance significantly. For the given EMG sampled signal of length N, features identified as the most stable in reference to above discussed problems, are presented in the along with its mathematical formulations (Detailed description is given in the supplementary file).
Table 1. Selected features with mathematical formulations and associated references
Subject Recruitment
A total of twenty healthy subjects (13 Male, 7 Female), ranging from 21 to 32 years of age and average Body Mass Index (BMI) of 21.77, were recruited for data acquisition in this study. The participants had no known neurological impairment with either no or minor injuries to their limbs in the past. In addition, five patients with incomplete spinal cord injury were also included for post-assessment. For patients, approval was obtained from the ethical committee of Indian spinal injury center, New Delhi. The demographic data of the patients is provided in (a detailed version is given in the supplementary file). Each subject was given a brief overview of the data acquisition procedure and the foot movements they were required to perform. An informed verbal consent has been received from each subject before the trials. [Trial dataset uploaded in PhysioNet repository and available on request under url: https://physionet.org/projects/peYmXsG9knoSj1xRF2uG/overview/]
Table 2. Demographic information of the patients
Experimental Setup
Disposable pre-gelled electrodes were stick to the muscles of the participants from where shielded clamp electrodes would acquire the EMG signals. The skin was cleaned with an antiseptic before electrode placement over each muscle. For bipolar placement, two electrodes were placed in close proximity (20 to 30 mm) over the belly of each muscle. The signals were then fed to the Biopac MP 150 system through EMG 100C amplifiers set at a gain and sampling rate of 2000 and 1000 samples/second, respectively. The acquired EMG signals were filtered at 10–500 Hz frequency with a notch set at 50 Hz. The developed wireless foot sensor module (WFSM) was strapped to the midfoot using a velcro strap (Das, Hooda, and Kumar Citation2019). WFSM is a compact and low-power inertial sensing system that allows the measurement of 3-axis rotational angles (roll, pitch and yaw) around any joint along with tri-axial acceleration and angular velocity. The device is powered with a 3.7 V, 500mAh Li-ion battery and can be recharged with a micro-USB connector from a USB charging port. The variations of foot angle were recorded wirelessly at a sampling rate of 20 Hz, using an application developed in LabVIEW. Its applications for measurement of foot angle and subsequently using the measured foot inclination variation for detecting gait events viz. heel strike, toe off along with estimation of stride length has been reported in other works as well (Das and Kumar Citation2021; Hooda, Das, and Kumar Citation2020). The EMG data acquisition and angle measurement (WFSM) units had been synchronized using an external manual trigger.
Data Acquisition
EMG signals have been recorded in a temperature-controlled laboratory, from the lower limb dominant (19 right and 1 left) leg of the healthy participants. For patients, the leg with better voluntary control is referred as the dominant limb for the present work. Four basic foot movements that are necessary for gait and postural balance were selected for this study. This involved: Plantar flexion (PF), Dorsi flexion (DF), Eversion (EN) and Inversion (IN). EMG acquisition electrodes were placed at four superficial muscles: Tibialis anterior (TA), Gastrocnemius medial (GC-M), Fibularis Longus (FL) and Extensor Hallucis Longus (HL). The foot actions and electrode locations has been depicted in .
Figure 1. Four foot movements selected for classification: Plantar flexion (top left), dorsi flexion (top right), eversion (bottom left), inversion (bottom right).
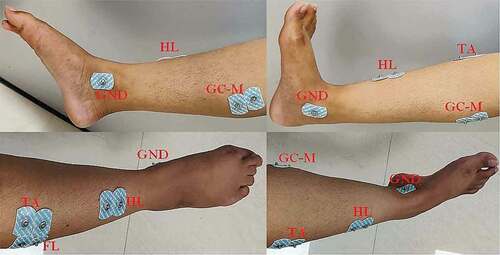
Each healthy participant was instructed to perform ten isometric maximum voluntary contractions for a period of 10 seconds corresponding to each movement. The WFSM (not shown in figure) was used to ensure no/minimal angle (not more than 4º) variations during contractions. A visual feedback was provided to the participants to familiarize with the resultant signal amplitudes and angle values for the specified actions. For each participant, data was recorded at four separate sessions (~1 hour per session) to avoid noise and other bias. The time gap between two sessions varied from minimum one to maximum seven days depending upon the availability of the participant. In total, 160 datasets or a total duration of 1600 seconds of movement were collected from each participant.
For patients, the data was acquired in a single session (~1.5 hour) with six trials corresponding to each movement. The patients were instructed to perform the isometric contraction per movement for only 5 seconds pertaining to their weak muscular structure. Cumulatively, 30 trials with 150 seconds of movement data have been recorded from patient population for the present study.
Feature Extraction and Classification
Features described in Section 2.1 have been applied over the pre-processed EMG dataset for qualitative analysis, after random division in two equal sets comprising training and testing dataset. The training model generated from the training dataset was used for prediction over the testing dataset. Three classifiers were employed in this work, namely Quadratic Discriminant Analysis (QDA), Support Vector Machine (SVM) and k-Nearest neighbor (kNN). The approach of hyper-parameter tuning with bayesian optimization has been used to structure the model(s) while training.
The optimal parameter identification has been divided into two steps: 1) Channel-set selection 2) Feature-set selection. For step 1, features extracted from all four recorded channels were used for classification to identify the optimal electrode/ channel locations that can successfully recognize the intended action(s). Six channel-set combinations were used for comparative analysis: TA & HL (CH1,2), TA & GC-M (CH1,3), TA & FL (CH1,4), HL & GC-M (CH2,3), HL & FL (CH2,4) and GC-M & FL (CH3,4). This is based on the theory of digital encoding where not more than ‘n’ bits are required for the representation/ classification of ‘2n’ patterns. Five most used window lengths, viz. 250, 200 150, 100 and 50 ms without overlap were used to determine any window length dependent variations. Quality check for any possible fatigue introduced due to long duration (10 seconds) of the trials and its effect over individual and combined feature set has also been assessed over healthy population. Further, step 2 involves the formation of optimal feature set for the selected channel-set. The performance has been assessed for dataset sampled according to the constraints of prediction performance and between session variations.
The patients’ dataset has been used to perform some post-assessment tests in order to ensure its reliability for clinical settings. Hence, the prediction performance in terms of accuracy has been calculated for the aforementioned channel-set and feature-set combinations with all of the above mentioned window length conditions.
Performance Measure and Statistical Analysis
The performance of the recognition system is quantified in terms of prediction accuracy (PA). PA is calculated as the ratio of correct classification of the intended class to the total number of classifications in the test set, as described below:
The quality of the channel-sets and features has been evaluated in terms of PA calculated with different classifiers employed for classifier-independent performance analysis. Also it has been used as a performance measure for variation of other parameters i.e. window length, data samples and feature-sets as well. Following this, average PA (Avg.PA) and coefficient of variation (CoV) has been calculated to determine inter-session assessment (Section 3.2). Avg.PA is defined as mean of PA achieved per session corresponding to each feature and selected channel-set, as given below:
CoV is used to determine how much PA varies with session-wise sampling. For the given channel-set and feature, it is calculated as the ratio of standard deviation (SD) of PA per session to its mean, as given below
For all conditions, repeated measures analysis of variance (ANOVA) was used to analyze the statistical significant variation across the subject group with ‘channel sets,’ ‘classifiers’ or ‘window length’ as a factor. Post hoc Bonferroni’s test has been used to correct for multiple comparisons whenever Mauchly’s sphericity test response is significant (p < .01 and ε < 0.75). Also, paired sample t-test and coefficient of determination (r2) analysis over PA of CH2,4 is executed to assess variation with muscular fatigue.
Results
The results for both the steps are presented along with descriptions:
Optimal Channel-set Selection
describes the achieved PA for six channel-set combinations for window length of 250 ms. As evident from , CH2,4 exhibited the highest accuracy followed closely by CH3,4 with PA of 92% and 91.88%, respectively for the SVM classifier. The SD for CH2,4 and CH3,4 were 3.63% and 7.77%, respectively. Similarly, for the QDA classifier, CH2,4 performed best with PA of 89.60% followed by CH3,4 with PA of 86.45%. The SD for CH2,4 and CH3,4 was 4.44% and 10.88%, respectively. For the kNN classifier, PA achieved for CH3,4 was highest followed by CH2,4 at 89.47% and 88.31%, respectively. The SD for CH2,4 and CH3,4 was 4.67% and 7.74%, respectively. The channel set CH1,2 was observed to be performing worst with PA of 75.96%, 82.34% and 74.08% for QDA, SVM and kNN classifier, respectively. As observed, all three classifiers followed similar trend and hence the performance is not dependent upon the type of classifier. The SVM performed better in terms of classification accuracy when compared to other classifiers, for condition of each channel-set and was therefore used for the rest of the analysis. Statistical significant differences (p < .01) have been found for all classifiers conditions while only some channel-set yielded significant difference during post-hoc comparison against CH2,4.
Table 3. Average PA± SD of selected Channel-sets using three different classifiers for 250 ms window length
represents the PA calculated for each channel-set, corresponding to remaining window length conditions, using SVM classifier. As observed from , PA for CH3,4 exhibited the best performance with maximum PA of 91.63% and 91.10% for analysis window length of 200 ms and 150 ms, respectively. On the other hand, CH2,4 performed better with maximum PA of 90.08% and 87.91% for the analysis window length of 100 ms and 50 ms, respectively. Also, no significant differences (p ≈ 0.95) exist between the two channel sets irrespective of window size. Still, the authors recommend the use of CH2,4 channel-set and selected the same for further analyses. The reason for the same has been detailed in Section 4. Furthermore, a relative reduction in PA was observed with the reduction of window size for each channel-set condition. Hence the performance was independent of the analysis window length. Statistical significant differences were found (p < .01) among other channel-set conditions for different analysis window length. The best performance for each channel-set was observed for the window length of 250 ms using SVM classifier (p < .01, F = 6.63).
Table 4. Average PA± SD of selected Channel-sets using SVM classifier for different window lengths
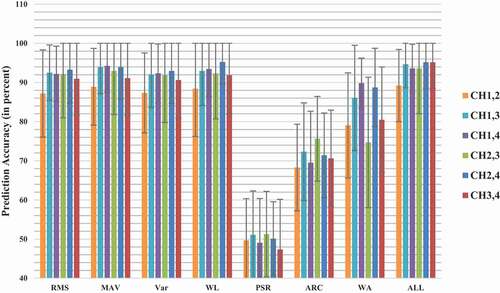
Further, the assessment of muscular fatigue resulting due to isometric contractions has been performed. For this, the data has been sampled as to include the last two seconds of each trial (muscular fatigue due to continuous isometric contractions) as testing and the first eight seconds as training dataset, with window length of 250 ms. The PA achieved has been as represented in . The PA corresponding to different channel sets for each individual feature and all combined features (ALL) did not show any significant difference (p > .01). Also the paired t-test for PA corresponding to CH2,4, with the results of original testing dataset, does not show any significant variation (p > .01, t = 2.98). The two have been found to be highly correlated with r2 of 0.99. As observed previously, channel-set CH2,4 reported best results with PA of (95.16 ± 6.59)%. The increase in PA here was assumed to be because of the larger training dataset compared to the testing (80–20), whereas originally it was distributed equally (50–50) for both datasets. Hence the performance of CH2,4 remains stable even with the possible existence of fatigue in the tested EMG signal.
Figure 2. Variation in PA for testing over last two seconds’ dataset of continuous isometric contractions.
Optimal Feature-set Selection
The performance of each feature with respect to available channel-set has been performed with an analyses window length of 250 ms. The fatigue check assessment for each individual feature, as represented in , reported PA corresponding to channel-set CH2,4 with deviation of 8.46%, 8.14%, 8.26%, 8.70%, 9.46%, 10.79% and 10% for RMS, MAV, Var, WL, PSR, ARC and WA, respectively. This shows that the representative features do not vary abruptly with non-linearity caused due to existing fatigue, if any.
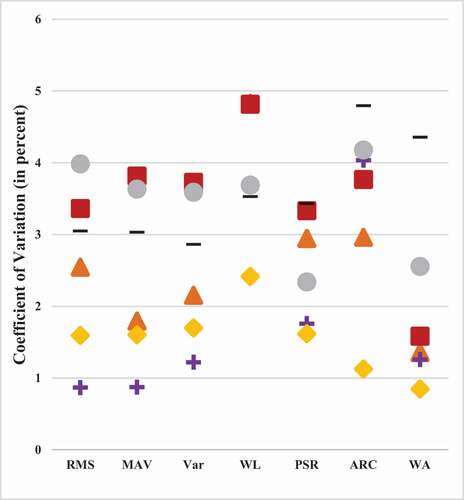
Additionally, the variation in PA with trials performed in different sessions (sampling for S1 to S4) have been analyzed to assess variations of EMG signal with electrode positions, muscle contraction effort, skin abrasion, perspiration etcetera. The observed parameters, i.e. average PA (Avg.PA) and the coefficient of variation (CoV) between sessions have been as represented in and 4, respectively (the legend symbols used in hold similar meaning for as well). Evidently, channel-set CH2,4 resulted in highest Avg.PA and least CoV for most of the features. The CoV for channel-set CH1,4 have been observed to be the least (0.87%, 0.87% and 1.22%) for RMS, MAV and Var followed closely by CH2,4 (1.59%, 1.60% and 1.70%). However, Avg.PA for CH2,4 have been reported to be the highest for each case of RMS, MAV and Var (89.79%, 90.26% and 89.20%) compared with CH1,4 (85.74%, 86.60% and 85.14%). The rest of the features (WL, PSR, ARC and WA) have also reported least CoV (2.42%, 1.62%, 1.12% and 0.85%) with optimal Avg.PA (90.44%, 47.50%, 64.73% and 83.70%). Only channel-set CH2,3 achieved average accuracy higher than CH2,4 for PSR and ARC (48.57% and 66.91%) with nowhere as optimal CoV (3.44% and 4.79%). Hence CH2,4 proves to be the optimal choice for all existing constraints. Notably, CoV obtained for all TD features except WL has been below 2%, hence WL has been excluded from further assessments. Also, features RMS, MAV and Var have been observed to follow similar trends with equivalent rise and deviations. Hence the one with least Avg.PA (Var) and maximum time consumption have also been excluded in order to remove redundancy. Thus the optimal feature-set comprising a combination of RMS, MAV, PSR, ARC and WA features has been proposed for the task of foot movement pattern recognition. The selected feature-set also resulted in PA of (94.69 ± 6.34)% during fatigue check assessment.
Figure 3. Avg.PA achieved from session-wise sampling.
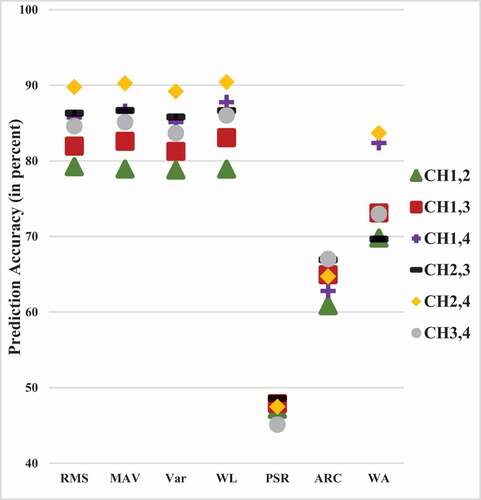
Figure 4. CoV achieved from session-wise sampling.
Furthermore, comprises the results achieved from individual features and the proposed feature-set with the original testing dataset. The proposed feature-set resulted in average PA of 91.85% along with deviation of 3.57% using SVM classifier with 250 ms. Also it is worth noting that even though PSR had very low average PA of 47.45%, its use with other TD features significantly improved the accuracy. Cepstral coefficients can also be used instead of ARC (Tkach, Huang, and Kuiken Citation2010), but as it was derived from ARC complexity and computational time increases considerably.
Table 5. Average PA± SD for different Feature set(s) using SVM with 250 ms window length
Comparative Analysis
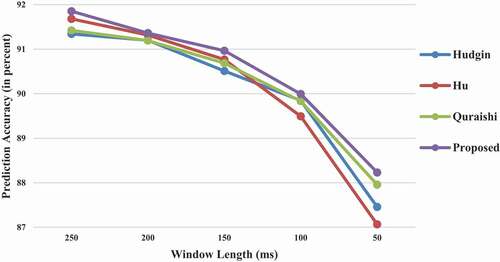
Finally, the proposed optimal feature-set; RMS, MAV, PSR, ARC and WA, provided a resultant PA of 91.85% along with SD of 3.57% with sample window length of 250 ms. The obtained results were compared with other available traditional feature sets of Hudgins’(Hudgins, Parker, and Scott Citation1993), Oskoei and Hu’s (Oskoei and Huosheng Citation2008) and Quraishi (AL-Quraishi et al. Citation2017). Five TD features were given by Hudgins; MAV, MAV slope, zero crossing, slope sign change and WL(Hudgins, Parker, and Scott Citation1993). Alternatively Oskoei and Hu presented a feature set consisting of TD’s RMS and FD’s second order ARC (Oskoei and Huosheng Citation2008). Further Quraishi suggested the log of TD features; logMAV, logRMS, logWL and logSD (AL-Quraishi et al. Citation2017). The PA was calculated for referred sets using CH2,4 with 250 ms window length.
The results have been reported in . Further, represents the average PA results obtained from the proposed and three traditional feature sets with window length of 250 ms, 200 ms, 150 ms, 100 ms and 50 ms. Even though all the feature sets followed the trend of decreasing accuracy with decrease of window length, the decay in proposed feature-set is lesser compared to others. As evident from p-value (>.01), the proposed feature set performed slightly better than the traditional feature sets.
Figure 5. Variation in PA with respect to window length for proposed and traditional feature sets.
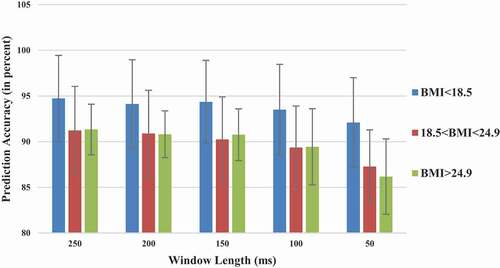
Relation between PA and Body Mass Index (BMI)
As BMI is known to effect the classification performance (Atzori et al. Citation2014; Farina, Cescon, and Merletti Citation2002), PA as a function of BMI (ratio of body mass to square of height) of the participants has been calculated with window length of 250 ms, 200 ms, 150 ms, 100 ms and 50 ms for an analytical assessment. It was categorized into three main parts low (<18.5), normal (18.5–24.9) and high (>24.9) BMI as shown in . It was observed that participants with low BMI had higher PA than participants with normal or higher (>24.9) BMI, as previously reported in (Atzori et al. Citation2014). However, for all three cases of BMI similar trend of decrease in PA with the decrease of window length is observed. The proposed set resulted in maximum PA of (94.74 ± 4.71)% for participants with BMI<18.5 and sample window length of 250 ms. Consecutively, minimum PA of (86.18 ± 4.12)% is achieved for participants with BMI>24.9 and sample window length of 50 ms.
Figure 6. Variation in PA with respect to window length for different levels of BMI.
Assessment over Patient Population
The performance of formulated channel-sets has been assessed over patients’ data to observe possible variation from that of healthy individuals. It was observed that similar to healthy population, SVM outperformed the other two classifier functions for patients as well and hence used while calculating PA. represents the PA obtained for all channel-set combinations with five selected window lengths. Similar to the healthy population, CH2,4 outperformed the other channel-sets with PA of 83.25%, 85% and 82.3% for respective window length of 250 ms, 200 ms and 100 ms followed closely by CH1,4 (p > .3, t = 2.306). While CH1,4 outperformed CH2,4 for window length of 150 ms and 50 ms with respective PA of 84.45% and 81.75%, there was no significant difference between the two (p > .8). Channel-set CH3,4 followed the two in terms of performance with PA of 81.75%, 81%, 81.21%, 79% and 75.90% for respective window length of 250 m, 200 ms, 150 ms, 100 ms and 50 ms and no significant variation (p > .7). The remaining channel sets showed significant variation (p < .01) when compared to CH2,4.
Table 6. Average PA± SD of selected Channel-sets for patients’ population using SVM classifier and different window lengths
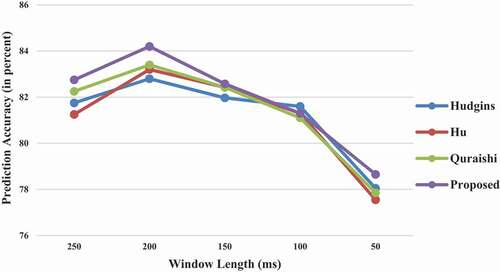
Also, the average PA obtained, using channel-set CH2,4, from the proposed and three traditional feature sets with window length of 250 ms, 200 ms, 150 ms, 100 ms and 50 ms is shown in . Even though the proposed method performed slightly better, no significant difference between the proposed and traditional feature sets was found (p > .01). The maximum PA of (84.2 ± 16.94)% was observed for 200 ms window length with the proposed feature-set, followed by 250 ms condition with PA of (82.75 ± 16.61)%.
Figure 7. Variation in PA for patients’ population with respect to window length for proposed and traditional feature sets.
Discussion
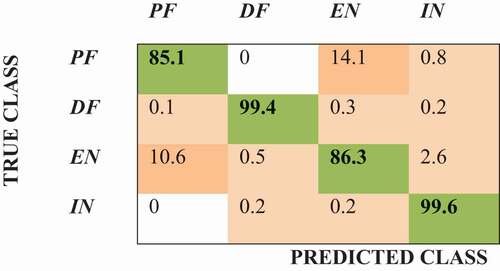
According to the results described in previous section, channel-set CH2,4 outperformed others with a maximum PA and SD of 92% and 3.63% respectively, for the analysis window of 250 ms length using SVM classifier. However, the results obtained for channel-set CH3,4 were at par with channel-set CH2,4 with no significant difference for different analysis window lengths or classifier type. There were three main reasons behind the selection of CH2,4 as the optimal channel-set. Firstly, it incorporates two different muscles responsible for two dominant actions of the foot (HL for dorsiflexion and FL for plantar flexion). Second and more important is that these two muscles are far apart from each other and hence chances of crosstalk are rare. Third, as evident from and , was that the PA of CH2,4 exhibited least fluctuation as can be observed from SD values for each channel-set and window length conditions. The obtained results show not more than 10% variation for PA using CH2,4, when compared with PA calculated for each subject using all four channels (CH1,2,3,4) simultaneously. In addition, cross-correlation coefficient, as defined in (Bansal et al. Citation2011), calculated for channel-set CH2,4 was not more than 0.08 (mostly lesser than zero) for all the subjects and corresponding movement trials. This further ascertains the fact that the patterns of the two selected channels are linearly independent of each other for all four actions studied and hence presents maximum information for classification. The PA for CH2,4 when compared with CH1,2,3,4 shows a significant deviation (p < .01) where it varies from 97.87% to 98.38% for window length of 50 ms to 250 ms, respectively. The confusion matrix plot for all four movement actions has been shown in . As clear, DF and IN actions were classified with almost hundred percent accuracy. However, PA reduces drastically for PF and EN. In fact, the two classes got misclassified into each other only. This is due to the physiology of human body under which the FL muscle contributes for both, PF and EN, the movements of ankle joint. The resultant sensitivity of 91.85% has been obtained along with specificity, F1-score and kappa (κ) of 97.29%, 91.82% and 0.7831, respectively.
Figure 8. Confusion matrix plot for all four movements by the SVM classifier using proposed features.
The results obtained from the present work are very encouraging. The proposed feature-set can be used as a generic set for feature extraction and classification of EMG patterns in the presence of varying noise signals, muscle contraction forces and fatigue levels. The ten seconds long isometric contractions of the present dataset have been an excellent example of that as such lengthy durations may introduce muscle fatigue and noises within the acquired data involuntarily. Further comparison with other available traditional feature sets justified the improved performance. Also, the segment length of 250 ms without overlap is sufficient to produce real time results without any delay in the controller device (Joshi, Nakamura, and Hahn Citation2015; Smith et al. Citation2011). Moreover, overlapping techniques can be employed in the post processing stage using the technique of majority vote to reduce the effect of overlapping over generated movements or transitions within the movements. The recognition system along with proprioceptive feedback is known to improve myoelectric control (Pistohl et al. Citation2015).
Phinyomark et al. (Phinyomark, Limsakul, and Phukpattaranont Citation2009b) suggested a novel robust feature, namely modified mean frequency (MMNF), with white Gaussian noise point of view. But it was also noted that it has limited ability to discriminate between classes. Existing features can further be modified to include first or higher order derivatives as suggested by (Phinyomark et al. Citation2014). But a comparison of presented features with its first and second order derivatives produced only comparable or even decline in the PA. Moreover, only the traditional features used by (Phinyomark et al. Citation2014) showed significant improvement, some of which (WL and WA) were also used in this paper. The novel features defined are rarely used by researchers for EMG pattern classifications. Other higher order derivatives were not used as with more differentiation the signal to noise ratio (SNR) degrades proportionally. Additionally, it was observed that applying log to some of the original features (PSR, ARC) also decreases the PA. This may be due to the fact that EMG signal recorded from lower limbs has very low amplitude (varying from 0.5 mV to 1.0 mV) due to which the feature value is not significant enough to induce better classification rates.
The present technique can be applied for control of ankle exoskeletons for healthy as well as person with certain disabilities. For healthy, it can be used to augment weight bearing in long duration standing and walking tasks (De Looze et al. Citation2016), for example in military or industrial settings. Under clinical applications, the targeted population will include patients with problem of foot drop or ankle injury (weak muscles) particularly elders. In the trials conducted over limited patient population for foot movement classification, similar trends were observed as for healthy population in all the subjects except ‘p2ʹ. In fact, mostly the anomalies observed during PA estimation for different window length conditions were in data acquired from subject ‘p2ʹ only. This may be due to an ankle fracture that occurred post injury to the patient. Further subject ‘p4ʹ had over all very low PA even with all four muscle inputs (maximum 64%). This reduced the average PA of the population even though PA for some subjects (‘p1ʹ and ‘p3ʹ) reached 100% also. The variation in classification results amongst healthy population and patients can also be due to change in muscular tone of patients after accident. As for healthy population each muscle is in natural shape and worked well while there may be some inherent changes that can occur post an injury. Further as patients are supposed to perform less locomotion post-injury, so their muscles become weak. As TA is the strongest muscle among all the selected muscles, it might seem to perform better compared to others (as was also observed for some healthy individuals who were lesser active physically). However there is possibility of it all being assumption and no significant deduction can be made based on available data and results.
Although the included patients' population is too limited to analyze PA-BMI dependence, initial results has drawn the same conclusion as was observed for healthy individuals. The patients with normal BMI showed significant performance (p < .01) varying from 100% to 97.38% with decrease in window length from 250 ms to 50 ms. For patients with high BMI, PA varied from 71.25% to 66.17% with decrease in window length from 250 ms to 50 ms while no patient fell under the category of low BMI. This suggests that existence of an injury does not significantly alter the movement patterns in patients. Hence the presented approach can be used for reliable classification of given foot movements. Rehabilitation treatment can include active control of the therapeutic device attached to the affected/non-dominant limb by using the signals from the unaffected (in case of hemiparesis) or dominant limb (as observed in incomplete SCI patients). The proposed strategy is expected to enhance muscle strength with minimal intrusion and lower computational cost.
Conclusion
This study presented a method to select non-redundant and optimal features along with the selection of an optimal channel-set for EMG signal classification. Six combinations with two channels each were tested using six TD and one FD features. This was repeated for the condition of five different window lengths and three different classifiers. Channel-set CH2,4 provided optimal results. From the results, it was concluded that the proposed combination of channel-set and feature-set can be used for successful classification of foot movement signals recorded at varying noise conditions, muscle contraction forces or fatigue levels. The highest PA of (91.85 ± 3.57)% was achieved using SVM classifier with analysis window length of 250 ms. Also similar performance trends have been observed from post-assessment tests conducted on a small incomplete SCI patient population. The movement signals classified from the unaffected/ dominant limb can provide an assist-as-needed therapy to the affected side of the patients.
It was also observed that a person’s BMI has an indirect relationship with accuracy i.e. PA decreases with increase in BMI that followed for all the cases of window length. The proposed set can classify the four foot movements with minimal intrusion and lower computational cost. Hence, this work can help the future researchers decide how necessary it is to increase the resources for the classification process to obtain the required accuracy.
Acknowledgments
The authors would like to acknowledge the support and contribution given by researchers in CSIR-CSIO (Central Scientific Instrument Organization) research laboratory, Biomedical Instrumentation Department, Chandigarh, India.
Disclosure Statement
No potential conflict of interest was reported by the author(s).
Correction Statement
This article has been republished with minor changes. These changes do not impact the academic content of the article.
Additional information
Funding
References
- Al-Ani, A., I. Koprinska, G. R. Naik, and R. N. Khushaba. 2016. “A dynamic channel selection algorithm for the classification of EEG and EMG data.” International Joint Conference on Neural Networks (IJCNN), Vancouver.
- Al-Mulla, M. R., F. Sepulveda, and M. Colley. 2011. A review of non-invasive techniques to detect and predict localised muscle fatigue. Sensors 11 (4):3545–94. doi:https://doi.org/10.3390/s110403545.
- Al-Timemy, A. H., R. N. Khushaba, G. Bugmann, and J. Escudero. 2016. Improving the performance against force variation of EMG controlled multifunctional upper-limb prostheses for transradial amputees. IEEE Transactions on Neural Systems and Rehabilitation Engineering 24 (6):650–61. doi:https://doi.org/10.1109/TNSRE.2015.2445634.
- Andrews, A., E. Morin, and M. Linda. 2009. “Optimal electrode configurations for finger movement classification using EMG.” Annual International Conference of Engineering in Medicine and Biology Society (EMBC), Minneapolis.
- Aoi, S., Y. Egi, R. Sugimoto, T. Yamashita, S. Fujiki, and K. Tsuchiya. 2012. Functional roles of phase resetting in the gait transition of a biped robot from quadrupedal to bipedal locomotion. IEEE Transactions on Robotics 28 (6):1244–59. doi:https://doi.org/10.1109/TRO.2012.2205489.
- Arjunan, S. P., D. K. Kumar, and G. Naik. 2014. Computation and evaluation of features of surface electromyogram to identify the force of muscle contraction and muscle fatigue. BioMed Research International, 2014.
- Atzori, M., A. Gijsberts, I. Kuzborskij, S. Elsig, H. Anne-Gabrielle Mittaz, O. Deriaz, C. Castellini, H. Müller, and B. Caputo. 2014. Characterization of a benchmark database for myoelectric movement classification. IEEE Transactions on Neural Systems and Rehabilitation Engineering 23 (1):73–83. doi:https://doi.org/10.1109/TNSRE.2014.2328495.
- Bai, D., S. Chen, and J. Yang. 2019. Upper Arm Motion High-Density sEMG Recognition Optimization Based on Spatial and Time-Frequency Domain Features. Journal of Healthcare Engineering, 2019.
- Bansal, G., D. Bhatia, D. Joshi, S. Anand, and R. P. Tewari. 2011. Coordination between lower limb muscles in different locomotion activities. International Journal of Biomedical Engineering and Technology 6 (2):129–41. doi:https://doi.org/10.1504/IJBET.2011.041119.
- Behrens, M., A. Mau-Moeller, K. Mueller, S. Heise, M. Gube, N. Beuster, P. K. E. Herlyn, D.-C. Fischer, and S. Bruhn. 2016. Plyometric training improves voluntary activation and strength during isometric, concentric and eccentric contractions. Journal of Science and Medicine in Sport 19 (2):170–76. doi:https://doi.org/10.1016/j.jsams.2015.01.011.
- Boostani, R., and M. H. Moradi. 2003. Evaluation of the forearm EMG signal features for the control of a prosthetic hand. Physiological Measurement 24 (2):309. doi:https://doi.org/10.1088/0967-3334/24/2/307.
- Das, R., N. Hooda, and N. Kumar. 2019. A Novel Approach for Real-Time Gait Events Detection Using Developed Wireless Foot Sensor Module. IEEE Sensors Letters 3 (6):1–4. doi:https://doi.org/10.1109/LSENS.2019.2914719.
- Das, R., and N. Kumar. 2021. A Novel Method for Stride Length Estimation Using Wireless Foot Sensor Module. IETE Journal of Research 1–8.
- De Looze, M. P., T. Bosch, F. Krause, K. S. Stadler, and L. W. O’Sullivan. 2016. Exoskeletons for industrial application and their potential effects on physical work load. Ergonomics 59 (5):671–81. doi:https://doi.org/10.1080/00140139.2015.1081988.
- Englehart, K., B. Hudgin, and P. A. Parker. 2001. A wavelet-based continuous classification scheme for multifunction myoelectric control. IEEE Transactions on Biomedical Engineering 48 (3):302–11. doi:https://doi.org/10.1109/10.914793.
- Farfán, F. D., J. C. Politti, and C. J. Felice. 2010. Evaluation of EMG processing techniques using information theory. Biomedical Engineering Online 9 (1):72. doi:https://doi.org/10.1186/1475-925X-9-72.
- Farina, D., C. Cescon, and R. Merletti. 2002. Influence of anatomical, physical, and detection-system parameters on surface EMG. Biological Cybernetics 86 (6):445–56. doi:https://doi.org/10.1007/s00422-002-0309-2.
- Geng, Y., X. Zhang, Y.-T. Zhang, and L. Guanglin. 2014. A novel channel selection method for multiple motion classification using high-density electromyography. Biomedical Engineering Online 13 (1):102. doi:https://doi.org/10.1186/1475-925X-13-102.
- Hariharan, M., C. Y. Fook, R. Sindhu, B. Ilias, and S. Yaacob. 2012. A comparative study of wavelet families for classification of wrist motions. Computers & Electrical Engineering 38 (6):1798–807. doi:https://doi.org/10.1016/j.compeleceng.2012.08.009.
- Hooda, N., R. Das, and N. Kumar. 2020. Fusion of EEG and EMG signals for classification of unilateral foot movements. Biomedical Signal Processing and Control 60:101990. doi:https://doi.org/10.1016/j.bspc.2020.101990.
- Hudgins, B., P. Parker, and R. N. Scott. 1993. A new strategy for multifunction myoelectric control. IEEE Transactions on Biomedical Engineering 40 (1):82–94. doi:https://doi.org/10.1109/10.204774.
- Joshi, D., B. H. Nakamura, and M. E. Hahn. 2015. High energy spectrogram with integrated prior knowledge for EMG-based locomotion classification. Medical Engineering & Physics 37 (5):518–24. doi:https://doi.org/10.1016/j.medengphy.2015.03.001.
- Khushaba, R. N., A. Al-Ani, and A. Al-Jumaily. 2010. Orthogonal fuzzy neighborhood discriminant analysis for multifunction myoelectric hand control. IEEE Transactions on Biomedical Engineering 57 (6):1410–19. doi:https://doi.org/10.1109/TBME.2009.2039480.
- Khushaba, R. N., S. Kodagoda, M. Takruri, and G. Dissanayake. 2012. Toward improved control of prosthetic fingers using surface electromyogram (EMG) signals. Expert Systems with Applications 39 (12):10731–38. doi:https://doi.org/10.1016/j.eswa.2012.02.192.
- Kim, K. S., H. H. Choi, C. S. Moon, and C. W. Mun. 2011. Comparison of k-nearest neighbor, quadratic discriminant and linear discriminant analysis in classification of electromyogram signals based on the wrist-motion directions. Current Applied Physics 11 (3):740–45. doi:https://doi.org/10.1016/j.cap.2010.11.051.
- Kirshblum, S. C., S. P. Burns, F. Biering-Sorensen, W. Donovan, D. E. Graves, A. Jha, M. Johansen, L. Jones, A. Krassioukov, and M. J. Mulcahey. 2011. International standards for neurological classification of spinal cord injury (revised 2011). The Journal of Spinal Cord Medicine 34 (6):535–46. doi:https://doi.org/10.1179/204577211X13207446293695.
- Konrad, P. 2005. A Practical Introduction to Kinesiological Electromyography, Noraxon INC. USA.
- Li, G., L. Yaonan, Y. Long, and Y. Geng. 2011. Conditioning and sampling issues of EMG signals in motion recognition of multifunctional myoelectric prostheses. Annals of Biomedical Engineering 39 (6):1779–87. doi:https://doi.org/10.1007/s10439-011-0265-x.
- Liu, J., L. Xiaoyan, L. Guanglin, and P. Zhou. 2014. EMG feature assessment for myoelectric pattern recognition and channel selection: A study with incomplete spinal cord injury. Medical Engineering & Physics 36 (7):975–80. doi:https://doi.org/10.1016/j.medengphy.2014.04.003.
- Lo, H. S., and S. Q. Xie. 2012. Exoskeleton robots for upper-limb rehabilitation: State of the art and future prospects. Medical Engineering & Physics 34 (3):261–68. doi:https://doi.org/10.1016/j.medengphy.2011.10.004.
- Lorrain, T., N. Jiang, and D. Farina. 2011. Influence of the training set on the accuracy of surface EMG classification in dynamic contractions for the control of multifunction prostheses. Journal of Neuroengineering and Rehabilitation 8 (1):25. doi:https://doi.org/10.1186/1743-0003-8-25.
- Maciejasz, P., J. Eschweiler, K. Gerlach-Hahn, A. Jansen-Troy, and S. Leonhardt. 2014. A survey on robotic devices for upper limb rehabilitation. Journal of Neuroengineering and Rehabilitation 11 (1):3.
- Mesa, I., A. Rubio, I. Tubia, D. N. Joaquin, and J. Diaz. 2014. Channel and feature selection for a surface electromyographic pattern recognition task. Expert Systems with Applications 41 (11):5190–200. doi:https://doi.org/10.1016/j.eswa.2014.03.014.
- Naik, G. R., H. A.-T. Ali, and H. T. Nguyen. 2016. Transradial amputee gesture classification using an optimal number of sEMG sensors: An approach using ICA clustering. IEEE Transactions on Neural Systems and Rehabilitation Engineering 24 (8):837–46. doi:https://doi.org/10.1109/TNSRE.2015.2478138.
- Naik, G. R., D. K. Kumar, and M. Palaniswami. 2014. Signal processing evaluation of myoelectric sensor placement in low‐level gestures: Sensitivity analysis using independent component analysis. Expert Systems 31 (1):91–99. doi:https://doi.org/10.1111/exsy.12008.
- Naik, G. R., and H. T. Nguyen. 2015. Nonnegative matrix factorization for the identification of EMG finger movements: Evaluation using matrix analysis. IEEE Journal of Biomedical and Health Informatics 19 (2):478–85. doi:https://doi.org/10.1109/JBHI.2014.2326660.
- Oskoei, M. A., and H. Huosheng. 2007. Myoelectric control systems—A survey. Biomedical Signal Processing and Control 2 (4):275–94. doi:https://doi.org/10.1016/j.bspc.2007.07.009.
- Oskoei, M. A., and H. Huosheng. 2008. Support vector machine-based classification scheme for myoelectric control applied to upper limb. IEEE Transactions on Biomedical Engineering 55 (8):1956–65. doi:https://doi.org/10.1109/TBME.2008.919734.
- Phinyomark, A., C. Limsakul, and P. Phukpattaranont. 2009a. “EMG feature extraction for tolerance of 50 Hz interference.” Proc. of PSU-UNS International Conference on Engineering Technologies (ICET), Novi Sad.
- Phinyomark, A., C. Limsakul, and P. Phukpattaranont. 2009b. A novel feature extraction for robust EMG pattern recognition. Journal of Compuing 1 (1):71-80.
- Phinyomark, A., A. Nuidod, P. Phukpattaranont, and C. Limsakul. 2012. Feature extraction and reduction of wavelet transform coefficients for EMG pattern classification. Elektronika Ir Elektrotechnika 122 (6):27–32. doi:https://doi.org/10.5755/j01.eee.122.6.1816.
- Phinyomark, A., P. Phukpattaranont, and C. Limsakul. 2012. Feature reduction and selection for EMG signal classification. Expert Systems with Applications 39 (8):7420–31. doi:https://doi.org/10.1016/j.eswa.2012.01.102.
- Phinyomark, A., F. Quaine, S. Charbonnier, C. Serviere, F. Tarpin-Bernard, and Y. Laurillau. 2013. EMG feature evaluation for improving myoelectric pattern recognition robustness. Expert Systems with Applications 40 (12):4832–40. doi:https://doi.org/10.1016/j.eswa.2013.02.023.
- Phinyomark, A., F. Quaine, S. Charbonnier, C. Serviere, F. Tarpin-Bernard, and Y. Laurillau. 2014. Feature extraction of the first difference of EMG time series for EMG pattern recognition. Computer Methods and Programs in Biomedicine 117 (2):247–56. doi:https://doi.org/10.1016/j.cmpb.2014.06.013.
- Pistohl, T., D. Joshi, G. Ganesh, A. Jackson, and K. Nazarpour. 2015. Artificial proprioceptive feedback for myoelectric control. IEEE Transactions on Neural Systems and Rehabilitation Engineering 23 (3):498–507. doi:https://doi.org/10.1109/TNSRE.2014.2355856.
- Qingju, Z., and L. Zhizeng. 2006. “Wavelet de-noising of electromyography.” International Conference on Mechatronics and Automation, Luoyang.
- Quraishi, A. L., S. Maged, A. J. Ishak, S. A. Ahmad, M. K. Hasan, M. Al-Qurishi, H. Ghapanchizadeh, and A. Alamri. 2017. Classification of ankle joint movements based on surface electromyography signals for rehabilitation robot applications. Medical & Biological Engineering & Computing 55:747-758.
- Reaz, M., B. Ibne, and M. S. Hussain. 2006. Techniques of EMG signal analysis: Detection, processing, classification and applications. Biological Procedures Online 8 (1):11. doi:https://doi.org/10.1251/bpo115.
- Rechy-Ramirez, E. J., and H. Huosheng. 2015. Bio-signal based control in assistive robots: A survey. Digital Communications and Networks 1 (2):85–101. doi:https://doi.org/10.1016/j.dcan.2015.02.004.
- Resnik, L., M. R. Meucci, S. Lieberman-Klinger, C. Fantini, D. L. Kelty, R. Disla, and N. Sasson. 2012. Advanced upper limb prosthetic devices: Implications for upper limb prosthetic rehabilitation. Archives of Physical Medicine and Rehabilitation 93 (4):710–17. doi:https://doi.org/10.1016/j.apmr.2011.11.010.
- Rogers, D. R., and D. T. MacIsaac. 2013. A comparison of EMG-based muscle fatigue assessments during dynamic contractions. Journal of Electromyography and Kinesiology 23 (5):1004–11. doi:https://doi.org/10.1016/j.jelekin.2013.05.005.
- Scheme, E., and K. Englehart. 2014. “On the robustness of EMG features for pattern recognition based myoelectric control; a multi-dataset comparison.” Annual International Conference of Engineering in Medicine and Biology Society (EMBC), Chicago.
- Smith, L. H., L. J. Hargrove, B. A. Lock, and T. A. Kuiken. 2011. Determining the optimal window length for pattern recognition-based myoelectric control: Balancing the competing effects of classification error and controller delay. IEEE Transactions on Neural Systems and Rehabilitation Engineering 19 (2):186–92. doi:https://doi.org/10.1109/TNSRE.2010.2100828.
- Subasi, A. 2013. Classification of EMG signals using PSO optimized SVM for diagnosis of neuromuscular disorders. Computers in Biology and Medicine 43 (5):576–86. doi:https://doi.org/10.1016/j.compbiomed.2013.01.020.
- Tenore, F. V. G., A. Ramos, A. Fahmy, S. Acharya, R. Etienne-Cummings, and N. V. Thakor. 2008. Decoding of individuated finger movements using surface electromyography. IEEE Transactions on Biomedical Engineering 56 (5):1427–34. doi:https://doi.org/10.1109/TBME.2008.2005485.
- Tkach, D., H. Huang, and T. A. Kuiken. 2010. Study of stability of time-domain features for electromyographic pattern recognition. Journal of Neuroengineering and Rehabilitation 7 (1):21. doi:https://doi.org/10.1186/1743-0003-7-21.
- Toledo-Pérez, D. C., A. M.-P. Miguel, A. G.-L. Roberto, J. P.-G. Wilfrido, and J. Rodríguez-Reséndiz. 2019. A Study of Movement Classification of the Lower Limb Based on up to 4-EMG Channels. Electronics 8 (3):259. doi:https://doi.org/10.3390/electronics8030259.
- Tsai, A.-C., T.-H. Hsieh, J.-J. Luh, and T.-T. Lin. 2014. A comparison of upper-limb motion pattern recognition using EMG signals during dynamic and isometric muscle contractions. Biomedical Signal Processing and Control 11:17–26. doi:https://doi.org/10.1016/j.bspc.2014.02.005.
- Wang, D., X. Zhang, X. Gao, X. Chen, and P. Zhou. 2016. Wavelet packet feature assessment for high-density myoelectric pattern recognition and channel selection toward stroke rehabilitation. Frontiers in Neurology 7:197. doi:https://doi.org/10.3389/fneur.2016.00197.
- Wang, N., K. Lao, and X. Zhang. 2017. Design and myoelectric control of an anthropomorphic prosthetic hand. Journal of Bionic Engineering 14 (1):47–59. doi:https://doi.org/10.1016/S1672-6529(16)60377-3.
- Xi, X., M. Tang, S. M. Miran, and Z. Luo. 2017. Evaluation of Feature Extraction and Recognition for Activity Monitoring and Fall Detection Based on Wearable sEMG Sensors. Sensors 17 (6):1229. doi:https://doi.org/10.3390/s17061229.
- Yan, T., M. Cempini, C. M. Oddo, and N. Vitiello. 2015. Review of assistive strategies in powered lower-limb orthoses and exoskeletons. Robotics and Autonomous Systems 64:120–36. doi:https://doi.org/10.1016/j.robot.2014.09.032.
- Yi-Chun, D., C.-H. Lin, L.-Y. Shyu, and T. Chen. 2010. Portable hand motion classifier for multi-channel surface electromyography recognition using grey relational analysis. Expert Systems with Applications 37 (6):4283–91. doi:https://doi.org/10.1016/j.eswa.2009.11.072.