
 ?Mathematical formulae have been encoded as MathML and are displayed in this HTML version using MathJax in order to improve their display. Uncheck the box to turn MathJax off. This feature requires Javascript. Click on a formula to zoom.
ABSTRACT
The intensive and explosive behavioral problems associated with Autism Spectrum Disorder (ASD) are treated as ‘meltdown or tantrum,’ and it may lead to hyperactivity, impulsivity, aggression, self-injury, and irritability. The present work aims to propose and implement a noninvasive real-time deep learning based Meltdown/Tantrum Detection System (MTDS) for ASD individuals. The noninvasive physiological signals (such that heart rate, skin temperature, and galvanic skin response) were synthetically recorded with a specially designed hardware prototype. The recorded physiological signals were transmitted to an internet connected server where deep learning algorithms such as CNN, LSTM, and CNN-LSTM based Meltdown/Tantrum Detection System (MTDS) were implemented. The trained deep learning model was capable of detecting abnormal states of meltdown or tantrum through real-time received physiological signals. The proposed MTDS system was trained and tested with deep learning algorithms such as CNN, LSTM and hybrid CNN-LSTM, and it was found that hybrid CNN-LSTM was outperformed with an average training and testing accuracy of 96% with low MAE (0.10 for training and 0.04 for testing). Furthermore, 86% of the ASD caregivers favored the proposed MTDS system.
Introduction
The facial and other emotional changes could be a very vital sign to reflect the emotional changes in typically developing, but individuals with ASD often experienced difficulty to articulate their own mental and emotional states (Happé Citation2018; Montaque, Dallos, and McKenzie Citation2018; Ryan Citation2010). An individual with ASD could exhibit minimum of one challenging behavior such as destruction of property, screaming, shouting, and kicking. This kind of challenging behavior could be disruptive and destructive to ASD individuals themselves or others (McGinnis et al. Citation2019). The occurrence of predisposing, precipitating and perpetuating events such as sensitivity to sensory stimulation, the frustration of needs, and criticism from parents could lead to meltdown or tantrum (Critchley Citation2002).
In ASD, the hyperactive state such as meltdown or tantrum was described as escalating episodes of conflicts & distress, in which intense and dangerous explosions of difficult behaviors could occur frequently. ASD meltdowns or tantrums could be one of the most challenging parts of autistic persons and their caregivers (Bessette Gorlin et al. Citation2016). In comparison to the general population, individuals with ASD had more risk of developing challenging behavior since meltdown or tantrum associated with negative outcome lead to a decreased quality of life (Anzalone et al. Citation2014; Fitzpatrick et al. Citation2016). It could be essential to frequently detect or monitor such kind of abnormal behavior accurately in ASD individuals.
Noninvasive physiological signals could be able to provide sensitive and convenient measure of assessing changes in sympathetic arousal associated with emotions, cognition and attention. Some noninvasive physiological changes such as body sweating, abnormal heart rate and rise in body temperature could be noticed during hyperactive, meltdown or tantrum related states (Sigman et al. Citation2003). Furthermore, an efficient system could be required to represent and extract all the information from varying noninvasive physiological signals. It was very hard to fetch real-time physiological data using wired electronics due to the assorted nature of autistics. Wireless Internet-connected Things (IoT) architecture was utilized for healthcare monitoring by user-friendly clinical applications with fast access mobility and envisioned to the modern smart health care system to collect health related information (Baker et al. Citation2017; Hu et al. Citation2017; Luo et al. Citation2018; Yugha and Chithra Citation2020). Machine and Deep learning was proposed by several authors to overcome the limitations by considering in depth information from physiological datasets (Alzubi, Nayyar, and Kumar Citation2018; Cheng et al. Citation2018; Lecun, Bengio, and Hinton Citation2015; Tahsien, Karimipour, and Spachos Citation2020). An efficient internet connected monitoring system named “BioSenHealth 1.0” was implemented and identified with better accuracy at low cost (Nayyar, Puri, and Nguyen Citation2019).
Based on physiological signals, the noninvasive systems and efficient deep learning algorithms could be able to provide sufficient information about hyperactive emotion characteristic of meltdown or tantrum situations in ASD individuals. The objective of this paper was focused to propose an efficient Meltdown or Tantrum Detection System (MTDS) framework for ASD individuals. The proposed MTDS system is able to fetch physiological signals such as Skin Temperature (ST), Heart Rate (HR) and Galvanic Skin Response (GSR) through the proposed data acquisition system. On basis of acquired signals, deep learning models were trained and tested to make future predictions for the classification of the state of normal behavior or the state of meltdown/tantrum in ASD individuals. This paper was further organized with related literature studies, design/implementation of MTDS, and results/discussions after implementations with concluding remarks.
Related Studies
Earlier researchers were using different invasive tools or methods on the basis of samples of blood, saliva or urine to detect the behavioral changes, but these invasive tools/methods were not suitable to be used as a continuous real-time analyzer and in daily life too (Hufnagel et al. Citation2017). Relevant information must be extracted from the physiological signal received from the sensors implanted or placed on the skin in order to support a specific healthcare application (Hirstein, Iversen, and Ramachandran Citation2001). Welch suggested that the changes in physiological signals could be measured by sensor based devices and these changes could be helpful in diagnosis of the subjects (Welch Citation2012).
Physiological parameters such as Skin Temprature (ST), Heart Rate (HR) and Galvanic Skin Response (GSR) considered as an invaluable data source, which could assist in the detection of disease, rehabilitation and treatment (Lydon, Healy, and Dwyer Citation2013). Goodwin et al. (Goodwin et al. Citation2006) observed that the physiology of a person affected with autism could be different in outside view than what was measured inside the body. The cardiac responses of the autistic subject were examined during crying and happy stimulus, and observed variations in cardiac rate with changed stimulus sources (Luo et al. Citation2018). The patterns of arrhythmic heart rate in ASD individuals were observed during the stressed environment (Acharya et al. Citation2018; Sasikumar, George Priya Doss, and Adalarasu Citation2015). In comparison to the typically developed subjects, GSR & HR in autistic subjects resulted in atypical and individualized characteristics (Panju et al. Citation2015; Sasikumar, George Priya Doss, and Adalarasu Citation2015).
The wearable devices could observe changes in physiological signals noninvasively, which could help in predicting the anxiety level & episodes of self-injury and increase the self-awareness of their internal emotional state to regulate their emotions. Ko et al. (Koo et al. Citation2018) suggested that 72% parents of the ASD individuals were willing to monitor changes in physiological signals or behavioral parameters of their children to understand their meltdown/tantrum or other emotions. Some physiological sensor based wearable products available in the market were presented in . The physiological signals such as HR, GSR, and ST could be considered as ASD footprints during hyperactive, meltdown, tantrum, or other related states.
Table 1. Physiological parameters with wearable devices
The state of meltdown or tantrum could be hard to detect or understand in comparison to facial emotions or other behavior of ASD. Today’s advancement in technology could help improve the diagnosis process of ASD, but such diagnoses were not much effective to detect the meltdown/tantrum and provide/arrange remedy to these dangerous states. The generated data was continuously generating in incremental phase multivariate time series data, which could cover symptoms and scenarios, associated with ASDs. The implementation of traditional detection systems failed to work with such kind of large and continuously varying datasets (Krupa et al. Citation2016; Litjens et al. Citation2017). The monitoring of physiological signals through noninvasive methods could play very crucial role to provide certain aid to ASD individuals for the detection or prediction of meltdown/tantrum related states (Cabibihan et al. Citation2018; Krupa et al. Citation2016). Without the detailed knowledge regarding meltdown or tantrum related events, it could be complicated to start any treatment or therapy of ASD individuals. An efficient system could be required, which could work with multivariate and diverse physiological data for the detection of meltdown or tantrum state in an ASD individual. Working on earlier computer-based designs for meltdown detection was a tedious task for parents and clinicians.
Design and Implementation of MTDs
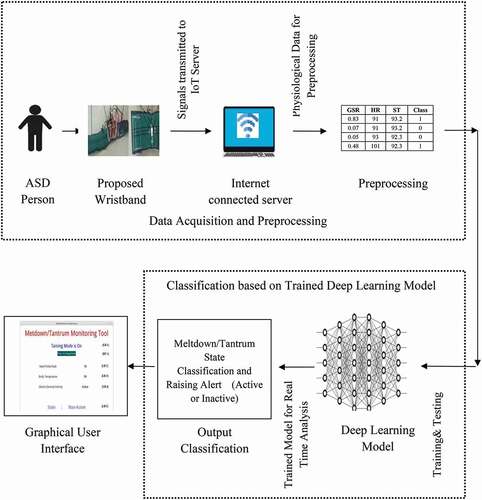
Deep learning based meltdown or tantrum detection system (MTDS) for ASD was proposed, which was implemented on noninvasive multivariate physiological data related to Heart Rate (HR), Galvanic Skin Response (GSR) and Skin Temperature (ST). This proposed design was capable of updating the data continuously and could be able to issue an alert if meltdown or tantrum state occurred. An interactive graphical environment of the proposed system was designed, which made it easy to understand and access the meltdown or tantrum related behavior by clinicians as well as parents. The individualized physiological signals were remotely transferred to an MTDS implemented internet connected server. Current individualized monitoring and classification of physiological data was then reflected on the internet-connected graphical monitoring tool, which could be accessed remotely by clinicians and parents at any time & anywhere. The proposed design was capable of detecting a meltdown or tantrum state in ASD individuals that could be further used in the improvement of behavior related issues.
A deep learning based hardware wristband prototype was designed to acquire individualized physiological signals such as HR, ST and GSR, which could be able to transmit data to the internet connected server. The deep learning model was implemented on the acquired individualized physiological signals at the IoT server to detect the meltdown or tantrum state. The unique feature of the proposed design was a remotely accessible and user-friendly graphical interface to access the runtime detection by clinicians and parents. These features were facilitated to provide early remedy and to find the reason behind frequently occurring intense and dangerous events. The block diagram of the overall system was shown in .
Figure 1. MTDS block diagram.
Hardware Prototype
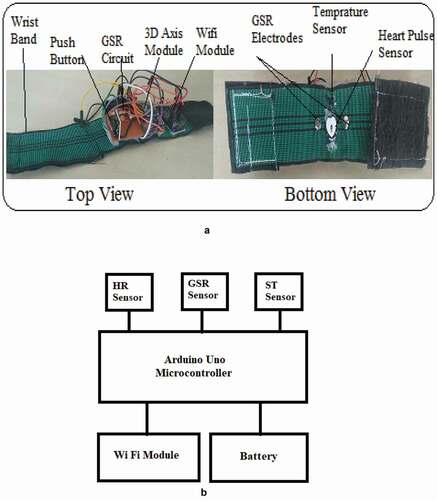
A specialized hardware prototype was designed in the form of comfortable wearable wristband to detect ASD physiological signals. HR, ST and GSR could play a very crucial role in detecting the mental state of human beings. So, various sensors such as photoplethysmogram (PPG), LM35 transistor and GSR were implanted on the proposed wristband for the measurement of HR, ST, and GSR. The recorded physiological signals were processed and controlled by a battery-operated Arduino Nano, which was further connected to the IoT server through a Wi-Fi module. Prototype design of the proposed wireless IoT connected hardware wristband is presented in .
Figure 2. (a) Specially designed hardware wristband prototype. (b) Specially designed hardware wristband connectivity diagram.
Data Acquisition and Preprocessing
The physiological signals such as HR, ST and GSR were recorded from the wristband to incorporate multimodal physiological signals, and these recorded signals were further transmitted to the internet connected server. For the proper recording of the data, the synthetic sessions were conducted in a total duration of 30 minutes. Null values were removed from the recorded data in the first phase of the preprocessing. After removal of null values, the MinMax scaling technique was applied to shrink raw data in an acceptable range of 0 to 1 without modifying the shape of original data. The MinMax scaling divided the minimum values of the feature and then divided by the difference between the original maximum and minimum values. The MinMax scalar formula was applied to scale each feature (xi) as
The initial pre-classification system was implemented to identify the relevant classification labels with a low or high state of acquired data using the Isolation Forest outlier detection method. The sensitivity of the outlier system was pre-adjusted at 1% to acquire top 1% outlier from multivariate physiological data (HR, GSR and ST) as a threshold for tantrum or meltdown state.
Hybrid CNN-LSTM
A time series data was a sequence of digital signals that was taken sequentially in time steps to predict real time observations. In the present work, the hybrid combination of one-dimensional CNN and LSTM algorithm was utilized for the analysis of acquired time series data and the performance of CNN-LSTM algorithm was also compared with CNN and LSTM. In the CNN-LSTM model, an initial convolutional layer received one-dimensional signal as the input. Each convolution layer was convoluted with their respective kernel (filter) size as
where Y is signal, F wis filter, N is the number of signals and x are output vectors, respectively. Then, CNN-LSTM algorithm initially established a shallow CNN to extract the original features of the data. Furthermore, its output became a data pool of small amplitude. The Leaky ReLU function was presented as
The Softmax function was presented as
These extracted features were converted into a feature matrix and then input into the LSTM for feature fusion. In the CNN-LSTM hybrid model, local features were extracted from the convolutional layer and the LSTM layer then used the ordering of said features. The standard symbols and equations for LSTM were presented as
where
Xt – input vector,
Ht-1 – previous (cell) output,
Ct-1 – previous (cell) memory,
Ht – present (cell) output,
Ct – present (cell) memory,
Ht+1 – next (cell) output,
Ct+1 – next (cell) memory,
W and V – weight vector,
σ – sigmoid function,
tanh – tangent function,
‘*’ represented the element wise multiplication function,
‘+’ represented the element wise addition function.
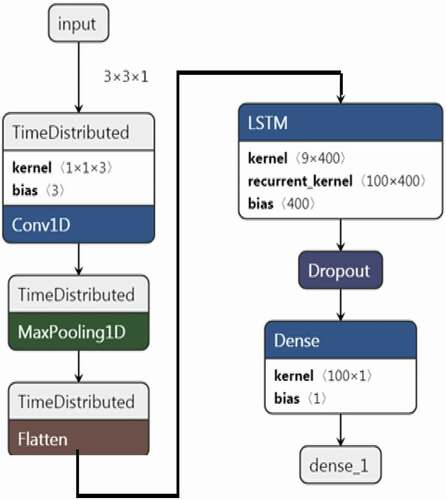
The architecture of the utilized hybrid CNN-LSTM model, including details of layers, input elements, and extracted output, is shown in .
Figure 3. CNN-LSTM architecture for the proposed system.
Implementation Procedure
The work flow of the deep learning based proposed MTDS is shown in . Training and testing flow of the proposed MTDS system was presented in ). The monitoring & validation flow was presented in ). Furthermore, the overall training-to-monitoring procedure was described through four implementation procedural parts such as ‘procedure for data acquisition and pre-classification,’ ‘procedure for training and testing of deep learning models,’ ‘procedure for meltdown or tantrum detection,’ and ‘procedure for analysis of meltdown or tantrum detection.’
Figure 4. Proposed work flow diagram of the proposed MTDS. (a) Proposed work flow of CNN-LSTM training and testing. (b) Proposed Work flow of CNN-LSTM validation.
Figure 4. Continued.
Procedure for Data Acquisition and Preprocessing
The following steps were followed for data acquisition and pre-classification of the proposed system, as presented in :
Individualized physiological signals could be recorded from the wristband and transmitted to the internet-connected server.
Redundant and null values were removed from the collected physiological data and then scaled between 0 and 1 using the MinMax scaling algorithm.
Then, a pre-classification system performed the classification of initial data based on the 1% top outlier values of HR, GSR and ST. The recognition signal had reflected the present meltdown or tantrum state of autistic, such as high or low. Here, a high state was treated as ‘1ʹ and a low state as ‘0ʹ.
Before training of the deep learning based MTDS system at the server, the data acquisition module started removing redundant data entries for the training of the proposed system.
Figure 5. Procedure for data acquisition and pre-classification.
Procedure for Training and Testing of Deep Learning Model
The following steps were followed for the identification of the best model between CNN, LSTM and hybrid CNN-LSTM algorithm, as presented in :
Acquired pre-classified and pre-processed data fed into the system for training and testing.
Training and testing were conducted through pre-classified and pre-processed data entries, and furthermore, K-fold (K = 10) validation was also performed for the optimum deep learning model in this work.
The best outcome of the proposed system with acquired physiological signals was identified by a applying deep learning model for 300 epochs (training iterations).
Figure 6. Procedure for training and testing of the deep learning algorithm.
Procedure for Meltdown or Tantrum Detection and Alerting
The following steps were followed for meltdown or tantrum detection in ASD, as presented in :
The trained optimum deep learning model was deployed for meltdown or tantrum detection in ASD.
Individualized physiological signals were recorded from the wristband and transmitted to an internet-connected server in the form of a stream.
The proposed monitoring system was initialized for meltdown or tantrum state detection.
Data and monitoring outcomes were continuously stored at the server end. Caregiver or clinician could analyze the state of tantrum or meltdown by accessing the stored data. The system was capable of generating an e-mail alert to the caregiver or clinician to highlight the state of tantrum or meltdown.
Figure 7. Procedure for meltdown or tantrum detection and alerting.
Procedure for Monitoring of Meltdown or Tantrum State
The following steps have been followed for the analysis of the proposed system using synthetically updated data, as presented in .
Recorded data along with the meltdown or tantrum state fed to the monitoring system.
Caregiver or clinician could access recorded data remotely using the proposed graphical user interface.
Figure 8. Procedure for monitoring of meltdown or tantrum state.
Results and Discussion
The results of the proposed MTDS system were presented and discussed in this section. First, the comparative analysis of CNN, LSTM, and CNN-LSTM models in the MTDS system was performed and the best model was chosen; further evaluation of the best chosen model was performed through training & testing analysis on the basis of parameters such as accuracy, MAE, precision, recall and F1-socre. The K-fold (K = 10) cross-validation strategy was employed to evaluate the robustness of the proposed model. Furthermore, the analysis of the proposed MTDS design was performed through the validation of caregiver’s responses and statistical validation of caregiver’s responses.
Comparative Analysis of CNN, LSTM and Hybrid CNN-LSTM
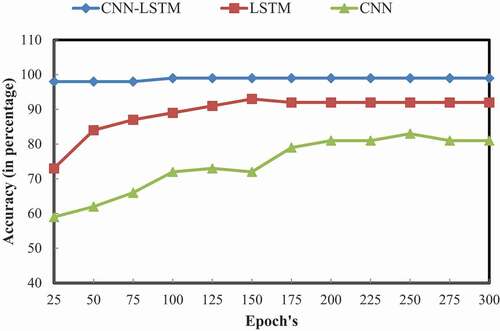
The deep learning algorithms such as CNN, LSTM and hybrid CNN-LSTM were utilized to design an efficient MTDS system for tantrum/meltdown state in individuals with ASD. The performance of MTDS was evaluated for 300 epochs, and comparative analysis was conducted within utilized deep learning related algorithms such as CNN, LSTM, and CNN-LSTM. Performance analysis was conducted on the basis of training accuracy (as presented in and ) and testing accuracy (as presented in & ) to identify a better algorithm for the proposed MTDS system. It was observed that the hybrid CNN-LSTM algorithm performed better than CNN and LSTM for detection of the meltdown and tantrum states through the MTDS system.
Table 2. Training accuracy of CNN-LSTM vs. LSTM vs. CNN
Table 3. Testing accuracy of CNN-LSTM vs. LSTM vs. CNN
Figure 9. Training accuracy of CNN-LSTM vs. LSTM vs. CNN.
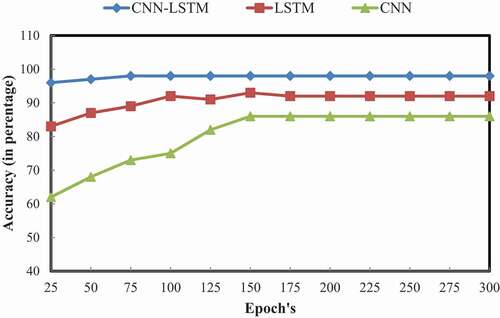
Figure 10. Testing accuracy of CNN-LSTM vs. LSTM vs. CNN.
Training and Testing Analysis of CNN-LSTM Based MTDS
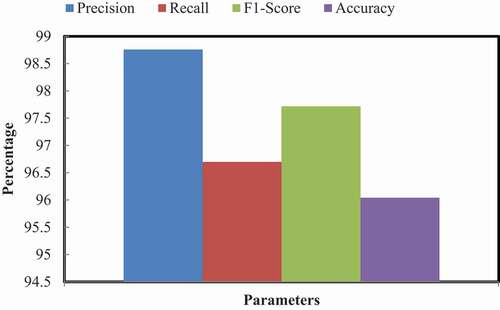
Training and testing performance of the CNN-LSTM based MTDS with 90% training data & 10% testing data was analyzed based on parameters, viz., accuracy & MAE, as presented in and , respectively. Furthermore, more specific results of the MTDS for meltdown or tantrum detection in ASD with acquired 10% of the testing dataset was performed based on basic parameters, viz., precision, recall and F1-score, as presented in .
Figure 11. MTDS training and testing accuracy.
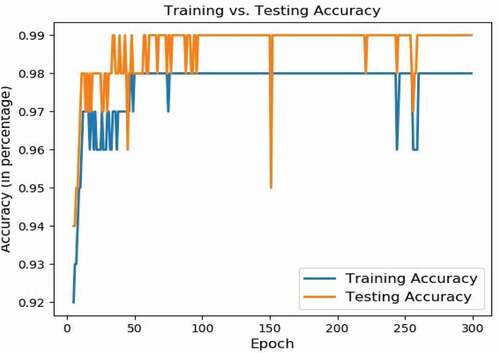
Figure 12. MTDS training and testing MAE.
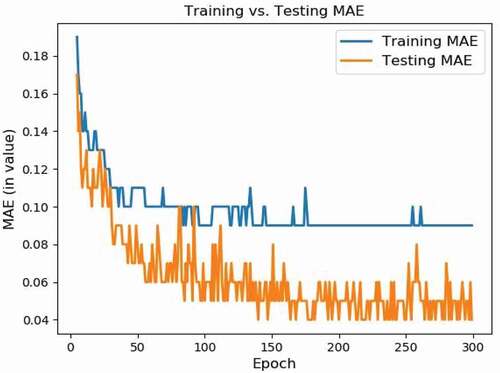
Figure 13. MTDS recall.
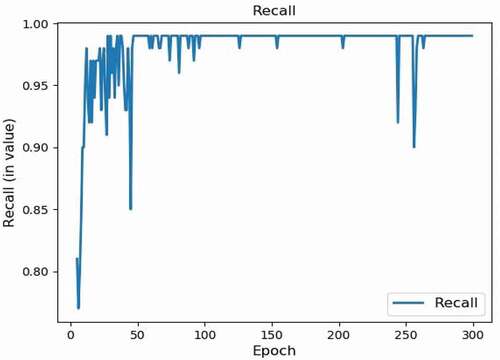
Figure 14. MTDS precision.
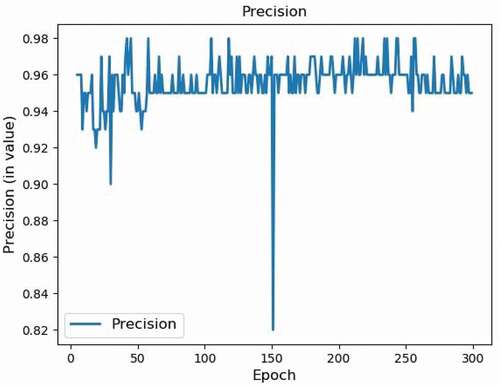
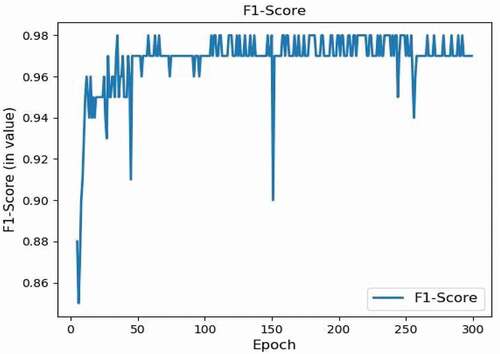
Figure 15. MTDS F1-score.
K-Fold Cross-Validation of CNN-LSTM Based MTDS
The performance of the trained and tested CNN-LSTM based MTDS was validated with the K-fold (K = 10) method for cross validation. The average K-fold validation results for parameters such as accuracy, precision, recall and F1 score and the confusion matrix for predictive active & predictive non-active state were presented in and .
Table 4. Average of K-fold cross-validation of MTDS
Figure 16. Average of K-fold cross-validation of MTDS.
Validation Based on Caregiver’s Responses
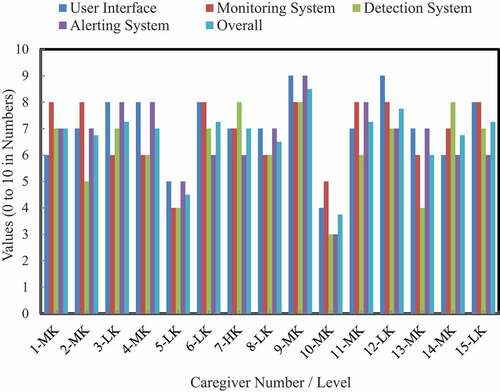
The caregivers of both ASD and TD group individuals participated to analyze the proposed system with different levels of knowledge regarding autism, such as Highly Knowledgeable (HK), Average Knowledgeable (AK), and Low Knowledgeable (LK). Here, the roles of caregivers are only to understand the proposed framework and give their verbal reviews on the proposed framework. There is no other involvement of human or animal in this work. Also, during this procedure, none of the caregiver or participant had received any psychoactive medication. The participant and caregiver had the right to withdraw from the study at any time. No name is disclosed throughout this study. The responses of different knowledge levels of caregivers about the proposed system were evaluated to maintain the unbiased validation. The performance of the proposed system was analyzed on a scale of 0 to 10 for the four parameters, viz., user interface, monitoring system, detection system, and alerting system. Average ratings for defined parameters of the proposed system are presented in and .
Table 5. Caregiver’s responses for the proposed system
Figure 17. Responses of related caregivers for defined parameters and their overall mean.
Statistical Analysis of Caregiver’s Responses
The statistical analysis was conducted to identify the difference in caregiver’s responses for ASD and TD group. As presented in , the mean scores related to caregivers of the ASD group were found to be 6.55, which was statistically similar to the mean score of the TD caregivers group where the mean score was found to be 6.25 with two-tailed unequal variance t-test statistics −0.85 at p < .05. Both groups of ASD and TD caregivers rated the overall system as statistically similar.
Table 6. Statistical analysis based on caregiver’s responses
Discussion
The training and testing analysis of the hybrid CNN-LSTM was outperformed with an average training and testing accuracy of 96% with low MAE (0.10 for training and 0.04 for testing). The precision, recall, and F1-score values for the proposed CNN-LSTM model resulted in 0.98, 0.95, and 0.97, respectively. The outcome accuracy of hybrid CNN-LSTM was quite high with least losses. Further analysis of caregiver responses of ASD and TD groups was conducted based on parameters such as user Interface, monitoring system, detection system and alerting system and resulted in 86% above-average (greater than 5) favored responses on the rating scale of 0–10. The conducted statistical analysis had identified no difference in the caregiver responses of both ASD and TD groups of individuals about the proposed MTDS. The proposed MTDS was also compared with the earlier available related systems based on the attained accuracy, as presented in . It was observed from the comparative analysis that the proposed CNN-LSTM based MTDS system resulted in higher accuracy in comparison to the available technologies.
Table 7. Comparative analysis of the proposed system and available technologies/systems
Conclusion
The detection of meltdown or tantrum in ASD could be complicated due to the complex nature of neurological developmental disorders. Predetermined and expert knowledge was required to successfully detect the state of meltdown or tantrum, since facial emotions or behavior only were not able to identify the state of meltdown or tantrum in ASD. To overcome this problem, a CNN-LSTM based MTDS system was designed and tested for the collected physiological signals. The graphical interface tool was also designed for easy access of this design for clinicians and parents, which could easily reflect the real-time data of the physiological signals and the classification of the state of meltdown/tantrum as active or inactive. It was observed from the experimental results that the proposed deep learning based MTDS design achieved an 10-fold accuracy of 98% with 0.1 MAE. The caregivers were also excited with the most important feature of the system that proposed that the system could perform equally irrespective of ASD and TD groups. It was concluded that the use of noninvasive, real time and intelligent approach for meltdown or tantrum detection could help reduce the drastic behavior of ASD with safe and economic participation. In the clinical perspective, the effective real-time identification of meltdown or tantrum state could help in the improvement of related behavioral issues in autistic subjects.
Disclosure statement
No potential conflict of interest was reported by the author(s).
References
- Acharya, U. R., S. L. Oh, Y. Hagiwara, J. H. Tan, and H. Adeli. 2018. Deep convolutional neural network for the automated detection and diagnosis of seizure using EEG signals. Computers in Biology and Medicine 100 (9):270–78. doi:https://doi.org/10.1016/j.compbiomed.2017.09.017.
- Agrafioti, F., D. Hatzinakos, and A. K. Anderson. 2012. ECG pattern analysis for emotion detection. IEEE Transactions on Affective Computing 3 (1):102–15. doi:https://doi.org/10.1521/jaap.1.1976.4.3.411.
- Alhagry, S., A. A. Fahmy, and R. A. El-Khoribi. 2017. Emotion recognition based on EEG using LSTM recurrent neural network. International Journal of Advanced Computer Science and Applications 8 (10):8–11. doi:https://doi.org/10.14569/ijacsa.2017.081046.
- Alzubi, J., A. Nayyar, and A. Kumar. 2018. Machine learning from theory to algorithms: An overview. Journal of Physics: Conference Series 1142 (1). doi: https://doi.org/10.1088/1742-6596/1142/1/012012.
- Anzalone, S. M., E. Tilmont, S. Boucenna, J. Xavier, A.-L. Jouen, N. Bodeau, … D. Cohen. 2014. How children with autism spectrum disorder behave and explore the 4-dimensional (spatial 3D + time) environment during a joint attention induction task with a robot. Research in Autism Spectrum Disorders 8:814–26. doi:https://doi.org/10.1016/j.rasd.2014.03.002.
- Apple. 2019. Accessed March 7, 2019. https://www.apple.com/ie/apple-watch-series-4/.
- Awake Labs. 2019. https://awakelabs.com/news-clinical-trial-community-pilot/.
- Baker, S. B., W. E. I. Xiang, S. Member, and I. A. N. Atkinson. 2017. Internet of things for smart healthcare : Technologies, challenges, and opportunities. IEEE Access 5:26521–44. doi:https://doi.org/10.1109/ACCESS.2017.2775180.
- Bessette Gorlin, J., C. P. McAlpine, A. Garwick, and E. Wieling. 2016. Severe childhood Autism: The family lived experience. Journal of Pediatric Nursing 31 (6):580–97. doi:https://doi.org/10.1016/j.pedn.2016.09.002.
- Cabibihan, J. J., R. Chellali, C. W. C. So, M. Aldosari, O. Connor, A. Y. Alhaddad, and H. Javed. 2018. Social robots and wearable sensors for mitigating meltdowns in autism - A pilot test. Lecture Notes in Computer Science (including subseries Lecture Notes in Artificial Intelligence and Lecture Notes in Bioinformatics), Vol. 11357 LNAI. Qingdao, China: Springer International Publishing. doi:https://doi.org/10.1007/978-3-030-05204-1_11.
- Cheng, B., and G. Liu. 2008. Emotion recognition from surface EMG signal using wavelet transform and neural network. 2nd International Conference on Bioinformatics and Biomedical Engineering, ICBBE 2008, Vol. 1, Shanghai, China, 1363–66. doi:https://doi.org/10.1109/ICBBE.2008.670.
- Cheng, Y., S. Y. Luo, H. C. Lin, and C. S. Yang. 2018. Investigating mobile emotional learning for children with autistic spectrum disorders. International Journal of Developmental Disabilities 64 (1):25–34. doi:https://doi.org/10.1080/20473869.2016.1206729.
- Critchley, H. D. 2002. Review: Electrodermal responses: What happens in the brain. The Neuroscientist 8 (2):132–42. doi:https://doi.org/10.1177/107385840200800209.
- Empatica. 2019. https://store.empatica.com/products/e4-wristband?variant=39588207747.
- Empatica Inc. 2019. https://www.empatica.com/embrace2/.
- Fitzpatrick, S. E., L. Srivorakiat, L. K. Wink, E. V. Pedapati, and C. A. Erickson. 2016. Aggression in autism spectrum disorder: Presentation and treatment options. Neuropsychiatric Disease and Treatment 12:1525–38. doi:https://doi.org/10.2147/NDT.S84585.
- Goodwin, M. S., J. Groden, W. F. Velicer, L. P. Lipsitt, M. G. Baron, S. G. Hofmann, and G. Groden. 2006. Cardiovascular arousal in individuals with Autism. Focus on Autism and Other Developmental Disabilities 21 (2):100–23. doi:https://doi.org/10.1177/10883576060210020101.
- Guendil, Z., Z. Lachiri, C. Maaoui, and A. Pruski 2015. Emotion recognition from physiological signals using fusion of wavelet based features. 2015 7th International Conference on Modelling, Identification and Control (ICMIC), 1–6. Sousse, Tunisia: IEEE. doi:https://doi.org/10.1109/ICMIC.2015.7409485.
- Happé, F. 2018. Why are savant skills and special talents associated with autism? World Psychiatry 17 (3):280–81. doi:https://doi.org/10.1002/wps.20552.
- Hernando, D., S. Roca, J. Sancho, Á. Alesanco, and R. Bailón. 2018. Validation of the apple watch for heart rate variability measurements during relax and mental stress in healthy subjects. Sensors 18 (8):2619. doi:https://doi.org/10.3390/s18082619.
- Hirstein, W., P. Iversen, and V. S. Ramachandran. 2001. Autonomic responses of autistic children to people and objects. Proceedings of the Royal Society B: Biological Sciences 268 (1479):1883–88. doi:https://doi.org/10.1098/rspb.2001.1724.
- Hu, P., S. Dhelim, H. Ning, and T. Qiu. 2017. Survey on fog computing: Architecture, key technologies, applications and open issues. Journal of Network and Computer Applications, Accepted. doi:https://doi.org/10.1016/j.jnca.2017.09.002.
- Hufnagel, C., P. Chambres, P. R. Bertrand, and F. Dutheil. 2017. The need for objective measures of stress in Autism. Frontiers in Psychology 8 (January):8–11. doi:https://doi.org/10.3389/fpsyg.2017.00064.
- Is QardioCore Clinically Validated. 2019. https://support.getqardio.com/hc/en-.
- Koo, S. H., K. Gaul, S. Rivera, T. Pan, and D. Fong. 2018. Wearable technology design for Autism spectrum disorders. Archives of Design Research 31 (1):37–55. doi:https://doi.org/10.15187/adr.2018.02.31.1.37.
- Krupa, N., K. Anantharam, M. Sanker, S. Datta, and J. V. Sagar. 2016. Recognition of emotions in autistic children using physiological signals. Health and Technology 6 (2):137–47. doi:https://doi.org/10.1007/s12553-016-0129-3.
- Lan, Z., O. Sourina, L. Wang, and Y. Liu. 2016. Real-time EEG-based emotion monitoring using stable features. Visual Computer 32 (3):347–58. doi:https://doi.org/10.1007/s00371-015-1183-y.
- Lecun, Y., Y. Bengio, and G. Hinton. 2015 May 27. Deep learning. Nature. doi:https://doi.org/10.1038/nature14539.
- Lin, Y. P., C. H. Wang, T. P. Jung, T. L. Wu, S. K. Jeng, J. R. Duann, and J. H. Chen. 2010. EEG-based emotion recognition in music listening. IEEE Transactions on Biomedical Engineering 57 (7):1798–806. doi:https://doi.org/10.1109/TBME.2010.2048568.
- Litjens, G., T. Kooi, B. E. Bejnordi, A. Arindra, A. Setio, F. Ciompi, … C. I. Sánchez. 2017. A survey on deep learning in medical image analysis. Medical Image Analysis Journal 42:60–88. doi:https://doi.org/10.1016/j.media.2017.07.005.
- Luo, E., M. Z. A. Bhuiyan, G. Wang, M. A. Rahman, J. Wu, and M. Atiquzzaman. 2018. PrivacyProtector: Privacy-protected patient data collection in IoT-based healthcare systems. IEEE Communications Magazine 56 (2):163–68. doi:https://doi.org/10.1109/MCOM.2018.1700364.
- Lydon, S., O. Healy, and M. Dwyer. 2013. An examination of heart rate during challenging behavior in Autism spectrum disorder. Journal of Developmental and Physical Disabilities 25 (1):149–70. doi:https://doi.org/10.1007/s10882-012-9324-y.
- McGinnis, R. S., E. W. McGinnis, J. Hruschak, N. L. Lopez-Duran, K. Fitzgerald, K. L. Rosenblum, and M. Muzik. 2019. Rapid detection of internalizing diagnosis in young children enabled by wearable sensors and machine learning. PLoS ONE 14 (1):1–16. doi:https://doi.org/10.1371/journal.pone.0210267.
- Mirmohamadsadeghi, L., A. Yazdani, and J.-M. Vesin 2016. Using cardio-respiratory signals to recognize emotions elicited by watching music video clips. 2016 IEEE 18th International Workshop on Multimedia Signal Processing (MMSP), Vol.1, 1–5. Montreal, Canada: IEEE. doi:https://doi.org/10.1109/MMSP.2016.7813349.
- Monajati, M., S. H. Abbasi, F. Shabaninia, and S. Shamekhi. 2012. Emotions states recognition based on physiological parameters by employing of fuzzy-adaptive resonance theory. International Journal of Intelligence Science 2 (4):166–75. doi:https://doi.org/10.4236/ijis.2012.224022.
- Montaque, I., R. Dallos, and B. McKenzie. 2018. It feels like something difficult is coming back to haunt me: An exploration of ‘meltdowns’ associated with autistic spectrum disorder from a parental perspective. Clinical Child Psychology and Psychiatry 23 (1):125–39. doi:https://doi.org/10.1177/1359104517730114.
- Nayyar, A., V. Puri, and N. G. Nguyen (2019). BioSenHealth 1.0: A novel internet of medical things (IoMT)-based patient health monitoring system. In S. Bhattacharyya, A. E. Hassanien, D. Gupta, A. Khanna, and I. Pan (Eds.), International Conference on Innovative Computing and Communications, Vol.55, 155–64. Singapore: Springer Singapore. doi:https://doi.org/10.1007/978-981-13-2324-9_16.
- Northrup, C. M., J. Lantz, T. Hamlin, and C. M. Northrup. 2016. Wearable stress sensors for children with Autism spectrum disorder with in situ alerts to caregivers via a mobile phone corresponding author. Iproceedings 2 (1):9–10. doi:https://doi.org/10.2196/iproc.6119.
- Oh, S. L., E. Y. K. Ng, R. S. Tan, and U. R. Acharya. 2018. Automated diagnosis of arrhythmia using combination of CNN and LSTM techniques with variable length heart beats. Computers in Biology and Medicine 102:278–87. doi:https://doi.org/10.1016/j.compbiomed.2018.06.002.
- Panju, S., J. Brian, A. Dupuis, E. Anagnostou, and A. Kushki. 2015. Atypical sympathetic arousal in children with autism spectrum disorder and its association with anxiety symptomatology. Molecular Autism 1–10. doi:https://doi.org/10.1186/s13229-015-0057-5.
- Qardio. 2019. https://www.getqardio.com/qardiocore-wearable-ecg-ekg-monitor-iphone/.
- Ryan, S. 2010. “Meltdowns,” surveillance and managing emotions; going out with children with autism. Health & Place 16 (5):868–75. doi:https://doi.org/10.1016/j.healthplace.2010.04.012.
- Samara, A., M. L. R. Menezes, and L. Galway 2016. Feature extraction for emotion recognition and modelling using neurophysiological data. 15th International Conference on Ubiquitous Computing and Communications and 2016 International Symposium on Cyberspace and Security (IUCC-CSS), 138–44. Granada, Spain: IEEE. doi:https://doi.org/10.1109/IUCC-CSS.2016.027.
- Sasikumar, K., C. George Priya Doss, and K. Adalarasu. 2015. Analysis of physiological signal variation between autism and control group in south indian population. Biomedical Research (India) 26 (3):525–29.
- Sentio Solutions. 2019. Accessed March 7, 2019. https://www.myfeel.co/reserve.
- Sigman, M., C. Dissanayake, R. Corona, and M. Espinosa. 2003. Social and cardiac responses of young children with Autism. Autism 7 (2):205–16. doi:https://doi.org/10.1177/1362361303007002007.
- Simm, W., M. A. Ferrario, A. Gradinar, M. T. Smith, S. Forshaw, I. Smith, and J. Whittle (2016). Anxiety and Autism : Towards personalized digital health. CHI Conference on Human Factors in Computing Systems, 1–12. San Jose, CA. doi:https://doi.org/10.1145/2858036.2858259.
- Tahsien, S. M., H. Karimipour, and P. Spachos. 2020. Machine learning based solutions for security of internet of things (IoT): A survey. Journal of Network and Computer Applications 161 (April). doi: https://doi.org/10.1016/j.jnca.2020.102630.
- ViSi Mobile. n.d. https://www.visimobile.com/visi-mobile/.
- Weenk, M., H. van Goor, B. Frietman, L. J. Engelen, C. J. van Laarhoven, J. Smit, … T. H. Van De Belt. 2017. Continuous monitoring of vital signs using wearable devices on the general ward: Pilot study. JMIR MHealth and UHealth 5 (7):e91. doi:https://doi.org/10.2196/mhealth.7208.
- Welch, K. C. 2012. Physiological signals of autistic children can be useful. IEEE Instrumentation & Measurement Magazine 15 (1):28–32. doi:https://doi.org/10.1109/MIM.2012.6145259.
- Yu, G., X. Li, D. Song, X. Zhao, P. Zhang, Y. Hou, and B. Hu (2016). Encoding physiological signals as images for affective state recognition using convolutional neural networks. 2016 38th Annual International Conference of the IEEE Engineering in Medicine and Biology Society (EMBC), Vol. 2016-octob, 812–15. Florida, USA: IEEE. doi:https://doi.org/10.1109/EMBC.2016.7590825.
- Yugha, R., and S. Chithra. 2020. A survey on technologies and security protocols : Reference for future generation IoT. Journal of Network and Computer Applications 169 (September):2019. doi:https://doi.org/10.1016/j.jnca.2020.102763.
- Zhao, S., A. Gholaminejad, G. Ding, Y. Gao, J. Han, and K. Keutzer. 2019. Personalized emotion recognition by personality-aware high-order learning of physiological signals. ACM Transactions on Multimedia Computing, Communications, and Applications 15 (1s):1–18. doi:https://doi.org/10.1145/3233184.