
 ?Mathematical formulae have been encoded as MathML and are displayed in this HTML version using MathJax in order to improve their display. Uncheck the box to turn MathJax off. This feature requires Javascript. Click on a formula to zoom.
ABSTRACT
Due to the excessive use of photovoltaic (PV) systems as a grid connected or standalone micro-grid, and high installation cost of these systems, it is recommended and required to properly size them. This research paper presents and offers a new approach for determining the optimum grid connected PV size, feeding a typical house in Tunisia, as well as the efficient power flow management, in order to improve its profitability, reliability and feasibility under a 20-year study period. A multiobjective function is proposed and formulated to be optimized using two optimization algorithms, which are the particle swarm optimization (PSO) and the genetic algorithm (GA). In fact, the objectives consider the economic aspect in terms of maximizing the net present value (NPV) and a non-economic concern, including minimizing the lost of power supply probability (LPSP). Simulation results showed that the PSO algorithm is faster than the GA and presents better performance in terms of speed convergence toward the optimal solution. Then, it proved that a PV system comprising 56 PV modules, 7 batteries and 2 inverters based on maximizing the NPV can sustainably augment its profitability, while a PV system comprising 66 PV modules, 10 batteries and 2 inverters can guarantee its reliability and feasibility, based on minimizing the LPSP.
Introduction
A renewable energy use has become an important reason to decrease the excessive demand of fossil fuels (oil, gas …), since these sources cause damage to the environment( emissions). In fact, one of the important sources of the renewable energy is the sun because of its free availability and cleanliness. That is why solar energy and especially photovoltaic (PV) energy is quickly becoming a necessity and an essential part of energy balance and
emissions reduction (Moghimi et al. Citation2018). Added to that, grid-connected PV modules have recently experienced a rapid growth worldwide and have become more popular especially in developed countries (Hanen Citation2018).
Motivation and incitement
These systems were essentially installed to generate electricity and to compensate the energy withdrawn from the grid, for the same purpose, to reduce electricity bills. Thence, this type of PV system is used in this study. Nevertheless, a high PV penetration level on the electricity grid can affect its quality and safety and cause voltage rise, frequency perturbation and power losses increase (Khenissi et al. Citation2020).
However, the generation and the interaction between the PV-battery system and the electricity grid should be managed to ensure load supply at any time and any weather conditions, since the power produced by PV systems is highly dependent on the temperature T and the irradiation G (Khenissi, Fakhfakh, and Neji Citation2018). The reasons are truly understandable, with the liberation of power systems; the residential grid-connected PV systems can supply power to the grid during peak hours or charge the battery during non-peak hours for later domestic use or for selling back to the grid during peak hours (Regis, Muriithi, and Ngoo Citation2019). That is why it is essential to use a technique or a method to manage the energy transfer between every system components (PV modules, battery, inverter, grid, load).
Furthermore, it is essential and important to determine the exact size of every system component. In terms of optimal sizing of PV modules, batteries and inverter numbers to ensure load supply at any time of the day. Actually, all these challenges are taken into account in this article.
Literature review
In fact, several researchers in literature have investigated and developed different methods and approaches to reach an optimal sizing of off-grid or on-grid PV system, with or without battery storage unit, either using single-objective or multi-objective functions.
The first group of papers discusses the sizing of standalone PV system. In fact, authors in Maleki, Nazari, and Pourfayaz (Citation2020) have developed an economic assessment for an optimization approach to tackle the optimum size of an off-grid PV/battery system using an Improved Harmony Search (IHS) algorithm to minimize the TLCC in order to provide the electricity demand. Added to that, authors in Zhang et al. (Citation2020) have proposed a socio-economic approach to size an independent solar system with hydrogen storage device and to properly determine its appropriate capacity and location in rural areas.
Besides, an artificial intelligence (AI) has been shown to be effective in PV system sizing in Khatib and Muhsen (Citation2020), and this paper presented an AI-based standalone PV system sizing method. Differential evolution multi-objective optimization is used to find the optimal balance between system’s reliability and cost. Two objective functions are minimized, the loss of load probability and the life cycle cost.
In Jiménez-Castillo et al. (Citation2020), the authors have developed a method to size an off-grid PV generator without a storage device in order to maximize the economic profitability of this system based on estimating the net present value (NPV) for different PV generation power taking into account the economic parameters such as self-consumption electricity and electricity sell to the grid. However, authors in Charfi, Ahmad, and Maher (Citation2019) have used the PSO algorithm to obtain the optimal sizing of isolated PV systems.
Another research direction is to size the storage battery to either have minimum operational cost or scheduling its charge and discharge to always ensure load demand, as presented in Weniger, Tjarko, and Volker (Citation2014), Hanen (Citation2018) and Kharseh and Holger (Citation2019), or to optimize the battery storage capacity using a multi-objective function based on maximizing the (NPV) and the self sufficiency ratio, as have been described in Zhang et al. (Citation2017).
In Regis, Muriithi, and Ngoo (Citation2019), the authors have proposed an optimization approach uses, which the (PSO) algorithm in order to find the optimal sizing of a battery storage unit integrated in a PV system with the lowest system operation cost.
In addition, other researchers’ efforts have been concentrated on sizing a PV system connected to the grid using different economic parameters and algorithms. In Charfi, Ahmad, and Maher (Citation2019) and in Ndwali, Njiri, and Wanjiru (Citation2020), a new approach of sizing optimization has been proposed in this study to size a grid-connected PV system without battery storage based on using a mixed integer linear programming to solve a multi-objective function to not only minimize the total life cost (TLCC) and the energy purchased from the grid, but also to maximize the reliability of the system by minimizing the power supply probability (LPSP). A swarm intelligence approach is used in Ciabattoni et al. (Citation2016) to find the optimal sizing of grid-connected PV micro-grid (MG) components. This approach is based on maximizing the NPV to ameliorate the profitability of the system using the artificial Bee Colonies (ABC) algorithm.
Added to that, in Ashtiani et al. (Citation2020), authors have used a teaching-learning based optimization (TLBO) algorithm for a techno-economic analysis of PV systems connected to the grid based on the total net present cost (TNP) minimization in order to reach the optimal sizing of this system. Then, authors in Samy, Mosaad, and Barakat (Citation2020) have presented an optimization methodology to find the optimal rating and number of hybrid renewable system components. The system proposed in this study is a grid-connected hybrid system feeding a typical load of a tourist resort in Egypt. In fact, these sizes are found based on minimizing the cost of electricity (COE) after using two techniques, which are the Hybrid Firefly/Harmony Search optimization technique (HFA/HS) and the particle swarm optimization (PSO) algorithm.
Besides, Gabr, Helal, and Abbasy (Citation2020) has applied a techno-economic feasibility of a rooftop PV system connected to the grid of three residential household types, with different levels of electricity demand (low, medium, and high). In fact, the economic sizing of the PV system is found based on different economic parameters such as the NPV, cost of energy (COE), payback period and finally electricity bills saving. To do this, Hybrid Optimization of Multiple Energy Resources (HOMER) software has been used. However, authors in Cui et al. (Citation2019) have developed a techno-economic evaluation methodology for a grid-connected PV system, taking into account the use of economic parameters such as the NPV, the maintenance cost, the system life cycle cost, using the Risk Management Software, without considering the sizing optimization criteria. A metaheuristic optimizer known as Crow Search Algorithm (CSA) based on the intelligence performance of crows has been used in Gharibi and Askarzadeh (Citation2019), in order to solve multi-objective optimization function that aims to size a hybrid energy system integrated to the grid. The levelized cost of energy (LCOE) and LPSP are used in this approach to solve the sizing problem.
Added to that, authors in Elbaz and Guneser (Citation2021) proposed a multi-objective bat algorithm (MOBA) to size a hybrid grid-connected PV system considering both economic and environmental concerns. The aim of this research is to reduce the LPSP, the COE and the greenhouse gas (GHGs) emissions. Kefale, Getie, and Eshetie (Citation2021) presented a method to determine the optimal design of a grid-connected PV system based on minimizing power losses and ameliorating the voltage profile. A multi-objective function has been formulated to be optimized by the selective particle swarm optimization (SPSO). Besides, in Zidane et al. (Citation2021), an optimal PV inverter sizing has been proposed using a multi-objective function with the aim of reducing the LCOE, and the optimization has been performed by a multi-verse algorithm. Additionally, in Attia et al. (Citation2021), the authors formulated a multi-objective optimization (MOO) based on minimizing the project lifespan cost, maximizing system reliability and reducing emissions, in order to size a grid-connected PV system. A MILP model has been used to solve this optimization problem.
Advantages and cavities of previous studies
As can be seen, and referred to the aforementioned literature, the majority of papers have focused on sizing optimization of off-grid solar – hybrid renewable system, or of grid-connected PV system without battery storage unit, or sizing only the battery storage capacity of an on-grid solar system. However, a few papers have given the attention to sizing all the grid-connected PV system components.
Added to that, according to the above literature and despite the existing researchers works that aim to determine the optimal sizing of solar system integrated to the grid, based on an economic analysis in order to ameliorate the profitability of the system with the use of different economic parameters such as NPC, LPSP, LCC, TLCC, LCOE, COE and environmental parameters such as reduction of emission. Limited attention, on the NPV economic parameter in the sizing optimization, has been given, and a few efforts have evenly been devoted to this parameter only by developing a techno-economic analysis without taking into consideration sizing optimization issue.
In other words, determining the optimal sizing of a grid-connected PV system with attention given to the NPV parameter was not covered in depth. Remarkably, not enough detail has yet been described and given to the effect of using this parameter on the sizing optimization resolution. Besides, most of the methods mentioned above provide a sizing optimization resolution focused only on ameliorating system profitability with no attention to the feasibility of it by not taking into consideration the power flow management optimization of the system under study.
Contribution
The main objective of this paper is to propose an optimization approach not only to find properly the optimal number and components of a grid-connected PV system but also to determine the optimal power flow management, in order to improve and ameliorate system profitability, reliability and feasibility under a period of study (20 years). In fact, the sizing decisions are PV panels, batteries and inverters number, the energy purchased from the electrical network, the energy injected to the grid and the electricity tariffs, during 24 hours. Maximizing the NPV and minimizing the LPSP are the key objectives of this research paper.
It is worth noting the contribution and novelty of this method, compared with the other methods described in the above literature, on sizing optimization resolution by summarizing it as below:
First of all, a new optimization structure for obtaining the optimal number and components of the establishment of a grid-connected PV system schemes with storage units is proposed. This method differs with previous studies in taking into consideration three criteria: the profitability, reliability and feasibility of the whole system.
Then, a multi-objective optimization function is carried out to analyze both the profitability and the reliability of the system. This function differs with the previous studies in using economic and non-economic parameters, which are NPV and LPSP by maximizing the NPV, which was not covered in depth in most previous studies in the sizing optimization issue and minimizing the LPSP using two optimization algorithms, which are PSO and GA algorithms.
Finally, a power flow management optimization is developed and applied to ameliorate the feasibility and the reliability of system with the aim of satisfying loads demand at any time of the day. As has been mentioned above, PV system sizing based on enhancing system feasibility was not covered in depth and will not be taken into account in most previous studies in the sizing optimization issue.
Paper organization
The reminder of this paper is organized as follows; Section II presents the system under study used in this paper and gives the mathematical model of each system. Section III highlights the main optimization problem and explains the economic study used in this analysis period. Section IV presents the optimization algorithms chosen in this paper, which are PSO and GA, and presents the proposed method on which this work is based. Simulation results are given in Section V. Finally, conclusion and some perspectives are presented in the sixth and final section.
Mathematical modeling of the different elements of the system under study
The whole system proposed in this paper consists of PV modules used to generate electricity from the sun and feed a typical house in Tunisia with average energy consumption around11.6 kWh/ day (Charfi, Ahmad, and Maher Citation2019). Its simplified block is given in :
Figure 1. Simplified block of grid-connected PV system.
Added to that were an inverter to integrate PV panels to the grid and an energy storage element used to store the power or to feed the load when needed. The system under study is given below
Mathematical model of PV system
PV module consists of several solar cells that produce electricity from sunlight. As a result, the power produced by these panels highly depends on weather conditions, which are the temperature and the irradiation.
In fact, the current produced by these modules can be written as follows (Kumar et al. Citation2015):
Mathematical model of battery storage element
The storage element used in this work is the lead acid battery, and this type of battery is easy to install and has low maintenance cost compared to Li-ion (Khenissi et.al. Citation2020). It is important to cite that the batteries begin to charge when the total power produced by the PV panels exceeds the load. However, batteries began to discharge when the load demand is higher than the available energy produced by the PV array. Added to that, its equivalent circuit is given in (Khenissi et.al. Citation2020):
Figure 2. Equivalent circuit of the CIEMAT battery.
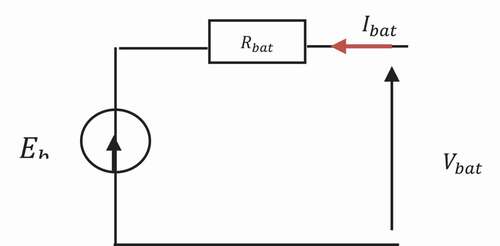
Then, the voltage across the battery can be given by the following equation (Khenissi et.al. Citation2020):
Where is considered as the number of batteries.
As a matter of fact, the important parameter that describes the level of charge of the battery is the state of charge (SOC). It can be written using the equation below (Khenissi et.al. Citation2020):
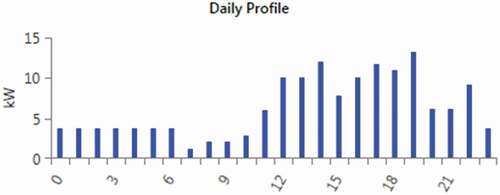
Load characteristics
In this paper, a typical household in Tunisia is used as a load. Daily and load electricity consumption are respectively given in .
Figure 3. Daily load consumption profile.
Economic study and problem formulation
Objective function
As has been mentioned before, the main goal of this research paper is to give a new approach to size a grid-connected PV system with storage elements based on an economic and non-economic analysis during a period of 20 years, in order to ameliorate the profitability, the reliability and the feasibility of the system under study.
In fact, the objective of this work is to maximize the important investment parameter, which is the NPV to improve the profitability of the system and to minimize the system LPSP to reduce load power losses and to always guarantee loads supply.
To do so, two objective functions are used to be optimized and the formulation of these functions are given as follows:
The NPV parameter of a project is used to evaluate the investment status of the whole system for a period of time. It is explained as the difference between the present worth of the cash inflows and the present worth of cash outflows of an analysis period of investment (Pham et al. Citation2008). When this parameter is positive, that means that the system is profitable and amortized. However, if it is negative, that shows the opposite. In fact, the following equation is calculated to determine the NPV, where is the initial investment, d is the discount rate, N is the project period and finally C is the total cash flow after tax in the period of study in Ndwali, Njiri, and Wanjiru (Citation2020):
In fact, is calculated by summing the cost of the energy purchased from the grid, which is given as
,
is the maintenance cost of every system component and finally the replacement cost
is the cost of the element that needs to be replaced. It is given as follows:
Added to that, represents the total annual income and what the system brings to the user. It is calculated by summing the cost of the energy selling to the grid and the energy savings achieved. It is given in Equationequation (11)
(11)
(11) (Riffonneau et al. Citation2011):
Where:
Where
*,
and
are, respectively, the power injected to the grid, load power demand and the power taken from the grid.
* and
are, respectively, the price of 1 kW selling to the grid and that taken from it.
* or
is equal to 1 when the component (battery or inverter) will be replaced in the year k; however, it is equal to 0 when this element will not be replaced.
Otherwise, as has been mentioned before, the LPSP parameter is used not only to know if the load is always supplied at each hour h from the renewable source or not, in other words, to ensure the load power demand satisfaction, but also to evaluate the system reliability.
LPSP can be characterized and defined as the load that the system is incapable to satisfy divided by the total load in the period of study. And it can be written as follows (Bakelli, Arab, and Azoui Citation2011):
Actually, if LPSP = 0 that means that the load is totally satisfied; however, if LPSP = 1 that means that load is not satisfied (Mehdi, Zazi, and El Ballouti Citation2006).
Optimization constraints
The constraints given below should be satisfied in the economic sizing optimization process of the system under study
– PV modules constraint
-Battery number constraint:
– Inverter constraint
– SOC constraint
-LPSP constraint:
-Load flow constraint (Armaghani et al. Citation2014)
Optimization algorithms and the proposed method
Reaching an optimal system investment with an optimum PV systems sizing and efficient batteries energy management is a difficult combinatorial-optimization issue. Therefore, as has been mentioned before, there are several techniques that are presented in literature to solve this complex optimization issue. Such as classical and analytical techniques that are based on the load flow and also, meta-heuristic algorithms (PSO, GA, fuzzy logic …). In fact, classical methods are used to solve simple problems, and it is efficient when the shape of the objective function is known in advance. However, meta-heuristic algorithms are considered to solve complex problems and cover all other method limits. Therefore, the PSO and GA algorithms are used in this research work, since they are considered as the most powerful methods that deal with continuous and discrete optimization problems (Prakash and Sujatha Citation2016).
PSO algorithm
In fact, it was developed in 1995 by Dr. Eberhart and Dr. Kennedy (Hooshmand Citation2008) and is defined as an iterative method where its principal consists of initializing a number of particles that take a random position in a space of possible solution. As an explanation, every particle has a memory and after the interaction with each other, they move to the best position (g_best), and this is by changing their velocity and position.
The expression of the velocity as well as the position
of the particle ‘i’ at the iteration ‘t’ are given using EquationEqs (22)
(22)
(22) and (Equation23
(23)
(23) ) as shown below:
Where is the “personal best particle” and
is the “global best position,” w is the inertia weight factor, which should be less than 1. However,
and
are acceleration constants, and the sum of these constants should be greater than 4 (Prakash and Sujatha Citation2016).
GA algorithm
This algorithm is presented as one of the techniques used to optimize the best position and size of the PV system in the distribution network. It is considered as an adaptive method, which can be used to solve search and optimization problems such as for online process control, such as in a chemical plant, or load balancing on a multi-processor computer system (Kashyap, Mittal, and Kansal Citation2019). It is a robust technique, which can deal easily with huge problems number (Kashyap, Mittal, and Kansal Citation2019). .
In fact, its principle is based on the genetic system of a biological organism and can be presented as artificial intelligence (AI) method (Kashyap, Mittal, and Kansal Citation2019). . It consists of collecting a group of individual called chromosomes to constitute a population. These individuals are composed of a discrete unit called genes, and this population is randomly initialized. The main goal of this technique is to converge to the global solution, and this is by using three steps and operators, which are crossover, mutation and reproduction operator.
Proposed method
As has been mentioned before, the main goal of this paper is to give a new approach to size the whole system by evaluating the system profitability, reliability and feasibility after maximizing the NPV and reducing the LPSP as minimum as possible and finding the optimal power flow management.
As better understanding, an optimal sizing of all the system components should be investigated (PV modules, batteries and inverter) and an efficient batteries energy management should be done in one hand, to reduce the load power losses and always ensure their need, and in the other hand, to calculate the power purchased to the grid and that taken from it to reach the best NPV parameter. To achieve this target, a proposed flow chart is used, and it is explained in the . To calculate the NPV and LPSP parameters, the value of the power taken from the grid as well as that injected to it should be determined in the instant ‘k.’ In fact, these values depend not only on PV modules, batteries and inverter numbers, but also on the power flow between all the PV system components. That is why this power flow should be properly managed.
Figure 4. Flow chart of the proposed optimization technique (PSO or GA).
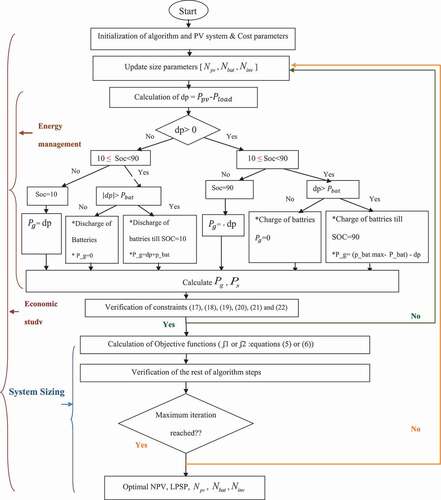
To get a better understanding, if the power generated by the PV systems is higher than load demand, and batteries are full of charge (SOC = 90), the excess of power will be injected directly to the electrical network. However, if batteries are not fully charged (10 ≤ SOC ≤ 90), they will continue to charge till their maximum.
And, if there is an excess of power after charging all the batteries, the amount of power will be injected to the grid.
Nevertheless, if the power demand is higher than the power produced from PV modules, and batteries are empty (SOC = 10), loads will take their need for power directly from the grid. However, if batteries are not empty (10 ≤ SOC ≤ 90), and the power demand is less than that stored in storage components, these elements will feed directly the consumer, if not, loads will take the power from batteries and the grid. Consequently, after this power flow management P_g, and P_s, and will be determined, and then NPV and LPSP values also.
Simulation results
The main goal of this article is to offer an approach to find the optimal size of a PV-batteries-inverters system in terms of PV panels, batteries and inverters number, the energy purchased from the electrical network, the energy injected to the grid and the electricity tariffs, during 24 hours. To reach this target, two objective functions are used. The first one is applied in order to find the optimal PV system size that gives an optimal economic status during 20 years. In this step, the second function
is considered as an equality constraint. However the second function
is used to find the optimal number of system components in order to satisfy load demand requirements at any time. In this step, the second function
is considered as an equality constraint.
Simulation results are given after using Matlab Software, and system parameters are given in the next step.
System parameters
The different elements used in this work are presented in the (Brahmi, Charfi, and Chaabene Citation2017), (Totalenergies Citation2021).
Table 1. System parameters
Table 2. System cost parameters
Optimization techniques and optimal sizing results
Please insert System profitability analysis
The main objective of this part of work is to discuss and analyze system profitability for a 20-year study period. To reach this target, finding the optimal system size using two optimization algorithms (PSO algorithm and GA) will be held in this section. In fact, the constraints used in this part are selected and taken from Charfi, Ahmad, and Maher (Citation2019):
Simulation results are given in the following curves after choosing 100 as iteration number:
presents the result of using the first objective function f1 (case (a)) that aims to maximize the system NPV in a period of 20 years. This objective function is used to find the best system size that gives the optimal economic status in order to ameliorate the profitability of the system. In fact, the two curves shown in this figure present the optimal NPV using two optimization algorithms, which are PSO algorithm (blue curve) and GA algorithm (green curve).
Figure 5. Convergence characteristic of the objective function ‘f1ʹ case (a) and ‘f2ʹ case (b).
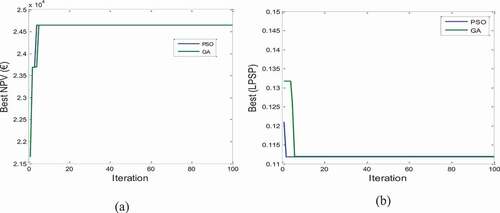
Simulation results in this figure prove that the first algorithm converges to the optimal NPV in the ‘fourth’ iteration; however, the second algorithm converges to it in the ‘sixth’ iteration, and the best NPV given by these two algorithms is 24644.354€, while the best sizing of the PV-batteries system according to this value is 56 PV modules, 7 batteries and 2 inverters.
The aim of using ‘f2ʹ optimization function (case (b)) is to reach the optimal number of system components that ameliorate the system reliability and satisfy loads demands at any time of the day by minimizing loads power losses. According to (b), it is clear that the PSO algorithm converges to the optimal LPSP in ‘iteration 2’; however, GA algorithm converges to the same LPSP in ‘iteration 6ʹ. Added to that, the best LPSP of this study is 0.1119, while the best sizing of the PV-batteries system accordingly to this value is 66 PV modules, 10 batteries and 2 inverters.
As a conclusion, PSO algorithm is faster than GA and show better performance than it in terms of speed convergence toward the optimal solution. Added to that, it is clear also that by maximizing the system profitability, its reliability decreases and by maximizing the system reliability (min LPSP) and decreasing loads power losses, system profitability decreases. The next figure explains better this point.
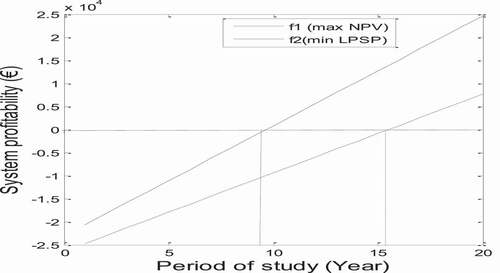
The next figure illustrates the system profitability during the 20-year study period after using the optimal size found above with the two optimization algorithms and objective functions.
explains the system reliability during the period of study. The blue curve presents the evolution of NPV using the first objective function f1, which aims to maximize the NPV; however, the green curve presents the evolution of this parameter using the second optimization function f2 that aims to minimize the LPSP. In fact, as has been mentioned above in the previous section, a positive NPV means that the system is profitable and amortized. However, if it is negative, that shows the opposite. Added to that, when the amortization period is shorter, the system will be economically more attractive. According to these two curves, it is clear that the period of amortization using the second objective function is longer than that using the first objective function. It is about 9 years with f1 and 16 years with f2. That means that the system is well profitable, efficient and amortizable by maximizing the NPV.
Figure 6. NPV evolution during the analysis period.
All these results can be summarized in this table.
Please insert .
Table 3. Optimization parameters
Table 4. Results summary
System feasibility analysis
Analyzing system feasibility and reliability consists on determining the power flow between system components (PV panels, loads, batteries and the grid) and trying to properly and correctly manage it, in order to determine the power extracted from the electrical network and that injected to the grid and make a difference between them. The main goal of this part is to find the optimal system size that ameliorate and enhance its feasibility and reliability by reducing grid intervention (the power purchased from the grid using the two function mentioned above).
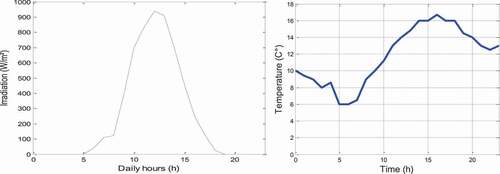
To reach this target, the irradiation G and the temperature T during a day should be determined.
In fact, the irradiation profile used in this paper, to help the PV system to generate electricity (a), as well as the temperature (b), are taken over a 24-hour period for the Tunisian country for the month of March (Infoclima Citation2020). It is given in .
Figure 7. Irradiation (a) and temperature (b) profiles.
Actually, the optimal power flow management of the whole system using the two objective functions f1 and f2 after determining the best system size is presented in , in order to explain batteries behavior and their interaction with the whole system during the day.
Figure 8. Energy management using ‘f1ʹ (a) and‘f2ʹ (b) optimizations.
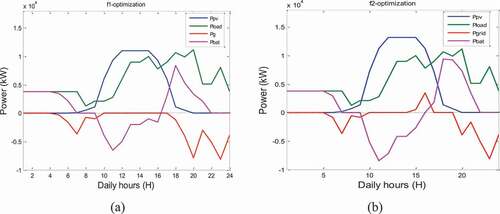
presents the active power of PV panels, batteries, loads need and finally the power extracted from the grid and injected to it during the day. According to these two figures, it is clear that the power produced by PV panels in case (b)r is higher than that in case (a) because of the higher number of PV modules found with ‘f2ʹ (66 modules).
Then, when there is no power produced by PV modules (Ppv = 0), there is a power consumed by the load (from 1 a.m to 7 a.m) and from (8 p.m to 11 pm). In these cases, batteries will compensate this need and will feed loads, in the night when there is no sun and in the morning when the irradiation is low. Besides, according to these two figures, (from 7.00 am to 9 am and from 10 pm to midnight), batteries are completely discharged, and the power produced by PV panels is still less than loads demand (P pv < Pload). In this case, the system will extract the power from the grid to satisfy loads need. However, this extraction has a lower value (see (b)) compared to that in (a). This is explained by the use of 10 batteries with ‘f2ʹ optimization compared to 7 batteries with ‘f1ʹ optimization. Added to that, from 9 am to 4.30 pm, PV panels begin to produce electricity, and the power produced by these modules is higher than the power consumed by loads (P_ pv > P_ load). In this case, PV panels will feed loads and the excess of power is stored in batteries and PB < 0. As results during this period of time, loads demand is successfully satisfied without interaction with the grid. In other words, there is no power extracted from the grid; however, there is power injected to the grid in (b) because of the highest number of PV panels used in this case (66 modules). As a conclusion, when the number of modules and batteries increase, the power extracted from the grid decreases and the system can inject power to the grid when there is an excess of power production. So the optimal size found using ‘f’ that minimizes LPSP leads to loads demand satisfaction and grid interaction minimization compared to the optimal size after using ‘f1ʹ optimization function. Hence, minimizing LPSP ameliorate system feasibility.
The next figures present the difference between the power extracted from the grid, as well as the electricity tariff before and after using the optimization function (f1 and f2) proposed in this paper, during 24 h hours.
According to (a) in , it is clear that after optimization technique, the power extracted from the grid decreases compared to that without using the proposed method. Added to that, this power decreases more with ‘f2ʹ optimization than with ‘f1ʹ optimization. We notice also that, in some period of time, it is equal to zero, which means that there is no power taken from the grid and there is no interaction between the PV system and the electrical network.
Figure 9. Power extracted from the grid (a) and electricity tariffs (b) before and after optimization.
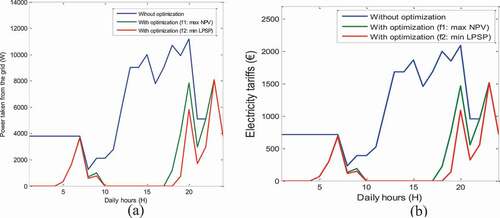
Besides, according to (b) in , the cost of the electricity during the day before using the optimization method is higher than that after using it, and in some period of the day, there is no need to pay the electricity tariff because there is no power taken from the grid. However, it is clear that with ‘f2ʹ optimization that aims to minimize LPSP electricity tariffs is less than that after using ‘f1ʹ optimization. That proves that minimizing LPSP can lead to a decrease in electricity during the day.
Conclusion
This paper proposed a new approach to determine the optimal size of a grid-connected PV system with storage element. To reach this target, two objective functions have been used and was based on maximizing the NPV in order to ameliorate system’s profitability and on minimizing the LPSP in order to satisfy all loads requirements. Besides, two optimization algorithms have been used, which are the PSO algorithm and the GA technique. In fact, the flow chart of the proposed method has been presented in this work to evaluate the two objective functions. In fact, according to the simulation results, it can be concluded that using the first objective function ’f1ʹ by maximizing the NPV, the optimal system size is 56 PV panels, 7 batteries and 2 inverters, and the system will have many advantages such as less components, system reliability and profitability amelioration, less system installation cost and short amortization period (system begins to be profitable after 9 years); however, it has 0.28 as LSPS, which is acceptable and high electricity tariffs payment during the day. While using the second objective function ‘f2ʹ by minimizing the LPSP, the optimal system size is 66 PV modules, 10 batteries and 2 inverters, which proved that the system has more components compared to the first optimization, high system installation cost, long amortization period (system begins to be profitable after 16 years), which shows that the system is not profitable, despite having less LPSP compared to ‘f1ʹ optimization.
As a conclusion, simulation results have proved that the PSO algorithm is faster than the GA and presents better performance in terms of speed convergence toward the optimal solution. Added to that, it have determined the optimal system size, which is 56 PV modules, 7 batteries and 2 inverters that gives the best economic, profitable and reliable system based on maximizing the NPV compared to the size found after using the second objective function that aims to minimize the LPSP.
Disclosure statement
No potential conflict of interest was reported by the author(s).
Correction Statement
This article has been republished with minor changes. These changes do not impact the academic content of the article.
References
- Armaghani, D. J., M. Hajihassani, E. T. Mohamad, A. Marto, and S. A. Noorani. 2014. Blasting- induced flyrock and ground vibration prediction through an expert artificial neural network based on particle swarm optimization. Arabian Journal of Geosciences 7 (12):5383–96. doi:https://doi.org/10.1007/s12517-013-1174-0.
- Ashtiani, M. N., A. Toopshekan, H. Yousefi, and A. Maleki. 2020. Techno-economic analysis of a grid-connected PV/battery system using the teaching-learning-based optimization algorithm. Solar Energy 203:69–82. doi:https://doi.org/10.1016/j.solener.2020.04.007.
- Attia, A. M., A. Al Hanbali, H. H. Saleh, O. G. Alsawafy, A. M. Ghaithan, and A. Mohammed. 2021. A multi-objective optimization model for sizing decisions of a grid-connected photovoltaic system. Energy 229:120730. doi:https://doi.org/10.1016/j.energy.2021.120730.
- Bakelli, Y., A. H. Arab, and B. Azoui. 2011. Optimal sizing of photovoltaic pumping system with water tank storage using LPSP concept. Solar Energy 85 (2):288–94. doi:https://doi.org/10.1016/j.solener.2010.11.023.
- Brahmi, N., S. Charfi, and M. Chaabene. 2017. Optimum Sizing Algorithm for an off grid plant considering renewable potentials and load profile. International Journal of Renewable Energy Development 6 (3):213. doi:https://doi.org/10.14710/ijred.6.3.213-224.
- Charfi, S., A. Ahmad, and C. Maher. 2019. Optimal sizing of a hybrid solar energy system using particle swarm optimization algorithm based on cost and pollution criteria. Environmental Progress & Sustainable Energy 38 (3):e13055. doi:https://doi.org/10.1002/ep.13055.
- Ciabattoni, L., F. Ferracuti, G. Ippoliti, and S. Longhi Artificial bee colonies based optimal sizing of microgrid components: A profit maximization approach. In 2016 IEEE Congress on Evolutionary Computation (CEC) 2016 Jul 24 (pp. 2036–42), Vancouver, BC, Canada. doi:https://doi.org/10.1109/cec.2016.7744038
- Cui, Y., J. Zhu, F. Meng, S. Zoras, J. McKechnie, and J. Chu. 2020. Energy assessment and economic sensitivity analysis of a grid-connected photovoltaic system. Renewable Energy 150:101–15. doi:https://doi.org/10.1016/j.renene.2019.12.127.
- Elbaz, A., and M. T. Guneser. 2021. Multi-objective optimization method for proper configuration of grid-connected PV-wind hybrid system in terms of ecological effects, outlay, and reliability. Journal of Electrical Engineering & Technology 16 (2):771–82. doi:https://doi.org/10.1007/s42835-020-00635-y.
- Gabr, A. Z., A. A. Helal, and N. H. Abbasy. 2020 February. Economic evaluation of rooftop grid‐connected photovoltaic systems for residential building in Egypt. International Transactions on Electrical Energy Systems 30(6):e12379. doi:https://doi.org/10.1002/2050-7038.12379/v3/response1.
- Gharibi, M., and A. Askarzadeh. 2019 Oct 1. Technical and economical bi-objective design of a grid-connected photovoltaic/diesel generator/fuel cell energy system. Sustainable Cities and Society 50:101575. doi: https://doi.org/10.1016/j.scs.2019.101575.
- Hanen, D., KHediri J, Gori M, Gregori L, & Francesco B. Feasibility Study of Grid Connected Photovoltaic Power Plant In the Southern of Tunisia. International Conference on Green Energy & Environmental Engineering-Proceedings of Engineering and Technology (PET), vol. 37, 2018. 99–109. Sousse, Tunisia: Google scholar.
- Hooshmand, R. A. 2008. Optimal design of load shedding and generation reallocation in power systems using fuzzy particle swarm optimization algorithm. Journal of Applied Sciences 8 (16):2788–800. https://doi.org/10.3923/jas.2008.2788.2800.
- Infoclima. 2020. Retrieved from: https://www.infoclimat.fr/observationsmeteo/archives/26/mars/2020/remada/60775.html?graphiques
- Jiménez-Castillo, G., F. J. Muñoz-Rodriguez, C. Rus-Casas, and D. L. Talavera. 2020. A new approach based on economic profitability to sizing the photovoltaic generator in self-consumption systems without storage. Renewable Energy 148 (April):1017–33. doi:https://doi.org/10.1016/j.renene.2019.10.086.
- Kashyap, M., A. Mittal, and S. Kansal (2019). Optimal placement of distributed generation using genetic algorithm approach. In Proceeding of the Second International Conference on Microelectronics, Computing & Communication Systems (MCCS 2017) (pp. 587–97). Springer, Singapore. doi:https://doi.org/10.1007/978-981-10-8234-4_47
- Kefale, H. A., E. M. Getie, and K. G. Eshetie. 2021. Optimal design of grid-connected solar photovoltaic system using selective particle swarm optimization. International Journal of Photoenergy 2021:1–9. doi:https://doi.org/10.1155/2021/6632859.
- Kharseh, M., and W. Holger. 2019. How adding a battery to a grid-connected photovoltaic system can increase its economic performance: A comparison of different scenarios. Energies 12 (1). doi: https://doi.org/10.3390/en12010030.
- Khatib, T., and D. H. Muhsen. 2020 Jan. Optimal sizing of standalone photovoltaic system using improved performance model and optimization algorithm. Sustainability 12(6):2233. doi:https://doi.org/10.3390/su12062233.
- Khenissi, I., M. A. Fakhfakh, and R. Neji Comparative study of three MPPT techniques for PV system, International Conference on Recent Advances in Electrical Systems, Tunisia, 2018. Google scholar.
- Khenissi, I., M. A. Fakhfakh, and R. Neji. 2020. Artificial neural network and space vector pulse width modulation control technique for a photovoltaic system with a power grid connection and lead acid battery storage. International Journal of Electrical Engineering and Applied Sciences (IJEEAS) 3 (1):43–52. Google scholar.
- Khenissi, I., R. Sellami, M. A. Fakhfakh, and R. Neji. Effects of high PV penetration level on voltage and frequency profile of a distribution network. 17th International Multi-Conference on Systems, Signals & Devices (SSD’20), July 2020. Sfax, Tunisia: Google scholar.
- Kumar, M., S. R. Kapoor, R. Nagar, and A. Verma. 2015 Jun. Comparison between IC and fuzzy logic MPPT algorithm based solar PV system using boost converter. International Journal of Advanced Research in Electrical, Electronics and Instrumentation Engineering 4(6):4927–39. doi:https://doi.org/10.15662/ijareeie.2015.0406007.
- Maleki, A., M. A. Nazari, and F. Pourfayaz. 2020 Dec 1. Harmony search optimization for optimum sizing of hybrid solar schemes based on battery storage unit. Energy Reports 6:102–11. doi: https://doi.org/10.1016/j.egyr.2020.03.014.
- Mehdi, E., A. E. F. Zazi, and M. El Ballouti 2006, Comparative study of lead acid battery modeling. https://doi.org/10.11591/eei.v7i2.675
- Moghimi, M., R. Garmabdari, S. Stegen, and J. Lu. Battery energy storage cost and capacity optimization for university research center. Industrial and Commercial Power Systems Technical Conference (I&CPS) IEEE, Niagara Falls, ON, Canada, May 2018, 1-. https://doi.org/10.1109/icps.2018.8369968
- Ndwali, K., J. G. Njiri, and E. M. Wanjiru. 2020 Apr 1. Multi-objective optimal sizing of grid connected photovoltaic batteryless system minimizing the total life cycle cost and the grid energy. Renewable Energy 148:1256–65. doi: https://doi.org/10.1016/j.renene.2019.10.065.
- Pham, T. T. H., C. Clastres, F. Wurtz, S. Bacha, and S. Ploix Mise en oeuvre de l’optimisation pour le dimensionnement et les études de faisabilité de systèmes multi-sources électriques dans le bâtiment. November,2008. Google scholar.
- Prakash, R., and B. C. Sujatha Optimal placement and sizing of DG for power loss minimization and VSI improvement using bat algorithm. In 2016 National Power Systems Conference (NPSC) (pp. 1–6). Bhubaneswar, India: IEEE.2016 December. doi:https://doi.org/10.1109/npsc.2016.7858964
- Regis, N., M. Muriithi, and L. Ngoo. 2019. Optimal battery sizing of a grid-connected residential photovoltaic system for cost minimization using PSO algorithm. Engineering, Technology & Applied Science Research 9 (6):4905–11. https://doi.org/10.48084/etasr.3094.
- Riffonneau, Y., S. Bacha, F. Barruel, and S. Ploix. 2011 Feb 17. Optimal power flow management for grid connected PV systems with batteries. IEEE Transactions on Sustainable Energy 2 (3):309–20. doi:https://doi.org/10.1109/tste.2011.2114901.
- Samy, M. M., M. I. Mosaad, and S. Barakat. 2020. Optimal economic study of hybrid PV-wind-fuel cell system integrated to unreliable electric utility using hybrid search optimization technique. International Journal of Hydrogen Energy 29 July 2020 Elsivier. doi: https://doi.org/10.1016/j.ijhydene.2020.07.258.
- Totalenergies. 2021. Retrieved from: https://www.totalenergies.fr/particuliers/parlons-energie/dossiers-energie/facture-d-energie/les-elements-a-prendre-en-compte-pour-calculer-les-kwh-en-euros
- Weniger, J., T. Tjarko, and Q. Volker. 2014. Sizing of residential PV battery systems. Energy Procedia 46:78–87. doi:https://doi.org/10.1016/j.egypro.2014.01.160.
- Zhang, G., Y. Shi, A. Maleki, and M. A. Rosen. 2020 Aug 1. Optimal location and size of a grid-independent solar/hydrogen system for rural areas using an efficient heuristic approach. Renewable Energy 156:1203–14. doi: https://doi.org/10.1016/j.renene.2020.04.010.
- Zhang, Y., A. Lundblad, P. E. Campana, F. Benavente, and J. Yan. 2017 Feb 1. Battery sizing and rule-based operation of grid-connected photovoltaic-battery system: A case study in Sweden. Energy Conversion and Management 133:249–63. doi: https://doi.org/10.1016/j.enconman.2016.11.060.
- Zidane, T. E. K., S. M. Zali, M. R. Adzman, M. F. N. Tajuddin, and A. Durusu (2021, May). PV array and inverter optimum sizing for grid-connected photovoltaic power plants using optimization design. In Journal of Physics: Conference Series (Vol. 1878, No. 1, p. 012015). Melaka, Malaysia: IOP Publishing.