
 ?Mathematical formulae have been encoded as MathML and are displayed in this HTML version using MathJax in order to improve their display. Uncheck the box to turn MathJax off. This feature requires Javascript. Click on a formula to zoom.
ABSTRACT
In this paper, we address the frequent problem associated with user association and resource allocation along with optimal deployment of base station (BS) in multiple radio access technology (Multi-RAT)-assisted heterogeneous network (Het-Net). Considering real time user scenarios, optimal resource allocation in Het-Net while ensuring each user’s minimum required data rate is a challenging task to be performed. Here, we propose a novel algorithm with a well-known and efficient meta-heuristic optimization technique to resolve the aforementioned problem. We use hybrid memory-based dragonfly algorithm with differential evolution (DADE) for its excellent convergence characteristics. Extensive simulations are performed to determine the optimal network utility under the consideration of nonuniform user distribution and fine-tuning their respective service class and contract of association parameters. Simulation results depict that the proposed algorithm improves the overall network utility in terms of radio resource utilization and energy consumption while satisfying the user demands. Comparative analysis of the proposed technique with the other state-of-the-art algorithm depicts the superiority of the proposed algorithm in terms of accuracy and consistency. We also perform optimal multi-RAT cell planning under the above constraints including a network blackout scenario. The algorithm ensures each user coverage by optimally allocating the available resources.
Introduction
The expeditious growth of traffic in telecommunication network is expected to be tenfold by the end of 2030 (Gupta and Jha Citation2015), (Mitra and Agrawal Citation2015). The demand of data in dense network has raised the request for next generation of wireless communication system, i.e 5th generation (5G) or beyond 5G. However, Heterogeneous Network (Het-Net) can be a promising solution to overcome this problem (Wang et al. Citation2017). A Het-Net comprises of a cluster of low power Base Station (BS) to cover and cater the users in the macro infrastructure. These low-power BSs includes pico, femto, and small BS. The static or dynamic deployment of different low power BSs in macro BS coverage creates a different kind of interference. Here, the main challenges are optimal resource allocation at BS and intra/inter network interference management (Ghimire and Rosenberg Citation2013). The multiple radio access technology (Multi-RAT) aided cellular network seeks attention due to advancement of network architecture and the intelligence required to build smart infrastructure for 5G wireless network. In Multi-RAT architecture, communication cells can be any of the RAT such as Global Standard for Mobile Communications (GSM), Wideband Code Division Multiple Access (WCDMA), Long-Term Evolution (LTE), and Wi-Fi. Due to exponential growth in mobile broadband services, the Het-Net is becoming dense and complex, thus efficient utilization of network resources through Software defined Het-Net ensures effective coordination between user and access terminal (Sun et al. Citation2015). These guarantees user satisfaction, quality of service (QoS), and demand data rate according to Fooladivanda, Daoud, and Rosenberg (Citation2011).
Future, communication network has to be intelligent enough to learn from the short falls, and issues of the network while establishing robust communication systems by adaptively organizing the key network parameters. Adaptation of intelligent strategy with learning component is envisioned to minimize the network congestion, and maximize the network utility (Ahmad et al. Citation2020). A network centric approach for heterogeneous wireless network is modeled to resolve the optimal user association problem for various RAT is demonstrated by Naghavi et al. (Citation2016). A Q-learning-based RAT selection algorithm is proposed to meet the Nash equilibrium of the network utility function in a noncooperative game theoretic approach. A reinforcement learning based RAT selection game ensures the convergence to Nash equilibrium with the optimal user association to different RAT, and provide guaranteed network throughput (Aryafar et al. Citation2013). User association to RAT is a problem which could not be solved by considering the user benefits only. Ignoring the network utility, a user association model for optimal resource allocation to accommodate maximum number of users has been proposed by Zakrzewska et al. (Citation2013). In Het-Net, user equipment (UE) are associated in a distributed manner with a BS under a RAT, and rips the benefit in terms of throughput maximization (Li and Han Citation2016). However, the user association strategies are made based on the overall network utility, thus a semi-Markov decision process (SMDP) is used to monitor the UE’s decision such that the operator’s interest can be satisfied while ensuring satisfactory network deriving capacity (Helou et al. Citation2015).
Most of the todays UE are enabled with Multi-RAT switching feature for smooth and universal mobile computing. Based on that assumption, a user centric model to select a proper RAT is suggested by Das and Das (Citation2017). Switching between multiple RATs enhance the call success rate while maintaining the call drop rate below a certain threshold. The exponential growth of data traffic in a network initiates the demand of better interoperability as well as network decision on RAT selection for higher performance efficiency. Thus to reduce the processing load and network signaling task, some part of the computing are performed at the user terminals. But user’s decisions are uncooperative and one sided; therefore, RAT has to be engaged in the decision making process resulting higher energy consumption. Thus to maximize the energy efficiency (EE) of Multi-RAT network, an optimal resource allocation scheme is proposed by (Lim et al. Citation2014), which executes parallel transmission using orthogonal frequency division multiple access (OFDMA). A fuzzy logic based multiple attribute decision-making model is proposed by Bouali, Moessner, and Fitch (Citation2016), where the authors discussed about the improvement in interworking feature of 5G systems as compared to the traditional signal strength based offloading. The fuzzy logic is used to track variations in the operating conditions of the different RAT, and the context (user preference, cell capacity and strategy of operator) aware policy is implemented through multiple attribute decision-making component. It is observed that the enhanced performance of the model confirms acceptable QoS to the UE.
On the other hand, node power management is a serious problem in the highly congested 5G and Internet-of-Things (IoT) based network. The same situation occurs in the communication network during and post disaster (DPD) situation, which deals with many challenges like required transmit power, cell coverage, cell capacity, and the QoS of associated UE. Thus adoption of Artificial Intelligence (AI) in managing the node power is a beneficial approach to handle the large volume of data that are arriving from different nodes (Sodhro et al. Citation2019). It is observed that a cross-layer based energy optimization algorithm (CEOA) is significantly improves the power management in the massive IoT device (Sodhro et al. Citation2019). However, to achieve high QoS with less transmit power, less delay, and minimum energy consumption, a novel QoS-based transmission power control (QoS-TPC) algorithm is proposed which ensures high network utility (Sodhro et al. Citation2018). Het-Net with highly dense BS consumes much energy even during nonbusy hours when the congestion of the network is considerably low. To mitigate this issue, an adaptive power control-based comprehensive system architecture is presented by Bayer et al. (Citation2011). In 2015, Yu et al. worked on the maximization of the EE of UE in Multi-RAT Het-Net under optimal resource allocation, and introduced the concept of Utopia EE to find the maximum EE of the users. Further, the authors used the weighted Tchebycheff method for finding its Pareto optimal solution (Yu et al., Citation2015). The EE maximization of the secondary user (IoT devices and sensors) in the Het-Net through optimal user association and power control in the uplink phase has been addressed by (Wang, Gao, and Lv Citation2017). Furthermore, the power management in small wearable devices, specifically in wireless body area networks (WBAN) is an emerging area with many research challenges. Especially, while transmitting the medical information, wireless body sensor nodes are required to be very energy efficient for its sustainability and reliability (Sodhro et al. Citation2020). To reduce the power control in WBAN devices, an energy-efficient adaptive power control algorithm is proposed in (Sodhro, Li, and Shah Citation2016) and demonstrates adequate trade-off between energy consumption and link reliability.
In Het-Net, the network throughput is maximized through a smart RAT access strategy while ensuring desired QoS. Based on the channel characteristics, reinforcement learning algorithm is used to perform RAT selection between cellular and Wi-Fi network through optimal resource allocation to UE (Yan, Feng, and Qin Citation2017). Result shows that the proposed model utilize radio resource more efficiently as compared to traditional Wi-Fi offloading schemes. To perform optimal RAT selection and Wi-Fi offloading, an optimized resource allocation along with network utility maximization strategy is deliberated by (Montoya and Gómez Citation2017). The authors have considered a Multi-RAT of cellular and Wi-Fi network, and performed optimal traffic offloading from cellular to Wi-Fi network to minimize the energy consumption of cellular network. Besides that, throughput and blocking probability based optimal RAT selection is discussed in (Dhia et al. Citation2017). Here, considering RAT of 3G/4G and Wi-Fi, optimal number of resource units (RUs) are assigned to the UE based on the requested service, availability, and service types.
However, in a Multi-RAT environment optimal cell planning considering user association, power control along with optimal resource allocation is a challenging problem. A novel network utility function considering EE under the constraint of user satisfaction as well as resource utilization is of utmost importance and required to be addressed. Optimal RAT selection in a Multi-RAT scenario consisting of LTE and WCDMA RAT through traffic offloading for EE maximization is an important research gap in the existing literature.
The increasing mobile traffic degrades the user data rate and the overall network utility. Thus, optimally distributing the mobile traffic via handover to the other RAT could be effective for overall network utility maximization. Hence, optimal RAT selection through traffic offloading in a Multi-RAT Het-Net composed by cellular LTE and WCDMA RAT while ensuring each user’s demanding data rate still needs to be investigated. Therefore, the optimal utilization of communication resources, i.e. power and bandwidth is considered to be an important task for modern communication systems. It is observed that the efficient utilization of available resources at the peak time can only be achieved with an effective communication model and schemes. Moreover, an improved user association principle for Multi-RAT selection strategy might be beneficial to maximize the network resource utilization. Therefore, the key motivation to perform this work is the optimal user association in Multi-RAT Het-Net satisfying the user demand while maximizing the energy efficiency (EE) and efficiently utilizing the limited radio resource.
The novel contribution of the proposed work are listed below:
We formulate a hybrid optimization problem that jointly maximize the number of UEs to be served and the sum of their utilities. Here, each UE is optimally distributed to the existing BS/RAT based on their preferences (requested QoS, data rate, and contract) for efficient utilization of the available radio resources.
Investigating various preferences of user association and resource allocation by tuning: i) The weights associated with different service classes and contracts, and ii) the weights associated with the considered two objectives. A user association model is formulated while making a traffic balance between LTE and WCDMA RAT, which ensures the user satisfaction as well as network utility maximization.
Performing the optimum cell planning in Multi-RAT scenario under the constraint of optimum user association to different BS/RAT upon maximizing the EE of the network. The relevant constraints are formulated based on user density, QoS, cell capacity, and area coverage. All the above-mentioned constraints ensure the optimal network utilization.
Finally, blackout area analysis is performed, which depicts the user association to the BS/RAT under the critical situation.
The rest of the paper is organized as follows. In Section 2, description of the network model is presented. Problem formulation for the proposed optimization approach and discussion on the simultaneous consideration of user association, resource allocation, and EE is performed in section 3. Extensive simulation results and the obtained insights are explained in section 4. Finally, the Conclusions of this work and its future perspectives are presented in Section 5.
Multi-RAT Network Model
Our network consists of multiple RATs having different standards. So, there is no correlation between the considered RATs. The formation of a common network by considering multiple RATs has been considered. We define two basic categories of the network which are the fourth generation (4G) LTE network and the third-generation (3G) WCDMA network. We analyze cell planning for the considered Multi-RAT network by observing the network utilization, user association, and resource allocation characteristics. depicts the framework for the proposed Multi-RAT user association strategy.
Figure 1. Framework of proposed Multi-RAT user association.
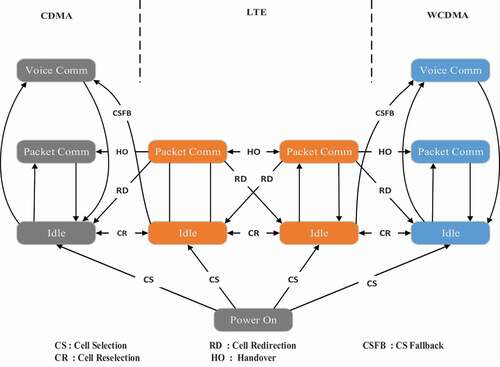
To start communication in idle RAT, a user first perform the cell selection (CS) and associate with one BS/RAT. While starting the communication one user and network keep tracking the user satisfaction level, if it degrades cell reselection (CR) is perform. On start of packet communication in idle RAT, switching to another RAT or BS is performed with the help of process called handoff/handover (Fooladivanda, Daoud, and Rosenberg Citation2011). This handoff is basically soft handoff and perform to balance the BS/RAT load as well as to fulfill user demanded QoS. On the other hand, cell redirection executes when a user already start communicating in the idle RAT and want to change cell due to unsatisfaction with the service quality. To start a direct voice communication (non IP based) then user have to choose CDMA/WCDMA RAT. If a user initially opted packet/data communication in LTE RAT and suddenly want to change to non IP based voice communication then based on the availability and status of the CDMA and WCDMA RAT users are allowed for voice communication through cell selection fallback (CSFB).
Allocation strategy of LTE RAT: Selecting LTE RAT and starts communicating in the packet mode one user can handover to the other RAT in the packet mode service only (Fooladivanda, Daoud, and Rosenberg Citation2011). While associated with the LTE RAT, if a user find LTE network is not suitable to fulfill the demand due to congestion, that user can handover to other RAT. If no slot is available in other RAT for packet service than the particular user have to start the communication by searching an idle RAT instead of continuing ongoing communication.
Allocation strategy of CDMA/WCDMA RAT: If a user find WCDMA RAT is idle for communication, UE perform CS for voice/packet transmission. However, a user associated with a WCDMA RAT is able switch to LTE RAT or start the communication freshly for fulfilling the demanded satisfaction.
For each UE, first the signal-to-interference-plus-noise-ratio (SINR) is measured from the nearby BS of RAT-1 (LTE)/RAT-2 (WCDMA) for association. If the estimated SINR with respect to BS/RAT-1 is greater than the threshold SINR for fulfillment of required QoS, the UE associated with the RAT-1 else associated with the most nearby BS/RAT. For every new UE association demand, first the fulfillment of data rate is checked, if BS/RAT is able to deliver the UE demanded data rate then the association is successful otherwise associated with the most nearby and idle BS/RAT as shown in the .
Figure 2. Association principle based on the BS/RAT load.
Application layer of the UE module generates the traffic, and the network layer is responsible for exchange of information among the multiple RATs. Here, the application layer plays a role in transferring the knowledge of user demand to the lower layers. Maintaining the user demand in the co-operative Multi-RAT network is accomplished through SINR and corresponding throughput measurement from the respective BS/RAT. RAT switching decision is made based on the evaluation of achieved SINR in the transport layer, followed by handover and end to end packet transmission in the network layer. The architecture of the proposed model is presented in .
Figure 3. Architecture of the Multi-RAT association model.
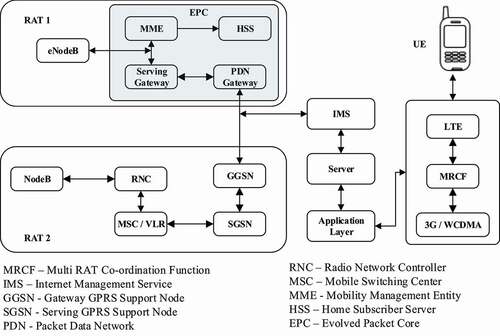
The key decision of association to the appropriate RAT is taken in the MRCF functional block. On completion of the decision based on the traffic analysis, UE packet data is routed to RAT-1 or RAT-2 through appropriate gateway as shown in . The association of UE to any RAT network actually occurred between UE and NodeB in the physical/Network Interface layer. But for understanding the actual decision making process at the application layer to handle the data management protocol at the transport layer, and routing at the network layer, we present the architecture showing the data flow from the upper layer to the lower layer of transmission control protocol.
Considering a heterogeneous Multi-RAT wireless network consists of BSs with
adjacent RATs and Nu UEs. The indexes
,
and
are used to represent uth UE, jth BS and kth RAT, respectively.
Cellular Network Resources
The radio resource allocated to any cellular network is generally divided into (RUs), which use to be associated with different RATs. Let RU denoted by is associated with kth RAT, i.e.
.
For 4G LTE networks, resource block is the smallest RU that can be scheduled.
3G high speed packet access (HSPA) networks, a RUconsists of codes. Here we assume, these codes require same power for the fixed length of codes.
Formulation of Problem
Let is the perceived throughput of uth UE (
using channel n and associated with
over
.
Where, is the signal to interference plus noise ratio (SINR) attained by the
. That can be represented by
Where indicates the transmission power of
, transmitting via channel n of
over RAT k.
denotes the channel gain between
and
. The percentage of used resources in the interfering
over
is denoted by
. The path loss between
and
over
is
. The allocated bandwidth and noise power
and
, respectively.
is the bandwidth of the channel of the RAT k and
be the thermal noise power density.
Here, the users are associated with the BS from which they receive the maximum power at that instant. The distance between the user u and BS j is calculated as:
The path loss occurrence corresponding to distance can be calculated for a BS as (Teixeira et al. Citation2017).
where = 100 meter;
; λ (=c/f) is the wavelength in meter.
S is the log normal distribution factor; typical values lies in the range of 8.2–10.6 dB, and f is the operating frequency.
Here we considered Land of flat terrain with light tree density. We assume, number of RUs assigned to
associated with
over
. Then the user achieved throughput (
) can be written as:
In this work, we utilize two classes of network traffic models namely Class-A and Class-B. Both the class has premium (P) and regular (R) contract for user association. Class-A services like E-Mail, SMS, MMS, Web browsing, etc. whereas Class-B services comprise of real-time services like video conferences, video/audio calls, live streaming, etc. Contract signifies the association of a user to the communication network on the basis of QoS and satisfaction level. Here, we assume two different classes Class-A and Class-B and each of the classes has two types of user contract, namely, premium (P) and regular (R) contract. Premium contract offers more user satisfaction in terms of data rate and QoS as compared to the regular contract. On the other hand, regular contracts offer less data rate and user satisfaction but higher reliability.
The formulated user utility is a function of throughput thus can be obtained as real-time as well as non–real-time communication. The UE utility in both the class can be obtained as follows:
Class-A Non-Real Time (NRT): This class includes non-real-time services which consider conventional data applications like e-mail services, web browsing, etc. These applications are bearable to delay variation and can adjust their rate according to resource availability. The elasticity of these services can be modeled by concave utility functions. Here, we consider that the UE with Class-A services have an exponential utility function which can be expressed as:
Where, indicates the user utility function of
associated with class s service and
is the comfort throughput demand of the user. The user satisfaction increases slowly as the throughput exceeds the comfort throughput demand (
) and it may exceed maximum by 63%.
Class-B Real Time (RT): This class includes real-time services like voice services, live video streaming, etc. These applications are considered as nonelastic and can be modeled by a sigmoid function as follows:
Where, denotes average throughput demand of Class-B service and b is a positive constant which determines the shape of the sigmoid.
In this work, we proposed an optimization approach for fulfil user satisfaction and maximizing network utility through resource allocation. User association and optimal BS deployment through cell planning in Multi-RAT cellular network is also considered. The main approach of optimization problem is to maximize the number of user to be served and their corresponding utility.
The design variables in our optimization problem are as follows:
User centric optimal deployment of BS for different RATs.
The user association with BS over a given RAT.
The number of RUs assigned to each user.
Considering as user association of
with
over
.
To maximize the global utility we need to consider the level of user rejection, which necessitates to penalize the objective function. The penalized objective function is composed of the utility as well as blocking rate as follows:
Subject to constraint
Where, denotes the set of UE associated with service class s and contract t,
The first term in EquationEquation (10)(10)
(10) is the weighted utility sum which represents the utility of UE. Weight
differentiates the different service class s and contract t of the user association. Its different configuration denotes the user preference and privilege. s belongs to A and B for class A and B services whereas t belongs to P and R for premium and regular contract, respectively. Among all considered services and class combinations,
is having maximum user satisfaction.
The second term of the utility function signifies the number of UE associations to the network, and the respective association factor is denoted by the . The weighting factor
and
(
and
∈ [0, 1]) indicates the relative significance of the two objectives namely sum utility of the UE and the total UE being served. If
>
then the UE utility is highly preferred to the number of UEs and vice versa.
The third term represents the blocking rate of UE for its higher sum utility. Increasing user association to the network degrades the network performance and the corresponding UE satisfaction. Thus, to maintain UE sum utility, and blocking of additional UE we incorporate the weight denoted by β3. The parameter β3 is a positive quantity and represents the penalty coefficient for user coverage. It also allow blockage preferences. Lower values of β3 provide a low penalty to the UE utility, whereas its highest values (β3 → ∞) decrease the blocking rate up to a lower threshold level.
Description of Constraints
We defined some constraints for our formulated maximization problem. Considering, and
as minimum and maximum required utility, respectively.
represent the coverage parameter. Its value will be 1, if a user is covered by BSj over RATk. Rmax is the maximum number of users connected to the network. Description of the Constraints are as follows:
Constraint 1 (C1): It state that a given
can be connected to only one BS over one RAT.
Constraint 2 (C2): It is a capacity constraint which ensures that the resource assigned to users cannot exceed the available resource.
Constraint 3 (C3): It assures that at least one and at most Rj RUs is allocated to every user connected to a RAT.
Constraint 4 (C4): It guarantees a level of satisfaction for users connected on the network.
Constraint 5 (C5): It permits only one user to connect to a BS over a RAT.
So, with these constraints and utility the objective function of our problem is given by
Utility based Objective 1 (F-1)
Formulation of Objective Function Based on Energy Efficiency
Usually two types of transmission take place in half duplex relay aided network:
UE to BS (
UE to Relay and relay to BS (
In this work, we considered first scenario i.e. direct communication between UE and BS for simplicity. As we know, UE have power constraint which raised the demand of power control in the transmission of signal from UE to the BS. Thus we focused on maximization of EE. EE can be calculated as:
where , and pc represents circuit power consumption at the UE.
When UE directly communicates with the BS then
,
and
= 1
Where indicates the transmission power of
, transmitting via channel n of relay node r and
. The mode selection component
decide the UE association with the direct or indirect mode (via intermediate nodes/ relay nodes).
Where, and
, that is one UE associate with only one mode. Under the above mentioned condition, EE of the network can be rewritten as:
In calculation of for fixed BS selection and channel allocation, the total power required by an UE to send information to nearby BS is divided into two phase namely radio frequency RU consumption and internal base band unit (BBU) consumption.
Here we calculate the transmission power of UE for transmission of signal to nearby BS j which is denoted by (Tx. Power required for transmission from UE to BS j over RAT k in the sub carrier m).
where ,
and
represent the power consumption of radio RU, radio frequency (RF) unit and BBU, respectively.
is the peak power measured at the digital to analog converter (DAC) per antenna elements and
is the efficiency of the power amplifier, which can be calculated as:
The power consumption at the internal BBU unit of UE can be evaluated as
Where,, Nc is the number of active central processing unit (CPU) cores,
and
is the maximum and minimum power consumption of each cores.
represents load on the CPU by the BBU process for Nc cores (in %).
where r is target data rate, and k are relevant coefficient. Thus, the EquationEquation (18)
(18)
(18) become
So, finally the generalized form of EE in the direct UE to BS link can be written as
Where
EE based Objective 2 (F-2):
Subject to constraint, (21.1)
(21.2)
(21.3)
(21.4)
(21.5)
(21.6)
Where, Equations (21.1 and 21.2) ensure channel selection by UE, and Equations (21.3, 21.4, and 21.5) ensure the transmit power and achievable throughput limit of each UE. Equation (21.6) represents user association constant. The final objective corresponds to all the mode can be formulated as
Subject to constraints C1–C11
Where
F1 and F2 signify the objective functions and their respective weights are ω1 = ω2 = .5 (equal weightage).
Algorithm of Cell Planning in Multi-RAT Scenario
The cell planning algorithms for Multi-RAT communication scenario considering the key issues identified in Section-2 and subsequent formulation of the problem in Section-3, is presented in this section. Under the presented scenario, we proposed meta-heuristic optimization based framework for the problem of resource allocation. We use an efficient meta-heuristic optimization algorithm DADE (Debnath et al. Citation2020) for its superior convergence and computational capability. In DADE, the limitations of Dragonfly Algorithm (DA) (Debnath et al. Citation2018; Mirjalili Citation2016) like lacks of internal memory, slow convergence rate and tendency to stack into local optima are removed by hybridizing DA with the help of differential evolution (DE) (Storn and Price Citation1997) algorithm and strategy to update the internal memory matrix of the algorithm.
In DADE, the target vector of DE is initiated with the iterative best solution outcome from DA, then learning based mutation of DE is perform based on the pBest () gBest (
) and gWorst (
) solution of DA. Corresponding to each target vector
(obtained from DA), mutation is performed according to the proposed equation as follows:
Where xworst is the global worst particle in the swarm, xold is the position of the individual in the previous iteration, r1 ϵ (0, 1) is the random number rn ϵ N (0, 1) following normal distribution, thus the multiplication of rn with the worst particle signifies that the mutation vector is penance when the rn < 0 and take it as learning factor when rn > 0 and F1 and F2 are the modified mutation factor calculated as follows.
Thereafter, crossover is performed with crossover factor (CR) of 0.9 to enhance the diversity of the solution.
Considering an area of length (l) and breadth (b) and then from the theory of computational geometry, we find the minimum number of BS (N0) required to cover-up the whole zone. The flowchart of the proposed user association model is presented in the given below
Table
Figure 4. Flowchart of the proposed user association model.
Description of the algorithm: After initialization of all the parameters and constant at the initial stage of the algorithm. In step 1, population vector is created with the said dimension and number of particles. The size of the population vector is govern by the N0 number of BS evaluated from the computational geometry analysis. In step 2 of the algorithm the boundary of parameters (x: latitude, y: longitude, and h: height) related to the position vector are evaluated. Next, random association to nearby BS based on SINR is performed in step- 3. Then in the subsequent steps 4 to 21, the position vector for the BS solutions are updated with the Dragonfly Algorithm (DA) algorithm, afterward in step 22 the iteration counter θ is updated. In steps 24 to 28, the gBest parameter is updated according to the trial vector produce in the DE algorithm. Accordingly the key parameter of the algorithm namely pBest, gBest, and gWorst solution of DA algorithm is utilize to update the mutation process of DE for high population diversity. High population diversity ensures improved exploration of the algorithm. Further, the update of convergence span controller Θ in step 41 ensures the convergence of the algorithm to reach the global set of optimization result of cell planning. The fulfillment of Θ > Θ_Max criteria depicts that the algorithm fail to reach the global optimal solution under the mentioned user data rate constraint, thus reframe NBS and generate new set of population in step 43. In this way ultimately get reach to the set of BS through which the considering geographical area could be plan.
Evaluation Methodology
Two general modes of network operation, i.e. normal and equity mode is considered. In normal regular mode, users are free to associate with any BS of corresponding RAT with Class-A and Class-B service. In equity mode, all users are served with the same data rate like normal regular mode of Class-A and class-B service. The key difference in equity mode is its provision to provide more importance to EE. In this mode users are associated with the BS/RAT accounting their 70% cost in respect of EE and remaining 30% in respect of utility. The details of different assumed parameters are listed in , respectively.
Table 1. Parameters assumption for both the RAT
Table 2. UE utility parameters with different services and contracts
Simulation Results and Discussion
Considering the equity mode and nonuniform distribution of user, the analysis of UE and network utility is perform on the basis of real time (Class-B) and nonreal time (Class-A) types of traffic classes with regular and premium contract of service.
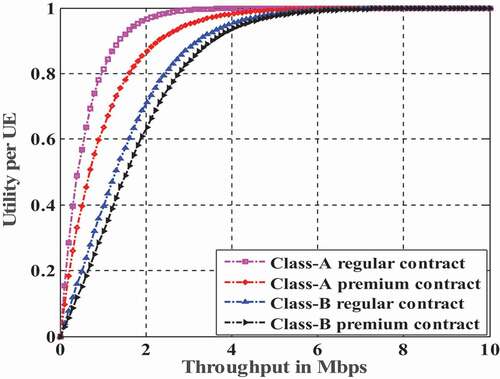
From , it is observed that there exist exponential relation between throughput and utility. The utility of the UE exponentially increases with the increasing throughput of user. Association of user to the network following Class-A regular contract offer maximum UE utility. It also depicts that the regular contract achieves higher UE utility as compared to premium contract for both Class-A and Class-B. The utility of UE in class-A is more and rapidly goes to saturation as compare to Class-B service as because the user demand data rate is more in Class-B service as compare to Class-A. Thus to cater the demand data rate of user in Class-B by the limited network resources degrades the UE utility.
Figure 5. Utility of UE with different service classes and contracts.
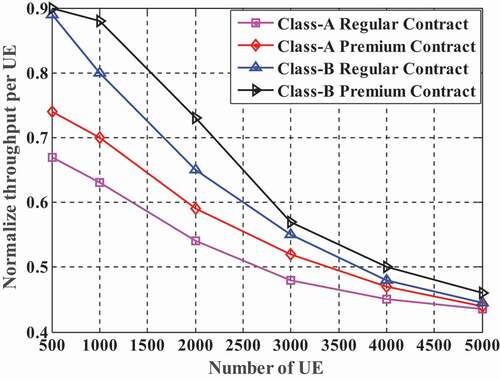
The normalized throughput per UE in Class-A service is lower as compared to Class-B as shown in which is quite obvious as the premium contract of Class-B service has the high QoS real time service like emergency and expensive dedicated data. It can be observed that the premium contract of Class-B always achieves higher throughput per UE as compared to both regular contract of Class-B and class-A user. It is also observed that the achievable throughput per UE decaying exponential with the number of user in the network. Next, we observe the characteristics of user utility with respect to the number of user associated in the network considering both class-A and B service.
Figure 6. Normalize throughput per UE vs. number of users.
We also investigate various preferences of user association and resource allocation by tuning the weights associated with different service classes and contracts namely α, and β. Equally prioritizing the three different terms of the objective function by considering =
=
= .5, two different settings have been taken into account along with the weight factor associated with different classes and contracts. Considered different settings for
are shown in . The respective results and their description are also provided here for your convenience.
Table 3. Different settings for
and , depicts the variation of the normalized utility per UE with respect to the number of UE available in the network for setting-1 (S1) and setting-2 (S2), respectively. It is observed that the UE utility decreases rapidly with increasing numbers of UE. It justifies the general behavior of the dense telecommunication network in which increasing traffic load on the network degrades UE satisfaction.
Figure 7. Normalize utility per UE vs. number of user based on setting-1.
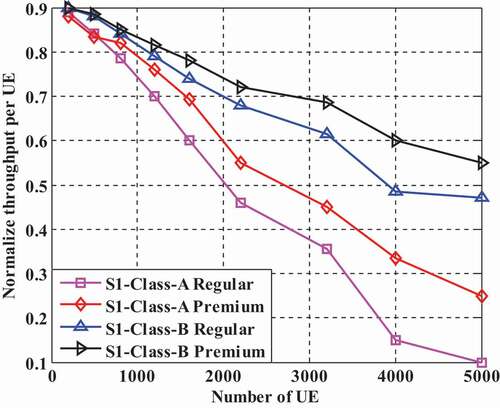
Figure 8. Normalize utility per UE vs. number of user based on setting-2.
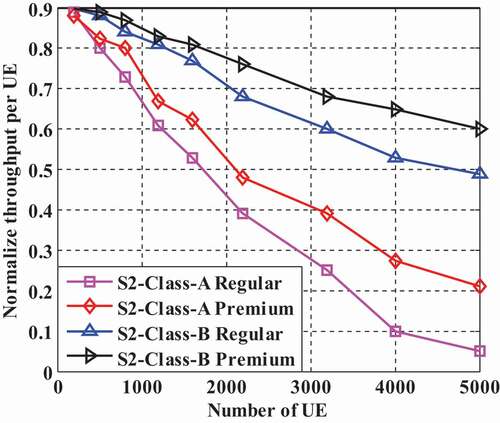
It is clear from and that the user with premium contract services has the higher utility as compared to the user with regular contract. It is observed that all Class-B services outperform the Class-A services along with that the user with Class-B premium contract has better UE utility than the regular one and Class-A also follows the same.
For Class-A premium service, S1 offers 4% higher satisfaction to UE as compared to S2, and provides almost similar satisfaction for Class-A regular contract services for both S1 and S2. Whereas, S2 offers 5% and 2% higher satisfaction to UE in class-B premium and regular contract services, respectively as compared to S1.
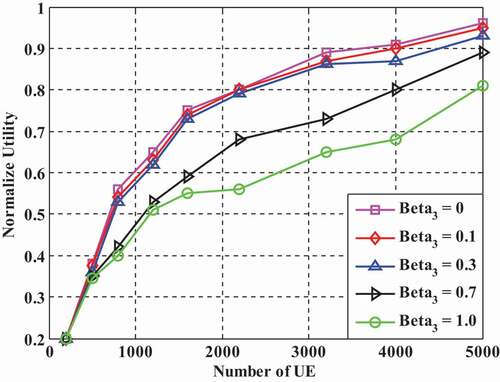
The term β3 denotes the blocking of additional UE association to the network for higher sum utility. Sensitivity analysis is performed to evaluate the value of β3 for different network utility impact, while keeping the other parameters constant. From , it is depicted that the blocking percentage increases with the increasing number of UE in the network, and the blocking percentage decreases with increasing values of β3 which is intuitively justified. Higher number of user associations increases the network congestion and hence degrades the overall network performance which is justifiable by . Further, we observed that the increasing blockage from β3 = 0 to β3 = 1 decreases the normalized utility. Thus, optimal selection of β3 is crucial in attaining a better network performance. In the rest of the analysis, we kept β3 = .5, as it has a decent trade-off between UE utility and blockage.
Figure 9. Percentage of blockage for different values of β.
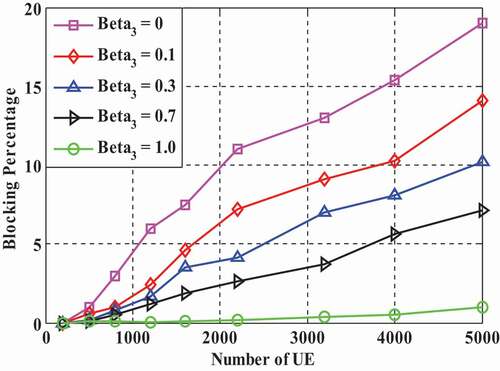
Figure 10. Network utility for different values of blockage parameter β.
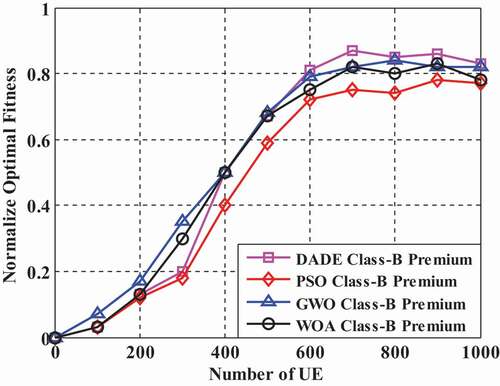
A detailed comparison of the proposed algorithm with the other popular state-of-the-art optimization algorithms namely particle swarm optimization (PSO) (Kennedy and Eberhart Citation1995), Whale optimization algorithm (WOA) (Mirjalili and Lewis Citation2016), and Grey wolf optimization (GWO) (Mirjalili, Mirjalili, and Lewis Citation2014) is presented here.
depicts that the optimal fitness achieved with all the considered state-of-the-art algorithms has followed the same characteristics but the proposed DADE-based algorithm has significantly improved the network performance in terms of high utility and stability. Algorithms are executed for 30 runs, each consisting of 500 iterations to obtain the mean fitness and the standard deviation. It can be clearly seen that the proposed DADE based algorithm outperforms GWO, PSO and WOA with a margin of 1%, 5%, and 3%, respectively in terms of optimal fitness while considering 1000 UEs. On the other hand, standard deviation of 3.47E-14 (≈0) reveals the stability of the algorithm in achieving optimal fitness with less error.
Figure 11. Optimal fitness vs. number of UE according to different algorithm.
The simulation is performed on a computer having Intel Xeon processor of 3.30 GHz and 16GB of internal RAM using Matlab 2015®. The achieved standard deviation of 3.47E-14 after 30 independent runs depicts the consistency, stability, reliability and the effectiveness of the proposed algorithm to tackle user association and resource allocation problems of communication networks. Results of , shows the significant benefits of the proposed algorithm in terms of maximizing the normalized network utility, standard deviation, and computation time.
Table 4. Statistical result of network utility maximization problem
It is observed that the proposed DADE-based algorithm outperforms other state-of-the-art optimization algorithms in achieving optimal cost with low standard deviation and less computation time.
Cell Planning and Corresponding User Association in Multi-RAT Scenario
Here we perform the cell/BS planning considering both the RAT BS based on the constraints like BS capacity, user demand and coverage area. In cell planning we are using the DADE algorithm as described earlier. We considered a scenario of 5000 users accessing the radio resources at a period of time in the defined area of 5 KM × 5 KM, with data rate of 512 Kbps for downlink and 75 Kbps for uplink in a channel bandwidth of 20 MHz. For the considered scenario we perform maximization of network utility, ensuring ongoing services and the data rate requirement of users. To simulate the proposed algorithm we set parameter as expressed in the .
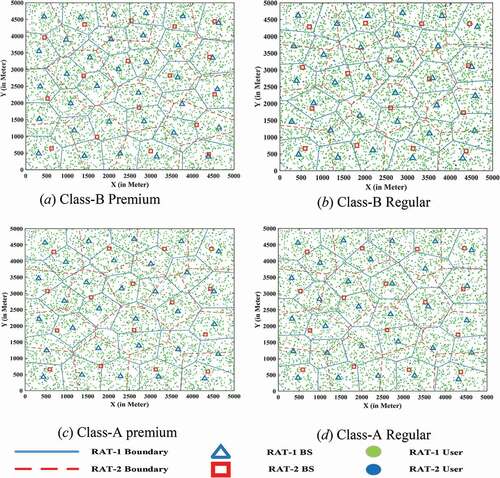
The result deliberated in shows that 46 optimal BS (30 of RAT-1 BS and 16 of RAT-2 BS) required to cover the considered geographical area while all the users are served with Class-A regular contract () while 47 optimal BS (31 of RAT-1 BS and 16 of RAT-2 BS) are required to cover the same area if all the users are serving with Class-A premium contract (). It indicates that premium contract require more number of optimal BS in comparison to regular contract. The reason behind this is the higher data rate demand of premium contract users. Similarly in Class-B service the optimal required BS to cover and cater all the user in the above mentioned geographical area, the number of BS required with premium service (51 BS) is comparatively more than the regular contract service of Class-B service (48 BS) as shown in , respectively. It is also observed that the number of BS required to cover the mentioned area with the Class-B users are comparatively more than the Class-A users. The obtained results justify the intuition that the BS capacity has to be enhance or the number of deployed BS to be increase to mitigate the higher data rate demand of users.
Table 5. Number of BS required as per the considered user service and contract
Figure 12. Cell planning in different user association scenario. (a) Class-B premium. (b) Class-B regular. (c) Class-A premium. (d) Class-A regular.
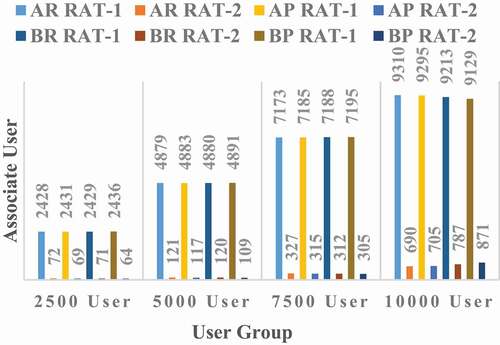
depicts the statistical results of the user associated with the RAT as per the class and contract of service. Considering total 2500, 5000, 7500, and 10,000 users in the considered area accessing same class of service (A or B) with contract R or P, we observe that the user associated with the RAT is increases with the number of user in the geographical area. In the case of 2500 users, the user associated with the other RAT/BS in Class-A contract is more as compare to Class-B as because the number of deployed BSs in class-B is more. It is also observed that with the increasing number of user in the area, the UE association to other RAT in Class-B is comparatively more than Class-A. Moreover, it could also observe that number of user associated with other RAT in Class-B premium contract is more as comparison to Class-B regular, Class-A premium, and Class-A regular contract service which is intuitively justified as because the user demand data rate in Class-B premium contract is high as compare to other contract of service. Therefore to satisfying the user demand more traffic offloading is done in Class-B premium contract of service. The summary of the cell planning in Multi-RAT scenario considering different class and contracts are listed in the .
Figure 13. Associated user in different RAT based on class and contract.
Case Study
Here one case study is analyzed considering all users are from the premium contract of Class-B service as shown in .
Figure 14. User association considering blackout of two BS using same RAT.
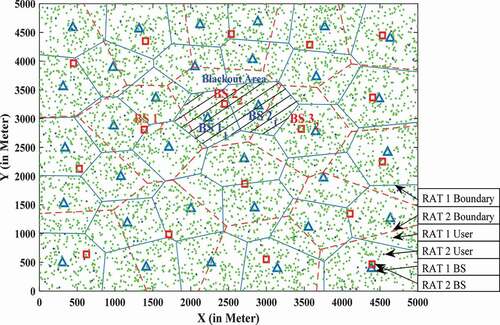
By shutting down some BSs of one RAT we analyze the association of blackout area users (user of down BS) with the BSs of other RAT based on the received signal strength. From this case study, it is observed that the users of blackout area are associated with the operational BS of other RAT on the basis of BS existence and communication need of user in the geographical region. The summary of user association to the RAT- 2 BS when two BS of RAT-1 are shut down as shown in . From the given result of , it can be observe that 115 users of BS1 are associated with the RAT-2 BS1 (9 users) and BS2 (106 users) and the 122 blackout users of BS2 of RAT-1 are associated with the RAT-2 BS2 (86 users) and RAT-2 BS3 (36 users).
Table 6. Summary of user association to RAT-2 BS when two RAT-1 BSs are shut down
Results depict that due to optimal deployment of BS in Multi-RAT scenario, the zonal blackout/emergency users has the provision to associate with the other available RAT as per the user association principle describe in and .
Conclusion
In this paper, we analyzed the optimal resource allocation and user association in multiple radio access technology (Multi-RAT) heterogeneous network (Het-Net) through traffic offloading. A novel algorithm is proposed for optimal user association and RAT selection while maximizing the overall network utility. User association to the optimal RAT based on quality of services (QoS) depicts that the user equipment (UE) normalizes utility for all the class and contracts of services that obey decaying characteristics. It is observed that the achieved network utility characteristics of different considered services are in order of Class-B premium, Class-B regular, Class-A premium, and Class-A regular. It is confirmed that UEs accessing real-time, high-priority services have a high utility, and require high QoS. In network utility maximization, the proposed algorithm outperforms its counterparts with a huge margin in terms of fitness as well as performance stability. Moreover, optimal cell planning in Multi-RAT reveals that the base stations are deployed in both the RATs according to UE density and their respective demand of data rate. In future, we will analyze the traffic density of Het-Net consisting of macro, pico and small cells while maximizing the network utility via reinforcement learning based algorithm and network virtualization.
Disclosure statement
No potential conflict of interest was reported by the author(s).
Additional information
Funding
References
- Ahmad, I., S. Shahabuddin, H. Malik, E. Harjula, T. Leppänen, L. Loven, A. Anttonen, A. H. Sodhro, M. M. Alam, M. Juntti, et al. 2020. Machine learning meets communication networks: Current trends and future challenges. IEEE Access 8:223418–60. doi:https://doi.org/10.1109/ACCESS.2020.3041765.
- Aryafar, E., A. H. Keshavarz, M. Wang, and M. Chiang. 2013. RAT selection games in HetNets. Proceedings IEEE INFOCOM, Turin 998–1006. doi: https://doi.org/10.1109/INFCOM.2013.6566889.
- Bayer, N., D. Sivchenko, H. J. Einsiedler, A. Roos, A. Uzun, S. Gondor, and A. Kupper. 2011. Energy optimisation in heterogeneous Multi-RAT networks. 15th International Conference on Intelligence in Next Generation Networks, Berlin, Germany, 139-144. IEEE. Doi: https://doi.org/10.1109/ICIN.2011.6081062.
- Bouali, F., K. Moessner, and M. Fitch. 2016. A context-aware user-driven framework for network selection in 5G Multi-RAT environments. IEEE 84th Vehicular Technology Conference, Montreal, QC, Canada, 1–7. Doi: https://doi.org/10.1109/VTCFall.2016.7880848.
- Das, D., and D. Das. 2017. A novel UE centric multi-RAT deployment model. 2017 International Conference on Smart Technologies for Smart Nation, Bengaluru, India, 866–71. Doi: https://doi.org/10.1109/SmartTechCon.2017.8358496.
- Debnath, S., S. Baishya, D. Sen, and W. Arif. 2020. A hybrid memory-based dragonfly algorithm with differential evolution for engineering application. Engineering with Computers 37 (4):2775–802. doi:https://doi.org/10.1007/s00366-020-00958-4.
- Debnath, S., A. Jee, S. Baishya, W. Arif, P. Saikia, and S. Naafi. 2018. Access point planning for disaster scenario using dragonfly algorithm. 5th International Conference on Signal Processing and Integrated Networks, Noida, India, 226–31. Doi:https://doi.org/10.1109/SPIN.2018.8474051.
- Dhia, I. B., M. Bouhtou, T. En-Najjary, S. Lahoud, and X. Lagrange. 2017. Optimization of access points selection and resource allocation in heterogeneous wireless network. EEE 28th Annual International Symposium on Personal, Indoor, and Mobile Radio Communications, Montreal, QC, Canada, 1–7. Doi: https://doi.org/10.1109/PIMRC.2017.8292261.
- Fooladivanda, D., A. A. Daoud, and C. Rosenberg. 2011. Joint channel allocation and user association for heterogeneous wireless cellular networks. IEEE 22nd International Symposium on Personal, Indoor and Mobile Radio Communications, Toronto 384–90. doi: https://doi.org/10.1109/PIMRC.2011.6139988.
- Ghimire, J., and C. Rosenberg. 2013. Resource allocation, transmission coordination and user association in heterogeneous networks: A flow-based unified approach. IEEE Transactions on Wireless Communications 12 (3):1340–51. doi:https://doi.org/10.1109/TWC.2013.013013.120940.
- Gupta, A., and R. K. Jha. 2015. A survey of 5G network: Architecture and emerging technologies. IEEE Access 3:1206–32. doi:https://doi.org/10.1109/ACCESS.2015.2461602.
- Helou, M. E., M. Ibrahim, S. Lahoud, K. Khawam, D. Mezher, and B. Cousin. 2015. A network-assisted approach for RAT selection in heterogeneous cellular networks. IEEE Journal on Selected Areas in Communications 33 (6):1055–67. doi:https://doi.org/10.1109/JSAC.2015.2416987.
- Kennedy, J., and R. Eberhart. 1995. Particle swarm optimization. Neural Networks, in Proceedings IEEE International Conference on, Perth, WA, 4:1942–48. doi: https://doi.org/10.1109/ICNN.1995.488968.
- Li, J., and Y. Han. 2016. Multi-RAT wireless network capacity optimization under optimal spectrum splitting in LTE-U. IEEE Wireless Communications and Networking Conference, Doha, Qatar, 1–6. Doi: https://doi.org/10.1109/WCNC.2016.7564895.
- Lim, G., C. Xiong, L. J. Cimini, and G. Y. Li. 2014. Energy-efficient resource allocation for OFDMA-based Multi-RAT networks. IEEE Transactions on Wireless Communications 13 (5):2696–705. doi:https://doi.org/10.1109/TWC.2014.032014.131410.
- Mirjalili, S. 2016. Dragonfly algorithm: A new meta-heuristic optimization technique for solving single-objective, discrete, and multi-objective problems. Neural Computing & Applications 27 (4):1053–73. doi:https://doi.org/10.1007/s00521-015-1920-1.
- Mirjalili, S., and A. Lewis. 2016. The whale optimization algorithm. Advances in Engineering Software 95:51–67. doi:https://doi.org/10.1016/j.advengsoft.2016.01.008.
- Mirjalili, S., S. M. Mirjalili, and A. Lewis. 2014. Grey wolf optimizer. Advances in Engineering Software 69:46–61. doi:https://doi.org/10.1016/j.advengsoft.2013.12.007.
- Mitra, R. N., and D. P. Agrawal. 2015. 5G mobile technology: A survey. ICT Express 1 (3):132–37. doi:https://doi.org/10.1016/j.icte.2016.01.003.
- Montoya, J., and N. G. Gómez. 2017. Optimal RAT selection and WiFi offloading in multi RAT HetNet with user-centric deployments. 2017 IEEE 9th Latin-American Conference on Communications, Guatemala City, Guatemala, 1–6. Doi: https://doi.org/10.1109/LATINCOM.2017.8240181.
- Naghavi, P., H. Rastegar, V. M. Shah, and H. Kebriaei. 2016. Learning RAT selection game in 5G heterogeneous networks. IEEE Wireless Communications Letters 5 (1):52–55. doi:https://doi.org/10.1109/LWC.2015.2495123.
- Sodhro, A. H., Y. Li, and M. A. Shah. 2016. Energy-efficient adaptive transmission power control for wireless body area networks. IET Communications 10 (1):81–90. doi:https://doi.org/10.1049/iet-com.2015.0368.
- Sodhro, A. H., M. S. Obaidat, S. Pirbhulal, G. H. Sodhro, N. Zahid, and A. Rawat. 2019. A novel energy optimization approach for artificial intelligence-enabled massive internet of things. 2019 International Symposium on Performance Evaluation of Computer and Telecommunication Systems (SPECTS), Berlin, Germany, 1–6, doi: https://doi.org/10.23919/SPECTS.2019.8823317.
- Sodhro, A. H., S. Pirbhulal, A. K. Sangaiah, S. Lohano, G. H. Sodhro, and Z. Luo. 2018. 5G-based transmission power control mechanism in fog computing for internet of things devices. Sustainability 10 (4):1258. doi:https://doi.org/10.3390/su10041258.
- Sodhro, A. H., L. Zongwei, S. Pirbhulal, A. K. Sangaiah, S. Lohano, and G. H. Sodhro. 2020. Power-management strategies for medical information transmission in wireless body sensor networks. IEEE Consumer Electronics Magazine 9 (2):47–51. doi:https://doi.org/10.1109/MCE.2019.2954053.
- Storn, R., and K. Price. 1997. Differential evolution – A simple and efficient Heuristic for global optimization over continuous spaces. Journal of Global Optimization 11 (4):341–59. doi:https://doi.org/10.1023/A:1008202821328.
- Sun, S., K. Adachi, P. H. Tan, Y. Zhou, J. W. Lee, and C. K. Ho. 2015. Heterogeneous network: An evolutionary path to 5G. 2015 21st Asia-Pacific Conference on Communications (APCC), Kyoto 174–78. doi: https://doi.org/10.1109/APCC.2015.7412506.
- Teixeira, F. B., T. Oliveira, M. Lopes, C. Leocádio, P. Salazar, J. Ruela, R. Campos, and M. Ricardo. 2017. Enabling broadband internet access offshore using tethered balloons: The BLUECOM+ experience. OCEANS 1–7. doi:https://doi.org/10.1109/OCEANSE.2017.8084877.
- Wang, F., W. Chen, H. L. Tang, and Q. Wu. 2017. Joint optimization of user association, subchannel allocation, and power allocation in multi-cell multi association OFDMA heterogeneous networks. IEEE Transactions on Communications 65 (6):2672–84. doi:https://doi.org/10.1109/TCOMM.2017.2678986.
- Wang, M., H. Gao, and T. Lv. 2017. Energy-efficient user association and power control in the heterogeneous network. IEEE Access 5:5059–68. doi:https://doi.org/10.1109/ACCESS.2017.2690305.
- Yan, M., G. Feng, and S. Qin. 2017. Multi-RAT access based on multi-agent reinforcement learning. IEEE Global Communications Conference, Singapore. 1–6. Doi: https://doi.org/10.1109/GLOCOM.2017.8254980.
- Yu, G., Y. Jiang, L. Xu, and G. Y. Li. 2015. Multi-objective energy-efficient resource allocation for Multi-RAT heterogeneous networks. IEEE Journal on Selected Areas in Communications 33 (10):2118–27. doi:https://doi.org/10.1109/JSAC.2015.2435374.
- Zakrzewska, A., F. D’Andreagiovanni, S. Ruepp, and M. S. Berger. 2013. Biobjective optimization of radio access technology selection and resource allocation in heterogeneous wireless networks. 11th International Symposium and Workshops on Modeling and Optimization in Mobile, Ad Hoc and Wireless Networks (WiOpt), Tsukuba, Japan, 652–58.