?Mathematical formulae have been encoded as MathML and are displayed in this HTML version using MathJax in order to improve their display. Uncheck the box to turn MathJax off. This feature requires Javascript. Click on a formula to zoom.
ABSTRACT
This study uses machine learning techniques to identify the key drivers of financial development in Africa. To this end, four regularization techniques – the Standard lasso, Adaptive lasso, the minimum Schwarz Bayesian information criterion lasso, and the Elasticnet– are trained based on a dataset containing 86 covariates of financial development for the period 1990 - 2019. The results show that variables such as cell phones, economic globalization, institutional effectiveness, and literacy are crucial for financial sector development in Africa. Evidence from the Partialing-out lasso instrumental variable regression reveals that while inflation and agricultural sector employment suppress financial sector development, cell phones and institutional effectiveness are remarkable in spurring financial sector development in Africa. Policy recommendations are provided in line with the rise in globalization, and technological progress in Africa.
Introduction
The slump in global economic activity in the last two years is primarily due to the loss of routine engagements imposed implicitly by the emergence of the coronavirus disease (COVID-19). The concern of policymakers is not only on the welfare implications of the pandemic but how economic activity can be sustained even in future health and economic turmoil. Indeed, such a breakthrough will lessen the impact of future pandemics on jobs, welfare, and the resources of policymakers. Crucially, in the developing world, the high physical contact in transactions coupled with the relatively low financial inclusion means that the progress toward shared prosperity is likely to be derailed in the event of future economic or health uncertainties. Per the long-term growth aspirations of Africa as spelt out in the Africa Agenda 2063, the development of the continent’s financial system should be a key policy consideration. This stems from the argument that at the heart of robust and equitable growth is a sound, efficient, dynamic, and innovative financial sector crucial for resource allocation, reduction in transaction cost, and creation of opportunities (Beck Citation2012; McKinnon Citation1973; Shaw Citation1973; World Bank Citation2019).
While a burgeoning financial sector can be growth-enhancing, Peprah et al. (Citation2019), Law and Singh (Citation2014) and Arcand, Berkes, and Panizza (Citation2015) warn that, in the developing world, rapid expansion of the sector can cause a heating-up in the economy, dragging down growth in the process. In Particular, Peprah et al. (Citation2019) put a 70% cap on the financial sector development–growth nexus in the case of Ghana while Law and Singh report 88% for a panel of 87 developed and developing economies. The foregoing arguments imply that realizing the lubricating effects of the financial sector while keeping it in check rests on the identification of key variables shaping the sector. The relevance of this is enshrined in the World Bank’s Reference Framework for Financial Inclusion StrategiesFootnote1 ,which comprises a set of programs, knowledge, and tools aimed at broadening financial inclusion especially in the developing world (World Bank Citation2018).
Indeed, the literature on the drivers of financial sector development in Africa is growing. Among others, the literature shows that financial development is driven by institutions, particularly, those for financial sector regulation and supervision, the macroeconomy, bank-specific factors, and technology (see, e.g., Aluko and Ajayi Citation2018; Ibrahim and Sare Citation2018). Notwithstanding these contributions, conspicuous gaps in the financial development literature, especially, on Africa are that (1) proxies are used to capture financial developmentFootnote2 ,and (2) prior contributions are inconclusive as to which variables are key for financial sector development in Africa (see, e.g., Almarzoqi, Naceur, and Kotak Citation2015; Aluko and Ajayi Citation2018; Arcand, Berkes, and Panizza Citation2015; Jedidia, Boujelbène, and Helali Citation2014; Madsen, Islam, and Doucouliagos Citation2018). Though the first issue has been addressed to some extent by Čihák et al. (Citation2013) and Svirydzenka (Citation2016), who, on recognizing that a country’s financial sector comprises a variety of financial institutions, markets and products, developed the Global Financial Development Database and Global Financial Development Index (FD Index),Footnote3 respectively, comprehensive empirical work(s) responding to the latter is(are) hard to find.
A survey of the literature shows that studies attempting such a contribution are plagued with some methodological flaws due to (1) the application of techniques that lack regularization powers for inference even in large datasets, and (2) the preferential/subjective selection of covariates in regression problems (see, e.g., Adu, Marbuah, and Mensah Citation2013; Aluko and Ajayi Citation2018; Ibrahim and Sare Citation2018; Nguyen, Su, and Doytch Citation2020). The concern with these empirical works is that even tenuous variables may be deemed relevant for driving financial development under some modeling assumptions, specifications, and data transformation. Addressing this challenge and thus informing policy appropriately can be through the use of machine learningFootnote4 (artificial intelligence) algorithms for regularization, prediction, and inference (see Tibshirani Citation1996; Zou Citation2006; Saura Citation2021). This forms the contribution of this paper where two objectives are introduced to extend the financial development literature on Africa. First, we train algorithms for the Standard lasso, Adaptive lasso, the minimum Schwarz Bayesian information criterion lasso (Minimum BIC lasso), and the Elasticnet to study patterns underlying a dataset on 42 African countries to identify the main determinants of financial development. Second, to provide inferences robust to potential endogeneity concerns, model misspecification, and the underlying data complexity on the selected drivers of financial development, we apply the double-selection lasso linear regression (DSL), partialing-out lasso linear regression (POLR), and partialing-out lasso instrumental variable regression (POIVLR). The relevance of our contribution is that it can prove crucial in informing policy actions in Africa on the key variables to target if monetary policy propositions, resource allocation, and the overall effectiveness of the financial sector in fostering shared prosperity is to be achieved. It could also prove invaluable to various African governments in their bid to broadening access to formal financial services especially for the financially excluded as well as the efficient allocation of resources to transform the continent’s highly informal structure to a formal one. Additionally, the study could aid stakeholders interested in Africa’s financial sector development, plan, strategize, and possibly initiate necessary reforms to spur a sound, responsible, and innovative financial sector.
The rest of the paper is organized as follows. The next section presents an overview of Africa’s financial sector and a literature review on drivers of financial development. The methods and data underpinning the empirical analysis are also presented under the data and methodology section. Under the presentation and discussion of results section, our empirical findings are presented while the conclusion and policy recommendations are provided in the conclusion section.
Literature Survey
Financial Sector Development in Africa: Current and Historical Perspectives
In 2017, the World Bank reported that an astounding 1.7billion people were financially excluded, down from 3billion in 2014 (Demirgüç-Kunt et al. Citation2018). The report further indicates that at least 300 million adults in Africa do not have accounts with banks or any form of financial institution. Indeed, compared to regions such as Europe, and the Americas, the financial sector of Africa lags behind. In the 1960s–1990s, Africa’s financial sector was highly repressed or polarized for protectionist motives of various governments (e.g., in Ghana, Nigeria, and Guinea), resulting in inefficient resource allocation. It was until the last decade that financial openness and repression eased in the region. Albeit not surprising, it is worrying to note that no African country has attained the average financial development threshold of 0.5 per IMF’s classification as apparent in the upper panel of . Further, information gleaned from the upper panel of shows that, though the likes of South Africa, Mauritius. Seychelles, Botswana, and Nigeria have made significant strides in financial sector development, that of Cameroon, Comoros, Congo DR., Guineas-Bissau, Sierra Leone, and the Central African Republic remain significantly underdeveloped.
Figure1. Average financial development (upper panel), and financial markets and institutions (lower panel) in Africa, 1980–2019, IMF Findex data.
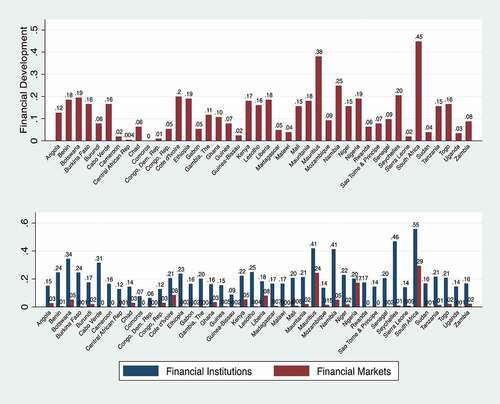
Also notable is the information garnered from the lower panel of , which shows that, vis-à-vis financial institutions, Africa’s financial market is significantly underdeveloped. Also conspicuous is the striking within-country experiences in (lower panel), which reveal that countries such as South Africa, Nigeria, Mauritius, Botswana, Cote d’Ivoire, and Kenya have made significant progress in the development of their financial institutions. The overview of Africa’s financial sector development in underscores the need to strengthen the continent’s financial sector. Achieving this objective will, among others, rest chiefly on identifying variables crucial for financial sector development to aid decision-makers plan, reform, or re-strategize – one reason why this study is relevant.
Theoretical and Empirical Literature Review
In this section, we present some theories and empirical evidence on the drivers of financial development.
Endowment Theory (Settler Mortality Hypothesis)
The endowment theory as put forward by Acemoglu, Johnson, and Robinson (Citation2001) points to the relevance of institutions, resource endowment, and geography for financial sector development. The authors indicate that, in the 1960s and 1970s, institutions were established to offer protection for private property; protection against government power of expropriation; and guarantee the transfer of resources from colonies to the colonizers with little or no investment (Acemoglu, Johnson, and Robinson Citation2001). Broadening the import of this theory, Beck, Demirgu ̈ç-kunt, and Levine (Citation2003) also argue that initial endowments are rather germane in explaining international differences in financial sector development than legal origins and that countries with poor geographical endowments are likely to have less developed financial sector.
Law and Finance Theory
La Porta et al. (Citation1998) championed this theory with the fundamental proposition that a country’s legal framework matters for financial sector development. The theory comes in two forms – a part that recognizes the relevance of robust legal systems in financial sector development (Beck, Demirgu ̈ç-kunt, and Levine Citation2003), and another part that identifies legal traditionsFootnote5 as the driving force behind cross-country differences in financial sector development. Empirical evidence for this theory is found in Djankov, McLiesh, and Shleifer (Citation2007), who argue that civil law countries realize lesser bureaucracy, corruption, enhanced government credibility, and greater financial development. In the context of Africa, however, Fowowe (Citation2014) does not find empirical support for this theory.
Financial Liberalization Theory
This is the McKinnon–Shaw hypothesis theorizing the growth of a country’s financial sector following financial liberalization (McKinnon Citation1973; Shaw Citation1973). The theory indicates that both domestic savings and credit to the private sector increase if there is a moderately high and positive interest rate. They argue that financial repression results in market disequilibrium, consequently limiting allocative efficiency. The authors further suggest that in developing countries like Africa financial repression can lead to firms facing financing constraints due to limited access to external finance and credit controls. In line with this theory is empirical evidence by Baltagi, Demetriades, and Law (Citation2009), who find that financial sector development grows even faster if financial liberalization is accompanied by greater trade and financial openness.
Inflation and Finance Theory
This theory was put forward by Huybens and Smith (Citation1999) with the fundamental proposition that high inflation levels suppress financial development. Furthering this argument, Rousseau and Wachtel (Citation2002) argue that macroeconomic instability causes financial institutions to ration credit, reducing financial market activity and profitability in the process. The authors further indicate that high inflation can discourage long-term loans, resulting in inefficient allocation of resources. In related empirical work, Boyd, Levine, and Smith (Citation2001) and Kim and Lin (Citation2010) find evidence that the inflation–finance nexus is nonlinear and exists only up to a certain point.
Demand-Following (Growth-Led) Hypothesis
The demand-following hypothesis is the well-known argument by Robinson (Citation1979) that growing economic activity leads to greater demand for financial services by the real sector, enhancing the utilization of financial products and services. Thus, increasing economic growth reflects rising living standards and the likely participation of the populace in the country’s financial sector. This theory has been enhanced significantly by empirical evidence from authors such as Akinlo and Egbetunde (Citation2010), who argue that economic growth is crucial for driving both financial inclusion and financial development.
Empirical Literature Survey
The literature shows that variables such as inflation and public debt impede financial development (Ayadi et al. Citation2015; Elsherif Citation2015; Sanusi, Meyer and Ślusarczyk Citation2017; Aluko and Ibrahim Citation2020). Particularly, Ayadi et al. (Citation2015) argue that growth in government debt deteriorates the growth of credit and crowds out private lending and investment. Boyd, Levine, and Smith (Citation2001) also provide convincing evidence to conclude that high inflated economies are more likely to have banks and equity markets that are less robust and efficient. Specifically, in inflation targeting economies like Ghana, information asymmetry can bid inflation up, creating frictions in the credit market, leading to financial sector deterioration in the process (Padachi et al. Citation2008). Similar evidence is found in Bittencourt (Citation2011), who examined the relationship between inflation and finance in Brazil from 1995 to 2002.
There is also the evidence that financial sector development thrives on conducive economic, financial, and institutional settings. Indeed, evidence gleaned from Khalfaoui (Citation2015)and Shabbir et al. (Citation2018)indicates that fiscal discipline, economic growth, and a transparent monetary regime are crucial for enhancing the access, depth, and efficiency of financial systems. In a related study by Beck and Levine (Citation2005), regulatory quality in the form of prudential supervision has been identified to enhance financial development and stability. In line with this evidence is the finding by Naqvi et al. (Citation2017) that geopolitical fragilities peculiar of the developing world tend to hinder financial sector development. Similarly, authors such as Ayadi et al. (Citation2015) and Cherif and Dreger (Citation2016) report that legal institutions, good democratic governance, and adequate implementation of financial reforms are necessary for spurring financial sector development. Additionally, while authors such as Voghouei et al. (Citation2011)and Khalfaoui (Citation2015) point to the crucial implications of institutions, financial markets, legal tradition, and political economy as factors driving financial sector development, Raza et al. (Citation2014), and Cherif and Dreger (Citation2016) identify corruption and rule of law as fundamental ingredients for achieving a robust and burgeoning financial sector.
In a more recent study, Aluko and Ajayi (Citation2018) find that variables such as population density, trade openness, and capital investment are significant drivers of financial development in Africa. Also, there is evidence that government expenditure boosts financial sector development either through competition or infrastructural development (Naceur, Cherif, and Kandil Citation2014). Further, studies such as Peprah et al. (Citation2019) and Aggarwal, Demirgu ̈ç-kunt, and Pería (Citation2011) find that remittances increase the volume of bank deposits, financial intermediation, and financial sector development. Last but not the least, the literature shows that human capital matters for financial development (Kodila-Tedika and Asongu Citation2015).
Data and Methodology
Data
The dataset underpinning the analysis is entirely macro and spans 1980–2019 for 42 African countriesFootnote6. The variable of interest in this study is financial development and is drawn from the International Monetary Fund’s global Financial Development Index (Svirydzenka Citation2016). Data on its potential bank-specific, institutional/regulatory, and socioeconomic drivers as elaborated in Section 2 are also taken from the World Bank’s Global Financial Development Database (Čihák et al. Citation2013). Variables such as interest rate spread, lending rate, deposit rate, non-performing loans, Boone indicator, net interest margin, return on asset, and stock market capitalization are found in the dataset. Our welfare distribution variables such as the poverty headcount, poverty gap (US$1.90), Gini index, Palma ratio, and the Atkinson index are also taken from Global Consumption and Income Project (Lahoti, Jayadev, and Reddy Citation2016) and the World Development Indicators (World Bank Citation2020). Taking cues from Aluko and Ajayi (Citation2018), we capture the potential relevance of the rise in global interconnectedness, driven chiefly by information technology (Ofori and Asongu Citation2021), for financial sector development in Africa. Our globalization variables such as economic globalization, social globalization, political globalization, financial globalization, and trade globalization are sourced from the Konjunkturforschungsstelle (KOF) globalization index (Gygli et al. Citation2019). Additionally, institutional, structural, and macroeconomic variables such as agricultural sector employment, the ease of doing business, financial sector regulation, inflation, government expenditure, and unemployment are drawn from the World Bank’s World Development Indicators (World Bank Citation2020). The definitions of the variables are presented in in the Appendices section.
Estimation Strategy
Taking cues from Saura, Ribeiro-Soriano, and Palacios-Marqués (Citation2021), we elaborate the theoretical and empirical foundation of the study in this section. In the first part of this section, we pay attention to the relevance and specifications of the variable selection techniques. The second part also deals with the specification of the inferential models . The first part is in response to growing debate among researchers as to whether it is appropriate to apply classical estimation techniques such as the ordinary least squares (OLS) for inference even in large datasets or resort to machine learning techniques for variable selection and inference. The argument for the former centers on the fact that with appropriate theories, researchers can choose the right covariates in regression problems or resort to systematic reviews to identify the salient determinants of the outcome variable (see, e.g., Ribeiro-Navarrete, Saura, and Palacios-Marqués Citation2021). However, this may not be feasible if there are more predictors than observations as the required matrix () becomes invertible. Even if it is feasible, the presence of several predictors, for example, 86 in the case of this study, may cause overfitting of the model.
Overfitting is the inclusion of extra parameters that improve the in-sample fit but increases the out-of-sample prediction error. In the presence of overfitting, even though the attendant estimates are not biased, they are less efficientFootnote7 (James et al. Citation2013). This is because as the variables/features become large, least squares assumptions of no multicollinearity, homoscedasticity, and exogeneity typically break down, causing the out-of-sample error to increase and thus making inference and predictions flawed (James et al. Citation2013). This partly explains the inconclusive results on variables deemed crucial for driving/predicting financial development. Navigating this econometric blunder requires the use of reliable techniques for variable selection, inferences, and prediction.
Such techniques, as Tibshirani (Citation1996) argue, are efficient regardless of the number of covariates, model specification, nonlinearity, and time. The relevance of machine learning techniques in reducing data complexity and aiding sound decision-making is seen in its application in policy-relevant areas such as financial risk analysis (Kou, Peng, and Wang Citation2014), health (Mateen et al. Citation2020), transportation (Tizghadam et al. Citation2019), games and psychology (Sandeep et al. Citation2020), bankruptcy prediction (Kou et al. Citation2021), and large-scale group decision-making (Chao et al. Citation2021). In this study, therefore, we train four alternative shrinkage models – the first three from the lasso family (i.e., the Standard lasso, the Minimum BIC lasso, and Adaptive lasso), and the Elasticnet to achieve the first objective.Footnote8 Regularization is done by utilizing the bias–variance trade-off, where a tuning parameter (i.e., the bias) is introduced to reduce the variance associated with large datasets and consequently yield sparse estimates. Next, we perform causal inference on the selected covariates in Objective 1 by running the lasso inferential models: the double-selection lasso linear regression (DSL), the partialing-out lasso linear regression (POLR), and the cross-fit partialing-out lasso instrumental-variables regression (POIVLR) to address Objective 2.
Specification of Regularization Models
Specification of Standard Lasso and Minimum BIC Lasso Models
The Standard lasso variable selection technique was introduced by Tibshirani (Citation1996) to address the poor prediction and inference arising due to discretional selection of covariates in large dataset problems. The key advantages of the Standard lasso over traditional regression techniques are that it can (i) enhance model interpretability by eliminating irrelevant predictors; (ii) enhance prediction accuracy, as the elimination of irrelevant predictors reduces model variance without asubstantial increase in the bias; and (3) be applied regardless of data dimensionality.
It is imperative to note that the Standard lasso technique yields sound regularization based on agiven tuning parameter (λ), which determines the extent of the shrinkage (Belloni and Chernozhukov Citation2013; Tibshirani Citation1996). In this study, we follow Tibshirani (Citation1996) by specifying the Standard lasso objective function as apparent in EquationEquation (1)(1)
(1) . This approach runs on the penalty (
), also referred to as the
-norm, to obtain
defined in EquationEquation (2)
(2)
(2) :
where is financial development in country i in year t,
is amatrix of 86 potential key predictors of financial development. Effective regularization is done by minimizing the model sum of square errors with the given (
) or
-norm. Therefore, if
, then
plunges into the least-square estimatorFootnote9. Accordingly, if
, then all the predictors are eliminated from our model.
For brevity, we point out that the specification of the Minimum BIC lasso follows that of the Standard lasso as elaborated above with the same penalty (). It is worth noting, however, that unlike the Standard lasso, variable selection under the Minimum BIC is based on the model with the least Schwarz Bayesian information criterion (BIC) (Schwarz Citation1978). Despite the regularization powers of the Standard lasso and Minimum BIC lasso techniques, two key drawbacks have been identified. First, both techniques can be inconsistent as features grow rapidly, andsecond, the techniques are unable to perform hypothesis tests and confidence intervals.
Specification of Adaptive Lasso Model
The Adaptive lasso technique was introduced by Zou (Citation2006) to address the first regularization shortfall of the Standard lasso and Minimum BIC lasso techniques. Thus, the key contribution of the Adaptive lasso is that it aids sound variable selection even when data attributes grow faster than the number of observations. This is done by adding another property called the ‘oracle property’ () to the
-norm. In this study, we apply the Adaptive lasso technique as an alternative to the Standard lasso and Minimum BIC lasso to address Objective 1. To this end, we follow Zou (Citation2006) by minimizing the objective function in EquationEquation (3)
(3)
(3) to obtain (
) as specified in EquationEquation (4)
(4)
(4) :
where is financial development in country i in year t,
is a vector of the 86 covariates of financial development, and
are the attendant parameters.
Specification of Elasticnet Model
The Elasticnet technique draws on the strengths of the Standard lasso and Ridge regression for effective variable selection. The technique is thus built to apply the and
penalization norms in variable selection. The strength of the Elasticnet is that in highly correlated covariates, it can produce sparse and consistent regularization than the lasso family algorithms (Zou and Hastie Citation2005). Also, with the application of the
and
penalization norms, the Elasticnet becomes flexible in variable selection. The Elasticnet estimator minimizes the objective function:
where ,
, and
in EquationEquation (5)
(5)
(5) are as defined in EquationEquation (4)
(4)
(4) , and α is an additional Elasticnet penalty parameter,Footnote10 which takes on values only in [0,1]. This implies that sparsity occurs only when 0 < α < 1 and λ > 0. It is important to point out that in some special cases, the Elasticnet plunges into either the Standard lasso estimator (i.e., when λ = 1) or the Ridge estimator (i.e., when λ = 0).
Choice of Tuning Parameter
A key concern in regularization is the choice of the tuning parameter (λ), which controls the degree of shrinkage. Accordingly, a good value of λ is essential for the overall performance of regularization techniques and the attendant prediction results (Schneider and Wagner Citation2012). For instance, if λ becomes too large, regularization becomes too strong and this can shrink relevant variables to zero. Additionally, if λ is set under aresearcher’s discretion, it can yield ‘target sparsityFootnote11’ (Hastie, Tibshirani, and Wainwright Citation2019). Therefore, information criteria such as the cross-validation (CV), Bayesian information criterion (BIC), and Akaike information criterion (AIC) are usually relied upon to select appropriate λ (Tibshirani and Taylor Citation2012). For instance, the BIC and AIC are sometimes preferred to CV as they are faster to compute and are less volatile in small samples (Zou, Hastie, and Tibshirani Citation2007). In this study, we rely on both the BIC and CVFootnote12 in determining λ.
Specification of Lasso Inferential Models
To provide estimates and confidence intervals on the selected drivers of financial developmentFootnote13 , we apply the lasso inferential techniques. In specifics, we run the DSL, the POLR, and the POIVLR using the selected covariates in Objective 1 as the variables of interest, and all the redundant (weak) covariates as controls (see Chernozhukov, Hansen, and Spindler Citation2015b). It is worth noting that the lasso inferential techniques consider these controls as irrelevant and therefore, their inferential statistics are not reported (see, Belloni, Chernozhukov, and Wei Citation2016).
However, the number of relevant controls selected and the instruments used in cases where there is endogeneity are reported as part of the general regression statistics (Chernozhukov, Hansen, and Spindler Citation2015a). Further, unlike the variables of interest, which the researcher has no flexibility of adding to or excluding from the model, one can determine the number of controls in the modelFootnote14 . The strength of these models is that they are built to produce unbiased and efficient estimates irrespective of data dimensionality, model misspecification, endogeneity and multicollinearity.
Double-Selection Lasso Linear Model
In line with Objective 2 of this study, we follow Belloni, Chernozhukov, and Wei (Citation2016) and Belloni et al. (Citation2014) by specifying the DSL linear model as
where yis financial development, which is modeled to depend on , containing Jcovariates of interest (i.e., the Elasticnet or lasso selected key drivers of financial development) and
, which contains
controls (i.e., the redundant predictors of financial development). As indicated in Section 3.2.3, the DSL estimator produces estimates on
while relaxing the estimates for
.
Partialing-Out Lasso Linear Regression
Vis-à-vis the DSL, an added advantage of the POLR is that it enhances the efficacy of estimation as the model becomes too complex. Following Belloni etal. (Citation2012) and Chernozhukov, Hansen, and Spindler (Citation2015a; Citation2015b), we specify the POLR estimator as
where is financial development,
is a vector containing the
predictors of interest (i.e., the non-zero selected covariates of financial development), and
contains the
controls (i.e., the weak predictors of financial development). Like the DSL, the POLR yields inferential statistics only on the
covariates while relaxing that of the
controls.
Partialing-Out Lasso Instrumental-Variables Regression
We employ the POIVLR to address potential endogeneity concerns in this study. In particular, endogeneity is apparent taking cues from the supply-leading and demand-following hypotheses where financial development and economic growth are considered simultaneous. To address this, we follow Chernozhukov, Hansen, and Spindler (Citation2015a) by specifying our POIVLR model as
where is financial development,
comprises
endogenous covariates of interest,
contains the
exogenous covariates of interest, and
contains
controls. Allowing for potential endogeneity primarily due to the simultaneity between financial development and economic growth,
outside instrumental variablesFootnote15 denoted by
that are correlated with
but not with
are introduced. Theoretically, the controls and instrument can grow with the sample size; however,
and non-zero coefficients in
must be sparse.
Data Engineering and Partitioning Procedure
shows that 98.8% of the observations are present in our dataset. Mindful of astrongly balanced panel for training algorithms, the K-nearest neighbor (KNN) data engineering technique is applied, particularly, for variables such as the policy and institutional indicatorsFootnote16, insurance premium, stock market volatility, and infrastructure quality (see the results in in the Appendices section). The KNN is based on the principle that developments in adataset generally exist in close proximity with other cases that have similar properties (Van Hulse and Khoshgoftaar Citation2014). The KNN is mostly used when one has no prior knowledge about the distribution of the data. The KNN then selects closest neighbors according to adistance metric and estimates missing data with the corresponding mean or mode. The mean rule is used to predict missing numerical features while that of missing categorical features is addressed using the mode rule (Pan et al. Citation2015). In this study, therefore, the mean rule is used based on the Minskowski distance as specified in EquationEquation (9)(9)
(9) :
where is the called the Minkowski coefficient. The Minskowski distance reduces to the Manhattan distances if
and as the Euclidean distance if
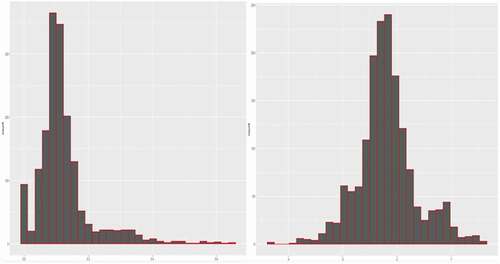
. Finally, we split the dataset into two parts– the training (70%) and testing (30%) samples– by applying the stratified data partitioning method, taking into account the skewed distribution of financial development as apparent in
Figure 2. Data partitioning plot, Training (Black) and Test (Red)

Presentation and Discussion of Results
Exploratory Data Analysis
For brevity, the exploratory data analysis is limited to the data partitioning resultsFootnote17 , the distribution of financial development, and the summary statistics. Information gleaned from the summary statistics in Footnote18 shows an average financial development figure of 0.128 in the training set as compared to 0.121 in the testing set. Also, the average remittance inflow into Africa is 4.75% in the training set as compared to 4.02% in the testing set. Additionally, the data shows amean institutional effectiveness score of 2.967 in the training set compared to 2.938 in the testing set, both shy of the average 3.0. Further, the data shows an average income per capita of US$3730.3 and US$3938.6 in the training and testing sets, respectively.
Data Partitioning and Distribution of Financial Development Results
shows the 70-30 split of the dataset. It is clear from that financial development follows similar distribution in both the training and testing samples.
The distribution of financial development in as emphasized in (left) is left-skewed. Since skewed distributions can have adverse implications for regularization, financial development is normalized by taking alogarithmic transformation of the series. (right) shows that financial development is more symmetric and less heavy-tailed after the normalization.
Figure 3. Distribution of financial development at level (left) and its log-transformation (right).
Regularization Results on Drivers of Financial Development in Africa
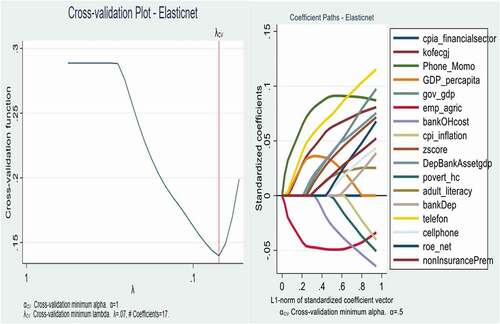
In this section, results on the first objective are presented. It is evident from , , , and that the lasso and Elasticnet algorithms select different tuning parameters but asimilar number of covariates (i.e., non-zero coefficients) as drivers of financial development. Interestingly, we find that the Standard lasso (, Adaptive lasso (
, and Elasticnet (
algorithms select the same number of covariates (17) as drivers of financial development in Africa. Amore parsimonious regularization is, however, found in the Minimum BIC lasso model, which selects 10 variables out of the 86 covariates. These key covariates are literacy, cell phones, economic growth, economic globalization, employment, inflation, government expenditure, Z-score, bank overhead cost, and institutional effectiveness [see and (right)]. For brevity, we present the cross-validation and coefficient path plots to show how the covariates enter/leave the four models.
Figure 4. Cross-validation plot (left) and coefficient path plot (right) for Standard lasso.
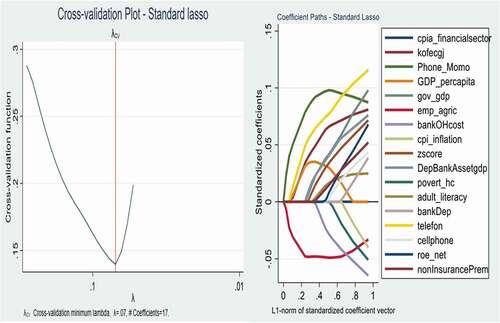
Figure 5. Cross-validation plot (left) and coefficient path plot (right) for Minimum BIC lasso.
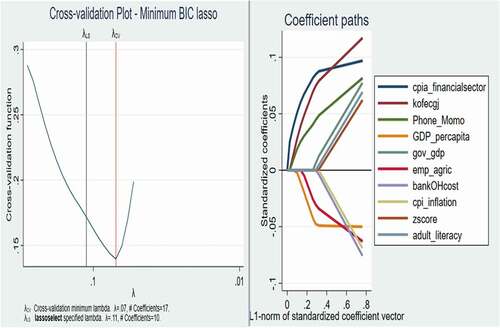
Figure 6. Cross-validation plot (left) and coefficient path plot (right) for Adaptive lasso.
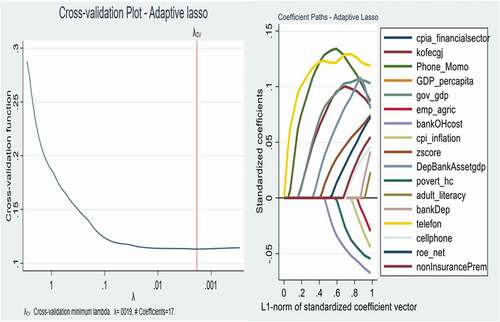
Figure 7. Cross-validation plot (left) and coefficient path plot (right) for Elasticnet.
Inferential Results on Drivers of Financial Development in Africa
Using the 10 key predictors of financial development as the variables of interest, we apply the DSL, POLR, and POIVLR estimation techniques to address Objective 2 of the study. The attendant estimates are presented in . We point out that we rely on the estimates in column 3 due to its added advantage of addressing the aforementioned endogeneity concern. Further, aside from the joint significance of the 10 predictors in explaining variations in financial development, the reliability of the results rests on the robustness of the POIVLR to heteroskedasticity and misspecification.
Table 1. Lasso estimates on the key drivers of financial development in Africa
We find strong empirical evidence that literacy matters for financial sector development in Africa. The result shows that a1% increase in literacy is associated with a boost in financial development by 0.02%. The significance of literacy (human capital) for financial development follows the proposition that the educated are more likely to invest and/or consume financial products and services. Additionally, as Boopen etal. (Citation2011), Kodila-Tedika and Asongu (Citation2015), and Elsherif (Citation2015) point out, the literates are most financially included and are more likely to comprehend financial sector reforms compared to their illiterate counterparts.
Also, we find that cell phones (ICT usage) is also statistically significant for promoting financial sector developmentFootnote19 in Africa. The rise in ICT diffusion has made cell phones aviable and youth-friendly channel for fostering financial development, especially, for capturing the financially excluded into the financial sector and achieving acashless system. Indeed, empirical evidence in Asongu etal. (Citation2019) and Asongu (Citation2013) show that cell phone penetration offers cheaper means of achieving financial inclusion, the consumption of financial services and products, and financial sector development. This result also amplifies the finding on literacy as the educated are more likely to use mobile phones and internet banking services. Our result provides optimism regarding the empirical evidence by Jacolin, Keneck Massil, and Noah (Citation2021) that mobile financial services reduce informality in the developing world.
Further, we find strong evidence that economic globalizationFootnote20 is crucial for Africa’s financial sector development. The magnitude of the coefficient indicates that for every 1% improvement in economic globalization there is asurge in financial development by 0.009%. This finding corroborates that of Aluko and Ibrahim (Citation2020) and Boopen et al. (Citation2011), who provide empirical support that opening up Africa to trade, investment, and capital flows can boost financial development. The concern with economic globalization, however, as Aluko and Ajayi (Citation2018), Mahawiya (Citation2015) and Asongu (Citation2012) argue is that it leaves the financial sector more susceptible to cybercrime, money laundering, Ponzi schemes, and global financial crisis spillover.
Also, we find strong empirical evidence that Africa’s financial sector grows by 0.017% for every 1% increase in government expenditure. Indeed, in the developing world, empirical contributions such as Filippidis and Katrakilidis (Citation2014) and Aluko and Ibrahim (2019) indicate that government expenditure can boost financial sector performance if the expenditure results in amore lubricated economy. However, excessive government borrowing from the financial system, which is ubiquitous in Africa can result in the crowding-out of private investment or inefficient resource allocation (Cooray Citation2011; Naceur, Cherif, and Kandil Citation2014). This means that government expenditure should enhance financial infrastructure, especially the development of payment system platforms and services; support for financial innovation; and the enhancement of information flow on consumersFootnote21 . Our results also suggest that the highly informal nature of Africa (proxied by agricultural sector employment) hinders financial sector development. Our finding is in line with that of Elgin and Uras (Citation2013). Indeed, in Africa, individuals employedFootnote22 in the agricultural sector are less likely to consume financial services and products continuously due to unsustainable income growth. Particularly, the vulnerabilities in economic activities can be abarrier to financial inclusion and more especially the utilization of financial market services and products.
The results also show that financial strength/stability (Z-score), which has amarginal effect of 0.01%, and financial institutions’ overhead cost ( are also germane for financial sector development. The significance of the former signifies that building arobust system for reducing risk, improving intra-firm information flow while breeding competition in the financial system could prove crucial. The latter, as Beck and Levine (Citation2005) and Marcelin and Mathur (Citation2014) argue, also signifies the relevance of prudent macroeconomic management and financial system supervision/regulation, which can ultimately lead to areduction in accounting fees, advertising fees, insurance fees, cost of borrowing, legal fees, rent, supplies, taxes, and utilities. In line with this finding is the statistically significant effect of institutional effectiveness for financial development. The result is remarkable (0.08). Considering the underdeveloped nature of Africa’s financial system, this finding signifies the need for the revision of prudential standards as well as improvement in on-site and off-site supervision is worthwhile. Additionally, the result suggests that a sound legal and regulatory framework for financial consumer protection as Cherif and Dreger (Citation2016) and Ayadi et al. (Citation2015) argue could prove crucial for boosting consumer confidence in the financial system.
Conclusion
The study employs machine learning techniques for identifying the key drivers of financial development in 42 African countries. Using a dataset containing 86 potential predictors of financial development for the period 1980–2019, we ran four machine learning regularization models – the standard lasso, the Minimum BIC lasso, the Adaptive lasso, and the Elasticnet – to show that literacy, cell phones, economic growth, economic globalization, employment (agriculture), inflation, government expenditure, Z-score, bank overhead cost, and institutional effectiveness are crucial for driving Africa’s financial sector development. Evidence from the lasso inferential estimation techniques also shows that, but for inflation and employment, all the selected covariates are statistically significant in driving Africa’s financial sector development. Our findings show that machine learning techniques can be applied to reduce data complexity and aid sound decision-making. In particular, the approach solves the problem of selection bias and inconclusive results by eliminating researcher discretion in the selection of variables in large data regression problems.
For policy, we recommend that strategic government expenditure, preferably one that supplements the private sector’s effort in human capital development, financial infrastructure, and economic growth, be enhanced to foster greater financial activity, inclusion, and development. Also, in line with the youthful nature of Africa’s population and the giant strides made by African countries in terms of technological progress, government intervention is required in reducing the cost of internet access while broadening telecommunication network access for the rural folks who are more likely to use mobile money services. Various governments should thus liaise with financial institutions, markets, and telecommunication service providers to make financial products and services accessible via mobile phones. Additionally, it is recommended that financial institutions and markets provide greater incentives, for example, through low charges or discounts for clients using cell phones for transactions. Finally, we recommend that regulation and supervision institutions be strengthened to enhance information flow, consumer protection, and confidence in the financial system considering the rise in the economic integration of Africa following the implementation of the Africa Continental Free Trade Area. This can be enhanced if international bodies such as the World Bank and African Development Bank support Africa’s monetary authorities to strengthen the secured transactions and collateral frameworks, and the insolvency regimes.
For the academic community, researchers can draw on our contribution to identify which variables matter for addressing poverty and inequality in Africa. This could prove crucial for making resources count considering the huge investment made by African governments and their development partners such as the World Bank and African Development Bank in their quest to alleviate poverty and income inequality. Additionally, considering the underdeveloped nature of the region’s financial market, researchers can follow our contribution to narrow the scope and inform policy as to which the key drivers of financial market development are. Also, following the implementation of the African Continental Free Trade Area agreement, other researchers can employ the techniques used in this study to inform policy as to which goods/products the African countries should produce to diversify export.
A conspicuous drawback to this study is that we do not consider all African countries on grounds of data limitation. For future research, this study could be executed at the regional level, for instance, in the West African Monetary Zone, to guide policy actions.
Acknowledgments
We are grateful to the editor and reviewers for their constructive comments/suggestions and the opportunity to revise the manuscript.
Disclosure Statement
No potential conflict of interest was reported by the author(s).
Notes
1. The RFFIS has been adopted by African countries such as Burundi, Ghana, Liberia, Nigeria, Tanzania, Cote, Sierra Leone, Niger, Mauritius, Mauritania, Swaziland, Madagascar, Zambia, and Zimbabwe.
2. For instance, variables such as the ratio of financial institutions’ assets to GDP, the ratio of liquid liabilities to GDP, and the ratio of deposits to GDP are often chosen as proxies/indicators for financial sector development (see, e.g., Adu, Marbuah, and Mensah Citation2013; Barajas etal. Citation2013; Mtar and Belazreg Citation2021).
3. The FD index provides comprehensive information on the degree of access, depth, efficiency, and stability of the financial institutions and markets of acountry’s financial sector 3 (see, Svirydzenka Citation2016).
4. Machine learning has gained attention in recent years due to its ability to detect relevant patterns in big data for prediction and analysis.
5. La Porta etal. (Citation1998) argue that common law countries provide stronger legal protection for investors than civil law countries.
6. Angola, Benin, Botswana, Burkina Faso, Burundi, Cabo Verde, Cameroon, Central African Republic, Chad, Comoros, Congo, D.R., Congo, Rep., Cote d’Ivoire, Ethiopia, Gabon, Gambia, The, Ghana, Guinea, Guinea-Bissau, Kenya, Lesotho, Liberia, Madagascar, Malawi, Mali, Mauritania, Mauritius, Mozambique, Namibia, Niger, Nigeria, Rwanda, Sao Tome and Principe, Senegal, Seychelles, Sierra Leone, South Africa, Sudan, Tanzania, Togo, Uganda, Zambia.
7. Inefficiency due to model complexity, specification problems and/or overfitting. Further, the traditional least-squares estimator is not only less sparse but also more susceptible and sensitive to problems like multicollinearity and outliers.
8. Since the ordinary least-squares technique and Ridge regression cannot yield variable selection, their estimations are relaxed.
9. That is no variable is shrank to zero.
10. This adds to the regular penalty.
11. A situation where covariates are selected when aresearcher determines the value of λ.
12. In this study, we invoke the 10-fold cross-validation.
13. Traditional estimation techniques such as the OLS cannot be employed either as the new variability introduced in the dataset by the regularization techniques are not captured by such techniques.
14. We include 56 out of the remaining 106 covariates as control against the backdrop that several alternative measures of globalization, institutional quality, and welfare are used.
15. List of instruments in POIVLR: transparency score, trade score, public management score, macroeconomic management score, gender equality score, financial sector management score, internet access (per million of the population), mobile cellular subscription (per 100 of the population), fixed telephone subscription (per 100 of the population), fixed broadband subscription (per 100 of the population).
16. These are data on net migration, and country policy and institutional scores for macroeconomic management, public administration, and financial sector management.
17. That is the distribution of financial development in the training and testing sets.
18. See Appendices section.
19. The internet, can, in this case, be agood medium to offer the public a broad range of affordable and quality financial products, services.
20. Economic globalization comprises tariff, foreign direct investment, trade openness, and capital flows across borders.
21. Tightening the national identification system.
22. Even the few who are financially included are more likely to default on loans plausible due to vulnerabilities in employment.
References
- Acemoglu,D., S.Johnson, and J.A. Robinson. 2001. The colonial origins of comparative development: An empirical investigation. American Economic Review 91(5):1369–401. doi:https://doi.org/10.1257/aer.91.5.1369.
- Adu,G., G.Marbuah, and J. T. Mensah. 2013. Financial development and economic growth in Ghana: Does the measure of financial development matter? Review of Development Finance 3(4):192–203. doi:https://doi.org/10.1016/j.rdf.2013.11.001.
- Aggarwal,R., A.Demirgu ̈ç-kunt, and M. S. M. Pería. 2011. Do remittances promote financial development. Journal of Development Economics 96 (2):255–64. doi:https://doi.org/10.1016/j.jdeveco.2010.10.005.
- Akinlo,A.E., and T.Egbetunde. 2010. Financial development and economic growth: The experience of 10 sub-Saharan African countries revisited. The Review of Finance and Banking 2:1.
- Almarzoqi,R., M.S. B. Naceur, and A.Kotak 2015. What matters for financial development and stability? (No.15-173). International Monetary Fund.
- Aluko,O. A., & Ibrahim, M. (2020). On the macroeconomic determinants of financial nstitutions development in sub-Saharan Africa. International Review of Economics, 67(1), 69–85.
- Aluko, O. A., and M.A. Ajayi. 2018. Determinants of banking sector development: Evidence from Sub-Saharan African countries. Borsa Istanbul Review 18(2):122–39. doi:https://doi.org/10.1016/j.bir.2017.11.002.
- Arcand,J., E.Berkes, and U.Panizza 2015. Too much finance? IMF Working paper WP/12/161. International Monetary Fund.
- Asongu, S. A. (2012). Bank efficiency and openness in Africa: Do income levels matter? The Review of Finance and Banking, 4(2), 115–122
- Asongu, S. A. (2013). How has mobile phone penetration stimulated financial development in Africa? Journal of African Business, 14(1), 7–18.
- Asongu, S. A., & Odhiambo, N. M. (2019). Mobile banking usage, quality of growth, inequality and poverty in developing countries. Information Development, 35(2), 303–318.
- Ayadi, R., Arbak, E., Naceur, S. B., & De Groen, W. P. (2015). Determinants of financial development across the Mediterranean. In Economic and Social Development of the Southern and Eastern Mediterranean Countries (159–181). Springer.
- Baltagi,B. H., P.O. Demetriades, and S.H. Law. 2009. Financial development and openness: Evidence from panel data. Journal of Development Economics 89(2):285–96. doi:https://doi.org/10.1016/j.jdeveco.2008.06.006.
- Barajas,M. A., T. Beck, M.E. Dabla-Norris, and M. R. Yousefi. 2013. Too cold, too hot, or just right? Assessing financial sector development across the globe. In International Monetary Fund Working Paper 2013 081 (International Monetary Fund)30, 9781484351086. https://doi.org/https://doi.org/10.5089/9781484351086.001 .
- Beck,T., A. Demirgu ̈ç-kunt, and R.Levine. 2003. Law, endowments and finance. Journal of Financial Economics 70(2):137–81. doi:https://doi.org/10.1016/S0304-405X(03)00144-2.
- Beck, T., and R. Levine. 2005 Legal Institutions and Financial Development Handbook of New Institutional Economics Menard, C., and Shirley, M. M. , 251–278. Boston, MA: Springer, Boston, MA.
- Beck, T. 2012. The role of finance in economic development–benefits, risks, and politics. In Oxford Handbook of Capitalism 2011-141, CentER Discussion Paper , 161–203.
- Belloni,A., Chernozhukov, V., & Hansen, C. (2014). High-dimensional methods and inference on structural and treatment effects. Journal of Economic Perspectives, 28(2), 29–50.
- Belloni, A., D.Chen, V.Chernozhukov, and C.Hansen. 2012. Sparse models and methods for optimal instruments with an application to eminent domain. Econometrica 80(6), 2369–2429 https://doi.org/https://doi.org/10.3982/ECTA9626).
- Belloni, A., and V.Chernozhukov. 2013. Least squares after model selection in high-dimensional sparse models. Bernoulli 19(2):521–47. doi:https://doi.org/10.3150/11-BEJ410.
- Belloni, A., V. Chernozhukov, and Y.Wei. 2016. Post-selection inference for generalized linear models with many controls. Journal of Business & Economic Statistics 34(4):606–19. doi:https://doi.org/10.1080/07350015.2016.1166116.
- Bittencourt, M. (2011). Inflation and financial development: Evidence from Brazil. Economic Modelling, 28(1–2), 91–99.
- Boopen,S., Kesseven, P., Jashveer, H., & Binesh, S. (2011). Determinants of financial development: The case of Mauritius Governance Conference Finance and Corporate.
- Boopen, S., P.Kesseven, H.Jashveer, and S.Binesh 2011. Determinants of financial development: The case of Mauritius. Finance and Corporate Governance Conference 28 - 29, April 2011 , Melbourne,RACV Club, Australia.
- Boyd,J. H., R.Levine, and B.D. Smith. 2001. The impact of inflation on financial sector performance. Journal of Monetary Economics 47(2):221–48. doi:https://doi.org/10.1016/S0304-3932(01)00049-6.
- Chao,X., G. Kou, Y.Peng, and E.H. Viedma. 2021. Large-scale group decision-making with non-cooperative behaviors and heterogeneous preferences: An application in financial inclusion. European Journal of Operational Research 288(1):271–93. doi:https://doi.org/10.1016/j.ejor.2020.05.047.
- Cherif,M., and C. Dreger. 2016. Institutional determinants of financial development in MENA countries. Review of Development Economics 20(3):670–80. doi:https://doi.org/10.1111/rode.12192.
- Chernozhukov,V., C.Hansen, and M.Spindler. 2015a. Valid Post-Selection and Post-Regularization Inference: An Elementary. General Approach. Annual Review of Economics 7(1):649–88. doi:https://doi.org/10.1146/annurev-economics-012315-015826.
- Chernozhukov, V., C. Hansen, and M. Spindler. 2015b. Post-selection and post-regularization inference in linear models with many controls and instruments. American Economic Review 105(5):486–90. doi:https://doi.org/10.1257/aer.p20151022.
- Čihák,M., A. Demirgüč-Kunt, E. Feyen, and R.Levine 2013. Financial development in 205 economies, 1960 to 2010 (No. w18946). National Bureau of Economic Research.
- Cooray,A. 2011. The role of the government in financial sector development. Economic Modelling 28(3):928–38. doi:https://doi.org/10.1016/j.econmod.2010.11.001.
- Demirgüç-Kunt, A., L.Klapper, D. Singer, S. Ansar, and J.Hess. 2018. The global findex database 2017: Measuring financial inclusion and the fintech revolution. Washington, DC: World Bank.
- Djankov,S., C. McLiesh, and A. Shleifer. 2007. Private credit in 129 countries. Journal of Financial Economics 84(2):299–329. doi:https://doi.org/10.1016/j.jfineco.2006.03.004.
- Elgin,C., and B.R. Uras 2013. Is informality a barrier to financial development? SERIEs 4, 309–31
- Elsherif,M. A. 2015. The determinants of financial development: Empirical evidence from Egypt. The Macrotheme Review 4(3):69–87.
- Filippidis,I., and C. Katrakilidis. 2014. Institutions, policy and banking sector development: A reassessment. Finance a Uver 64 (6):501.
- Fowowe,B. 2014. Law and finance revisited: Evidence from African countries. South African Journal of Economics 82(2):193–208. doi:https://doi.org/10.1111/saje.12020.
- Gygli,S., F.Haelg, N.Potrafke, and J. E. Sturm. 2019. The KOF Globalisation Index–Revisited. Review of International Organizations 14(3):543–74. doi:https://doi.org/10.1007/s11558-019-09344-2.
- Hastie,T., R. Tibshirani, and M. Wainwright. 2019. Statistical learning with sparsity: The lasso and generalizations. New York: Chapman and Hall/CRC.
- Huybens,E., and B. D. Smith. 1999. Inflation, financial markets and long-run real activity. Journal of Monetary Economics 43(2):283–315. doi:https://doi.org/10.1016/S0304-3932(98)00060-9.
- Ibrahim,M., and Y.A. Sare. 2018. Determinants of financial development in Africa: How robust is the interactive effect of trade openness and human capital? Economic Analysis and Policy 60:18–26. doi:https://doi.org/10.1016/j.eap.2018.09.002.
- Jacolin,L., J.Keneck Massil, and A. Noah. 2021. Informal sector and mobile financial services in emerging and developing countries: Does financial innovation matter? World Economy 00:1–35. doi:https://doi.org/10.1111/twec.13093.
- James,G., D. Witten, T. Hastie, and R. Tibshirani. 2013. Linear model selection and regularization. In An introduction to statistical learning Casella, G, Fienberg, S, and Olkin, I, 203–64. New York, NY: Springer.
- Jedidia,K. B., T.Boujelbène, and K.Helali. 2014. Financial development and economic growth: New evidence from Tunisia. Journal of Policy Modeling 36(5):883–98. doi:https://doi.org/10.1016/j.jpolmod.2014.08.002.
- Khalfaoui, H. (2015). The determinants of financial development: Empirical evidence from developed and developing countries. Applied Economics and Finance, 2(4), 1–9.
- Kim,D. H., and S.C. Lin. 2010. Dynamic relationship between inflation and financial development. Macroeconomic Dynamics 14(3):343–64. doi:https://doi.org/10.1017/S1365100509090312.
- Kodila-Tedika, O., and S.A. Asongu. 2015. The effect of intelligence on financial development: A cross-country comparison. Intelligence 51:1–9. doi:https://doi.org/10.1016/j.intell.2015.04.010.
- Kou,G., Y. Peng, and G.Wang. 2014. Evaluation of clustering algorithms for financial risk analysis using MCDM methods. Information Sciences 275:1–12. doi:https://doi.org/10.1016/j.ins.2014.02.137.
- Kou, G., Y. Xu, Y. Peng, F. Shen, Y. Chen, K.Chang, and S. Kou. 2021. Bankruptcy prediction for SMEs using transactional data and two-stage multiobjective feature selection. Decision Support Systems 140:113429. doi:https://doi.org/10.1016/j.dss.2020.113429.
- La Porta,R., F. Lopez-de-silanes, A. Shleifer, and R.W. Vishny. 1998. Law and finance. Journal of Political Economy 106(6):1113–55. doi:https://doi.org/10.1086/250042.
- Lahoti,R., A. Jayadev, and S. Reddy. 2016. The global consumption and income project (GCIP): An overview. Journal of Globalization and Development 7(1):61–108. doi:https://doi.org/10.1515/jgd-2016-0025.
- Law,S. H., and N.Singh. 2014. Does too much finance harm economic growth? Journal of Banking & Finance 41:36–44. doi:https://doi.org/10.1016/j.jbankfin.2013.12.020.
- Madsen,J. B., M. R. Islam, and H.Doucouliagos. 2018. Inequality, financial development and economic growth in the OECD, 1870–2011. European Economic Review 101:605–24. doi:https://doi.org/10.1016/j.euroecorev.2017.11.004.
- Mahawiya,S. 2015. Financial sector development, inflation and openness: Acomparative panel study of ECOWAS and SADC. Economic Research Southern Africa Working Paper (No. 528):1–37.
- Marcelin,I., and I.Mathur. 2014. Financial development, institutions and banks. International Review of Financial Analysis 31:25–33. doi:https://doi.org/10.1016/j.irfa.2013.09.003.
- Mateen,B. A., J. Liley, A. K. Denniston, C.C. Holmes, and S. J. Vollmer. 2020. Improving the quality of machine learning in health applications and clinical research. Nature Machine Intelligence 2(10):554–56. doi:https://doi.org/10.1038/s42256-020-00239-1.
- McKinnon,R. I. 1973. Money and capital in economic development. Washmgton, DC: Brookmgs Instttutton.
- Mtar,K., and W.Belazreg. 2021. Causal Nexus between innovation, financial development, and economic growth: The case of OECD countries. Journal of the Knowledge Economy, 12(1), 310–341.
- Naceur,S. B., M.Cherif, and M. Kandil. 2014. What drives the development of the MENA financial sector? Borsa Istanbul Review 14(4):212–23. doi:https://doi.org/10.1016/j.bir.2014.09.002.
- Naqvi, T., Waheed, A., Mahmood, H., & Rafique, M. (2017). Impact of Political Instability on Financial Development of Pakistan. International Journal of Management Sciences and Business Research, 6(4), 1- 13
- Nguyen,C. P., T.D. Su, and N. Doytch. 2020. The drivers of financial development: Global evidence from internet and mobile usage. Information Economics and Policy 53:100892. doi:https://doi.org/10.1016/j.infoecopol.2020.100892.
- Ofori,I. K., and S. A. Asongu. 2021. ICT diffusion, foreign direct investment and inclusive growth in Sub-Saharan Africa. Telematics and Informatics 65:101718. doi:https://doi.org/10.1016/j.tele.2021.101718.
- Padachi, K., Rojid, S., & Seetanah, B. (2008). Investigating into the factors that influence theadoption of internet banking in Mauritius. Journal of Internet Business, (5), 98– 120.
- Pan,R., T. Yang, J. Cao, K. Lu, and Z.Zhang. 2015. Missing data imputation by Knearest neighbours based on grey relational structure and mutual information. Applied Intelligence 43(3):614–32. doi:https://doi.org/10.1007/s10489-015-0666-x.
- Peprah,J. A., I.K. Ofori, and A. N. Asomani . 2019. Financial development, remittances and economic growth: A threshold analysis. Cogent Economics & Finance 7 (1):1625107. doi:https://doi.org/10.1080/23322039.2019.1625107.
- Raza, S. H., Shahzadi, H., & Akram, M. (2014). Exploring the determinants of financial development (using panel data on developed and developing countries). Journal of Finance and Economics, 2(5), 166–172.
- Ribeiro-Navarrete, S., J.R. Saura, and D.Palacios-Marqués. 2021. Towards a new era of mass data collection: Assessing pandemic surveillance technologies to preserve user privacy. Technological Forecasting and Social Change 167:120681. doi:https://doi.org/10.1016/j.techfore.2021.120681.
- Robinson,J. C. 1979. The generalization of the general theory. In The Generalisation of the General Theory and other Essays. 1-76. London: Palgrave Macmillan
- Rousseau, P. L., and P. Wachtel. 2002. Inflation thresholds and the finance-growth nexus. Journal of International Money and Finance 21 (6):777–95. doi:https://doi.org/10.1016/S0261-5606(02)00022-0.
- Sandeep, S., C.R. Shelton, A. Pahor, S. M. Jaeggi, and A. R. Seitz. 2020. Application of machine learning models for tracking participant skills in cognitive training. Frontiers in Psychology 11:15–32. doi:https://doi.org/10.3389/fpsyg.2020.01532.
- Sanusi, K. A., Meyer, D., & Ślusarczyk, B. (2017). The relationship between changes in inflation and financial development. Polish Journal of Management Studies, 16(2), 253–265.
- Saura,J. R., D. Ribeiro-Soriano, and D. Palacios-Marqués. 2021. From user-generated data to data-driven innovation: A research agenda to understand user privacy in digital markets. International Journal of Information Management 60:102331. doi:https://doi.org/10.1016/j.ijinfomgt.2021.102331.
- Saura, J. R. 2021. Using data sciences in digital marketing: Framework, methods, and performance metrics. Journal of Innovation & Knowledge 6 (2):92–102. doi:https://doi.org/10.1016/j.jik.2020.08.001.
- Schneider, U., & Wagner, M. (2012). Catching growth determinants with the adaptive lasso. German Economic Review, 13(1), 71–85.
- Schwarz, G. 1978. Estimating the dimension of a model. Annals of Statistics 6 (2):461–64. doi:https://doi.org/10.1214/aos/1176344136.
- Shabbir, B., Jamil, L., Bashir, S., Aslam, N., & Hussain, M. (2018). Determinants of Financial Development. A Case Study Of Pakistan A Case Study of Pakistan. https://doi.org/http://dx.doi.org/10.2139/ssrn.3122911
- Shaw, E. S. 1973. Financial deepening and economic development. New York: Oxford University Press.
- Svirydzenka, K. 2016. Introducing a new broad-based index of financial development. IMF Working Paper No. 16/5.
- Tibshirani,R. J., and J. Taylor. 2012. Degrees of freedom in lasso problems. The Annals of Statistics 40 (2):1198–232. doi:https://doi.org/10.1214/12-AOS1003.
- Tibshirani, R. 1996. Regression shrinkage and selection via the lasso. Journal of the Royal Statistical Society: Series B(Methodological) 58(1):267–88.
- Tizghadam, A., H. Khazaei, M. H. Moghaddam, and Y. Hassan. 2019. Machine learning in transportation. Journal of Advanced Transportation 2019:1–3. Special Issue. doi:https://doi.org/10.1155/2019/4359785.
- Van Hulse, J., and T.M. Khoshgoftaar. 2014. Incomplete-case nearest neighbor imputation in software measurement data. Information Sciences 259:596–610. doi:https://doi.org/10.1016/j.ins.2010.12.017.
- Voghouei, H., Azali, M., & Jamali, M. A. (2011). A survey of the determinants of financial development. Asian-Pacific Economic Literature, 25(2), 1–20.
- World Bank. 2018. Developing and operationalizing a national financial inclusion strategy: Toolkit. Washington, DC: World Bank, 1- 68 .
- World Bank. 2019. Global financial development report 2019/2020: Bank regulation and supervision a decade after the global financial crisis. Washington, DC: World Bank.
- World Bank. 2020. World Development Indicators. Washington, DC: World Bank.
- Zou,H., and T. Hastie. 2005. Regularization and variable selection via the elastic net. Journal of the Royal Statistical Society: Series B (Statistical Methodology) 67 (2):301–20. doi:https://doi.org/10.1111/j.1467-9868.2005.00503.x.
- Zou, H., T. Hastie, and R. Tibshirani. 2007. On the “degrees of freedom” of the lasso. The Annals of Statistics 35 (5):2173–92. doi:https://doi.org/10.1214/009053607000000127.
- Zou, H.; World Bank. 2006. The adaptive lasso and its oracle properties. Journal of the American Statistical Association 101 (476):1418–29. doi:https://doi.org/10.1198/016214506000000735.
Appendices
Table A1. Variable definition and data sources
Table A2. Summary statistics for training and testing sets
Table A3. Variable selection in regularization models
Figure A1. Overview of the dataset before data engineering.Source: Author’s construct (2021).
Figure A2. Overview of the dataset after data engineering.Source: Author’s construct (2021).