
ABSTRACT
Disruptive events within a country can have global repercussions, creating a need for the anticipation and planning of these events. Crystal Cube (CC) is a novel approach to forecasting disruptive political events at least one month into the future. The system uses a recurrent neural network and a novel measure of event similarity between past and current events. We also introduce the innovative Thermometer of Irregular Leadership Change (ILC). We present an evaluation of CC in predicting ILC for 167 countries and show promising results in forecasting events one to twelve months in advance. We compare CC results with results using a random forest as well as previous work.
Introduction
Disruptive events across the globe present significant challenges to population health and welfare. These events, including major protests, riots, military actions and irregular leadership changes, can present short and long term challenges to the missions of domestic and foreign governments and non-governmental organizations. Contingency planning for these types of events is often a requirement for operating in high-risk environments. Yet maintaining these plans in a constant state of readiness is expensive and challenging and even the best plans often cannot address these types of disruptive events when they occur. Furthermore, new global threats have increased instability in many parts of the world, posing new challenges to many functions of governments, such as policy development, escalation management, resource allocation and crisis response.
For these reasons, there has been a significant amount of research dedicated to the forecasting of major disruptive events. For example, the 2005 US National Defense Strategy (Department of Defense Citation2005) acknowledged that it is easier to prepare for, influence and respond to disruptive events in their earliest stages when they are less threatening and more manageable. The identification of global hotspots before they develop can lead to a more efficient allocation of resources and better planning to address the consequences of an event.
For these reasons, there has been a long-standing investment in training and personnel resources to analyze populations and governments in the hopes of understanding antecedents and factors that could forecast a disruptive event. Traditionally, a limited amount of data and the complex nature of the problem meant that the forecasting task was reserved for the domain of human experts. However, in recent decades there has been an explosion of data available on countries, populations and governments. This wealth of data coupled with advances in machine learning systems has led to an interest in automated systems that could forecast disruptive events.
This view has spurred investment in several programs to develop early warning systems for global crises. For example, the recent Intelligence Advanced Research Projects Activity (IARPA) funded project on Early Model Based Event Recognition using Surrogates (EMBERS) explored the use of social media data and machine learning systems to forecast civil unrest (Muthiah et al. Citation2016). Earlier work on the Integrated Crises Early Warning System (ICEWS) created a coded event database and five categories of disruptive events (Lustick et al. Citation2015). These and related projects have established the demand and potential for automated forecasting systems for globally disruptive events.
While promising, there remain unanswered questions about forecasting these types of events. Previous work has focused on forecasting relatively stable event types, meaning that within a given country the events happen with some regularity. For example, ICEWS predicted the category of ethnic/religious violence, an event type that, when it happened, often happened with regularity. For example, in Nigeria or Kenya ethnic/religious violence happened every month from 2001 to 2014 – the years for which ICEWS has data. Events that happen with regularity are much easier to forecast than rare events. Additionally, the models considered in these systems were quite limited (Lustick et al. Citation2015; Muthiah et al. Citation2016) and, in contrast to modern deep learning models, they did not integrate diverse or large number of features but instead relied on a small number of hand-picked features.
In this work we consider the forecasting of irregular leadership changes (ILCs), defined as an unexpected change in the leadership of the government of a country. ILCs are among the most difficult events to forecast because they are very rare and the multitude of factors involved can be hard to synthesize into a prediction of an event. Yet they are among the most important to correctly forecast. ILCs can create political and social upheaval outside the normal bounds of legal, peaceful, fair or customary transitions of power. They can further be accompanied by sociopolitical discontent, mass protest, crackdowns on dissent, lack of judicial independence, violence, armed conflict and other forms of instability.
Toward this goal we developed Crystal Cube, a deep learning-based system for the forecasting of ILCs. Our goal is to make predictions sufficiently in advance (at least one month) to allow policy makers time to prepare a response. Crystal Cube utilizes a recurrent neural network (RNN) to model the temporal nature of this task. In addition to integrating a wide range of features into our forecasting system, we propose a feature that is based on a new event similarity measure, allowing the system to compare developing situations to relevant historical events.
In addition to our new method, we expand the task of ILC forecasting beyond a binary task (did an event happen or not) to a more nuanced task in which we incorporate a measure of the significance of the event into our evaluation. We use the ARCHIGOS dataset (Goemans, Gleditsch, and Chiozza Citation2009) which tracks geopolitical state leadership changes and how the transition occurred. We augment this dataset by scoring each change according to the significance of the transition: the ILC thermometer. We based this measure on foundational theories of coalition collapse, impeachment, demonstrations, mass movements, violent rebellion and coups. We use this new dataset to forecast ILCs around the world. We compare our forecasting system to a random baseline, a random forest and the work of (Beger, Dorff, and Ward Citation2016; Ward and Beger 2017), finding that our system achieves better results.
The main contributions of our work are: 1) the development of a new system based on recurrent neural networks to predict ILCs; 2) the use of a new event similarity metric that compares developing events with historical events; 3) the framing of the task as non-binary prediction based the significance of the ILC (Thermometer of Disruptive Events).
The rest of this paper is organized as follows: in the next section we provide a review of existing approaches to disruptive event forecasting, then we describe the methodology we developed. We close with results, conclusions and future work.
Review: Geopolitical Disruptive Event Forecasting
Forecasting geopolitical conflicts has long been considered unfeasible. Major disruptive political events such as the collapse of the Soviet Union, the Arab Spring and the related overthrow of leaders in Egypt, Libya and Tunisia, etc., were not forecast before they happened (Stevens Citation2012). Attempts to forecast armed conflicts began in the 1980s with game-theoretical models developed by Bueno de Mesquita (Citation1980, Citation1983, Citation1984). From the late 1980s Schrodt (Citation1988, Citation1991) has been building statistical and later shallow neural network models to predict interstate security conflicts. The neural network forecasts achieved similar accuracy to logit models on randomly chosen test sets (the random division of data into training and test sets meant that future events could be part of the training data). Beginning in the late 2000s, conflict prediction became an active subdiscipline of conflict research.
Facilitated by the advances in computationally intensive methods to gather and analyze data, researchers gradually followed Schrodt in using automated event coded data from news to study how public opinion affects different conflicts around the world (Brandt, Colaresi, and Freeman Citation2008). Many forecasting methods used data at a granular level (days, weeks or months) to predict conflict in the short term. Other studies used country-year data to forecast (e.g., civil conflict) decades into the future (Hegre et al. Citation2013, Citation2016, Citation2017, Citation2019).
Geopolitical forecasting includes a wide body of literature related to the Integrated Crises Early Warning System (ICEWS) (Lustick et al. Citation2015). ICEWS includes both a coded event database and five “prediction” categories of disruptive events: domestic political crisis, insurgency, international crisis, rebellion and ethnic/religious violence. The event types predicted by ICEWS are often relatively stable for a given country (e.g., when there was ethnic/religious violence in Nigeria or Kenya, it happened every month from 2001 to 2014 – the years for which ICEWS ground truth is available). Because the categories are relatively stable, it is much easier to predict them than ILCs that are rare and have spikes.
Several prediction approaches have been applied to the ICEWS prediction categories. Montgomery, Hollenbach, and Ward (Citation2012) used ensemble Bayesian model averaging (EBMA) to fuse the forecasts of multiple classifiers. Arva et al. (Citation2013) compared the performance of classification models using inputs derived from the ICEWS event database against another coded event database called the Global Database of Events, Language and Tone (GDELT). They found that the inputs derived from GDELT provided as good or better performance than those from ICEWS. They additionally found that a combination of macro-structural variables and a subset of coded-event variables selected through a Bayesian model averaging approach, as opposed to all of the available input variables, was sufficient for accurate prediction. Neither of these studies considered sequential prediction models and few of these methods have been extended to ILC prediction.
Another approach for predicting disruptive events is Early Model Based Event Recognition using Surrogates (EMBERS) (Muthiah et al. Citation2016). EMBERS gives high-resolution predictions of civil unrest (e.g., mass protests) by fusing information from social media and other open source domains. EMBERS can often find specific dates, locations and actors for events before they are reported in the news. This approach is highly reliant on a planned protest model that requires public announcements of intent to protest by civil leaders and organizers. The system looks for precursor signals in social media and uses them to drive statistical and machine learning algorithms that generate predictions (Beger, Dorff, and Ward Citation2016). It is not clear how this method would extend to ILCs since they are not planned in the same way as protests.
Qiao et al. (Citation2017) developed a hidden Markov model (HMM) approach for predicting a custom truth category of social unrest events that they derived by looking for spikes of activity in the GDELT event database. An HMM is a sequential model but it typically does worse for classification tasks than discriminative methods (Lafferty, McCallum, and Pereira Citation2001) and recurrent neural networks (RNNs), especially with the modern architectures (gated recurrent units (GRU) and Long-Short Term Memory (LSTM)) that we consider here.
Beger, Dorff, and Ward (Citation2016) may have been the first to develop a forecasting model for ILC. They rely directly on the ILC definition in ARCHIGOS (Goemans, Gleditsch, and Chiozza Citation2009) and use the ARCHIGOS database to train and test their prediction models. Their approach is an ensemble-based, split-population duration model where each member of the ensemble encompasses a “theme” that relates to ILC (e.g., public discontent or leadership characteristics). Each thematic model is a split-population duration regression that can be thought of as consisting of two components: a probability estimate of a country belonging to either an ”at-risk of failure” class vs. ”not at-risk of failure” and then a regression conditional on this first estimate. They separate countries into two groups: at-risk, and practically immune to ILC. Features for each group were hand-selected from three different types of data sources: macro-structural (e.g., GDP per capita), ICEWS coded events and spatial variables for neighboring countries. Monthly forecasts were computed for the next month.
Ward and Beger (2017) present six-month forecasts of the probability of ILC for most countries in the world. The forecasts are derived from a statistical ensemble of seven thematic models, each based on a split population duration model that aims to capture a specific set of covariates. The models for countries where the risk of an irregular turnover is low (e.g., New Zealand) are separate from models for countries in which the risk of irregular turnover is high (e.g., Ukraine). Those split population models are combined by ensemble approaches.
Parrish et al. (Citation2018) developed several methods for prediction of the ICEWS categories. They evaluated logistic regression models, linear and radial basis function support vector machines, random forests and RNNs with GRU units. The results showed that GRUs and random forests gave the best performance. An in-depth history of forecasting in peace research that includes most developments until 2017 is described in Hegre et al. (Hegre, et al., Citation2017).
In this paper we use RNNs with LSTM units (which we found superior to GRUs) for forecasting ILC events with a novel ILC thermometer that we developed. We compare the results obtained by our method with those of Beger, Dorff, and Ward (Citation2016) and Ward and Beger (2017). We also show Crystal Cube results for a larger set of ILCs that occurred until the end of 2020 and compare the results with those obtained using random forests.
Methodology
Thermometer of Irregular Leadership Change
The ARCHIGOS dataset (Goemans, Gleditsch, and Chiozza Citation2009) tracks geopolitical state leaders around the world and assigns binary categories for the manner in which they leave office: regular or irregular. However, this binary definition of ILC does not adequately represent real events: resigning under pressure from mass protests is not the same as being ousted in a military coup d’état. To address these gradations, we developed an ILC thermometer based on foundational theories of coalition collapse, impeachment, demonstrations, mass movements, violent rebellion and coups. The ILC thermometer assigns ordinal scores between 0 and 1 in 0.2 increments, indicating the level of severity. The scores are defined as follows.
Customary (0.0): As defined in ARCHIGOS, regular leadership change is in accordance with the “prevailing rules, provisions, conventions and norms of the country” (Goemans, Gleditsch, and Chiozza Citation2009). In democracies, leadership change is decided by elections or term limits. Elections should be recognized as free and fair and not face contestation from society or political leaders. Other political systems also have processes for regular leadership change; for example, monarchies may make succession decisions based on the norms of power distribution or consensus within the ruling family (Herb Citation1999). President Barack Obama’s leaving office in 2016 due to term limits illustrates regular democratic leadership change. In Saudi Arabia, King Salman’s reign after the natural death of King Abdullah in 2015 is an example of customary leadership change in a monarchy.
Dissent (0.2): Several studies have looked at the importance of ruling parties implementing promised polices, theories on coalition bargaining and durability, implications of power-sharing in coalitions and the role of motions of confidence in coalition cohesion (Diermeier and Feddersen Citation1998; Laver and Schofield Citation1990; Thomson et al. Citation2017). Political coalitions that experience failures in these areas of governance and neglect to fulfill campaign pledges, govern effectively or maintain cohesive support may suffer from intra-party/intra-coalition disputes. Even when all relevant laws are followed, such as the procedure for holding a vote of no confidence to remove a leader, the leadership change takes place outside of the typical process and challenges the status quo. Occurrences of leadership change under dissent include British PM David Cameron’s 2016 resignation amid the Brexit vote turmoil.
Demonstration (0.4): Social movement theory addresses the motivations and political implications of social mobilization and demonstration. Protest and mass demonstration can emerge from a threat or opportunity that incentivizes a new group to challenge the ruling group (McAdam Citation1982). Tilly (Citation2002) argues that identity can also serve as an impetus for major political movements, transitions and transformations. Eckstein (Citation1989) focuses on nonviolent protest movements in Latin America, such as noncompliance, strikes and demonstration. An example of this type of leadership change is President Richard Nixon’s resignation under intense pressure from the Watergate investigation and undergoing impeachment process.
Duress (0.6): As part of social movement theory that approaches violent protest and rebellion, Gurr (Citation1970) examines the roles of deprivation, social environments and institutions in instigating rebellion. Mass movements, protests and demonstrations on the cusp of violence fall under the duress classification. Impeachment to remove a leader is also a powerful form of protest against leadership that can provide “mechanisms to solve disputes,” often in the face of corruption or mass mobilizations, short of resorting to military action (Perez-Linan Citation2007). Leadership change under duress is exemplified by Hosni Mubarak’s resignation during the Arab Spring in Egypt amid mass protests that saw crackdowns from government security forces.
Disintegration (0.8): Gurr (Citation1970) looks at the specific social and institutional (including opposition party) conditions that could open opportunities for political violence. Della Porta (Citation1995) considers the emergence of violence in certain social movements and the interactions between government security forces and protestors. Della Porta (Citation2013) distinguishes between low-level violence that is targeted against objects – which corresponds to our duress category – and the escalation to high-level violence against humans. Disintegration occurred with President Didier Ratsiraka’s disputed election loss to Marc Ravalomanana in Madagascar in 2002, which led to violent clashes between split factions across the country.
Catastrophic (1.0): Catastrophic leadership change is exemplified by coups d’état and assassination of leaders domestically or by foreign intervention, such as in the case of an invasion that overthrows the government (Goemans, Gleditsch, and Chiozza Citation2009). An example of catastrophic leadership change is the coup that ousted Zimbabwe’s President Robert Mugabe in 2017.
We integrated existing ARCHIGOS data with new data from the Rulers, Elections, and Irregular Governance (REIGN) dataset (Bell Citation2016), a dataset that currently tracks leadership change monthly (but does not assign regular/irregular labels). Finally, we coded each event with the new ILC thermometer levels for every change in leadership that has occurred from January 2001 to December 2020.
System Architecture
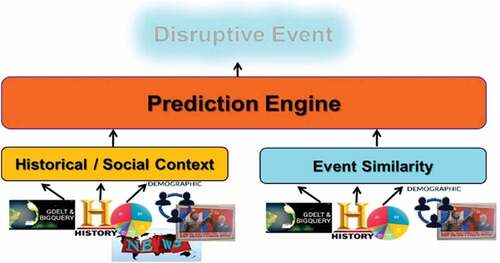
shows Crystal Cube’s high level system architecture. The predictive capability that we developed requires methods for data fusion and prediction which reside in the prediction engine. It also requires appropriate analytics to characterize historical and social context and event similarity. Historical and social context derives features from historical and socioeconomic data, such as data coming from the World Bank. Event similarity is a novel measure of correlation between historical and current events.
Figure 1. Architecture of the Crystal Cube event forecasting system.
Historical/Social Context Data
Global Database of Events, Language and Tone
GDELT (Leetaru Citation2017) is our source for coded event data. It aims to document human society in an automatic fashion. GDELT uses a natural language processing system to code streams of contemporary news articles with geopolitical event types. It covers all countries in the world and has real-time translation to English from at least 65 languages. Results are stored in an open database every fifteen minutes. Each row in GDELT represents an event record and includes information about the time the event occurred, the place where it happened and which actors were involved. To provide meaningful information about the nature of events, GDELT assigns a code to each event using the Conflict and Mediation Event Observations Event and Actor Codebook (CAMEO) (Schrodt Citation2012). CAMEO codes provide context for describing the event occurrences in a format that can be understood by a human analyst. For example, an event that is labeled with CAMEO code 154 (mobilize or increase armed forces) describes an event related to military posturing. We only ingested GDELT events from 1990 to December 31, 2020 (earlier data is sparse).
GDELT provides article counts and event counts. In order to give a higher weight to events that were more newsworthy we used the article counts rather than the event counts as the input to our model. We aggregated the GDELT coded events by date, country and event code producing a daily count of news articles about each event type per country. Due to the increase in the number and type of sources being ingested by GDELT there has been an exponential increase in the number of events coded over the time period of interest. To mitigate this effect we normalized the article count data: for each country the total number of articles about a given event code in a given day is divided by the total number of articles about that event code in the entire world on that day. We then scale these normalized values (which are typically quite small) by feature between 0 and 1 so that each feature covers the same range.
World Bank Data
Socio-economic inputs come from developmental and governmental indicators provided by the World Bank. The World Development Indicators (WDI) (Citation2016) are a collection of indicators provided from 1960 to 2019 that summarize the state of a given country’s development in a given year over many dimensions. The World Bank sources WDI data from “officially-recognized international sources” such as the United Nations Conference on Trade and Development, the World Health Organization and Eurostat. WDIs include approximately 1,600 variables covering diverse topics such as percentage of land that is arable, number of children living with HIV, GDP per capita, percent of population with access to electricity, percent of firms expected to give gifts in meetings with tax officials and percent of women in parliament. The data is updated yearly, with each indicator describing a value in a given country in a given year. We used piecewise cubic interpolation (Fritsch and Carlson Citation1980) and extrapolation for missing values in the WDI data. The data was then normalized to have a zero mean and one standard deviation. The final WDI dataset consisted of normalized yearly values of 1591 indicators for 264 countries and regions over a period of 29 years.
The Worldwide Governance Indicators (WGI) (Citation2016) offer a country-by-country data set that provide an aggregate of expert-based assessments of the health of national governance along six dimensions: control of corruption, government effectiveness, political stability and absence of violence/terror, regulatory quality, rule of law and voice and accountability. Each WGI is an estimate that combines rankings of one to thirty expert opinions drawn from institutions such as non-governmental agencies and think tanks. WGIs span 1996 to 2019 and are released on a yearly basis. We used nearest neighbor interpolation and extrapolation to fill in missing values in this dataset.
Event Similarity
The premise of developing the event similarity metric is that identifying situations in the past with fundamental similarities to the present situation can provide the necessary context for a deeper understanding of the present, helping us to discern the seeds of future disruptive events and, therefore, enhance our predictions of them.
Although there is a rich history of comparative analysis in the social science literature, the type of ground truth necessary to support a supervised or semi-supervised approach does not exist (i.e., there are no sets of global events for which we have a similarity value established). Thus, we developed a novel unsupervised method for identifying countries in similar political and socioeconomic states across time utilizing open-source socioeconomic and coded political event data. Due to the inherently noisy nature of the data and the desire to assign membership values, we chose a fuzzy clustering approach using Gaussian mixture models combined with a pair of deep autoencoders for non-linear dimensionality reduction of the input features ().
Figure 2. Method developed for computing event similarity.
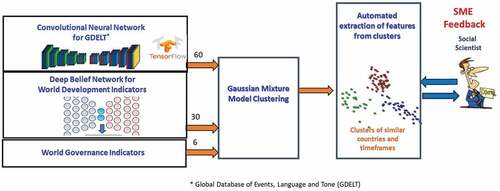
To make comparisons between the conditions of countries at different points in time we used the WDI indicators and GDELT event count data for the 12 month period prior to the times of interest. Combined, these datasets had over 4000 features, some of which were static, changing at most once a year, and some of which were dynamic, changing daily. For meaningful clustering, we needed to significantly reduce this feature set. Since deep autoencoders have been shown to be very powerful for non-linear dimensionality reduction, we used a deep autoencoder consisting of a stacked pair of deep belief networks (DBN) (Hinton and Salakhutdinov Citation2006) to reduce the static features, and we developed a deep convolutional neural network (CNN) autoencoder for multi-variate time series to reduce the dynamic features.
The DBN-based autoencoder consisted of 7 hidden layers with the innermost one containing 30 units. This autoencoder was used to reduce the set of 1591 WDI indicators to a set of 30 compressed features. The CNN-based autoencoder consisted of 17 hidden CNN, pooling and normalization layers. This autoencoder reduced 263 12-month long time series obtained from the GDELT dataset to a set of 60 compressed features. These 90 compressed features were then combined with 6 WGI indicators and clustered using Gaussian mixture models.
Currently the 90 compressed features generated by the two autoencoders are being used as inputs to the prediction engine. In future work we will also be leveraging the clustering results to train multiple models, each of which are specific to countries in a certain political and socio-economic state.
Forecasting Models
Recurrent Neural Networks with Long-Short Term Memory Units
We trained RNNs with LSTM units (Hochreiter and Schmidhuber Citation1997) for predicting ILCs. The RNNs had the following structure: the input layer was followed by a dropout layer with a dropout probability of 0.5. Next was the LSTM layer consisting of 256 hidden units with a dropout probability of 0.4 and recurrent dropout probability of 0.4. This was followed by another dropout layer with a dropout probability of 0.5, then a densely connected layer consisting of a single neuron with the sigmoid activation function, and finally the output layer.
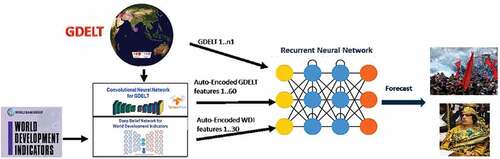
The RNNs were trained on data from January 1999 through December 2011 and tested on the period of January 2012 through December 2020. Training data covered 167 countries for 156 months (26,052 prediction points) and contained 117 ILCs (0.45%). The test data for the same countries covered 108 months (18,036 prediction points) and contained 94 ILCs (0.52%). The inputs and outputs to the RNN are shown in . The inputs to the RNNs were: uncompressed GDELT data, and GDELT and WDI data as compressed by the event similarity autoencoders. The data up to one month before forecasting a given month is fed to the RNN (e.g., when predicting November 2019, data through October 2019 is fed into the network). There is one forecast per month per country (this value is between 0 and 1). We use a threshold to change the continuous forecast into a binary one (ILC or no ILC) – at this point we are not yet forecasting the different levels of ILC. In order to choose the threshold, we computed the False Positive Rate (FPR) on the training data and chose the threshold that corresponded to FPR of 0.02 (the corresponding threshold is 0.17).
Figure 3. Crystal Cube’s inputs and outputs.
Random Forests
In order to compare the results of our LSTM-based approach (including the event similarity), we trained random forests using the same inputs as we used in Parrish et al. (Citation2018). This included GDELT and uncompressed World Bank data. Training and test periods were exactly the same as for LSTMs. The random forests were composed of 501 trees. We reduced the number of features by removing those features which provide little information (features with near zero variance across all observations). This yielded 1546 input features.
Models for Comparison with Ward and Beger
In order to compare the Crystal Cube method with Beger, Dorff, and Ward (Citation2016) and Ward and Beger (2017) we prepared the datasets covering the same set of countries (170) and used the same data as those papers did for training (January1999 – December 2009) and for validation (October 2010 – April 2012). The approaches from those papers also use data from January 1955 to February 2001 for calculating additional duration counters. In our approach we do not use any data before January 1990. We use the same test period as the aforementioned papers when comparing with their results: May 2012 – March 2014 for Beger, Dorff, and Ward (Citation2016) and May 2012 – July 2015 for Ward and Beger (2017).
The ensemble model from Beger, Dorff, and Ward (Citation2016) forecasts the next month (an ILC in a given country in the next month is defined as a positive) and the ensemble model from Ward and Beger (2017) forecasts the next six months (an ILC in a given country in the next six months is defined as a positive). We trained Crystal Cube models performing the same type of forecasts (models are called CC Model 1 and CC Model 2, respectively).
Crystal Cube models are described in the section Recurrent Neural Networks with Long-Short Term Memory Units. They use as inputs the data described in the section Event Similarity. During training they use the ground truth from the ILC thermometer. When testing, in order for the results to be directly comparable with those of Beger, Dorff, and Ward (Citation2016) and Ward and Beger (2017) they are evaluated against the ARCHIGOS binary ground truth.
Results
RNNs with LSTM Units
We used the ILC dataset with levels assigned from the ILC thermometer definitions as ground truth for training RNNs with LSTM units. The RNN correctly forecast many ILCs exactly in the month they occurred (e.g., in Ukraine, United Kingdom, Sudan, Ethiopia, Yemen, Greece, Korea and Thailand). Examples are shown in . For some other countries, RNNs are partially successful at predicting some ILCs at the right time but missing other ILCs, or predicting ILCs that did not happen (e.g., Iraq and Egypt). For countries such as Burkina Faso and Latvia, the RNNs are predicting ILCs too late or missing them. For Haiti and France, we are forecasting ILCs that did not happen.
Figure 4. LSTM predictions for Ukraine for the test period: 1 Jan 2012–31 Dec 2020.
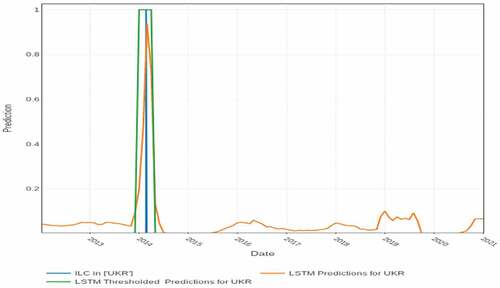
Figure 5. LSTM predictions for UK for the test period: 1 Jan 2012–31 Dec 2020.
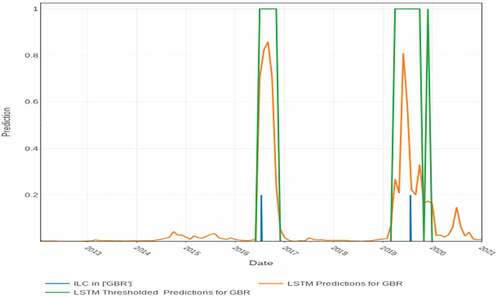
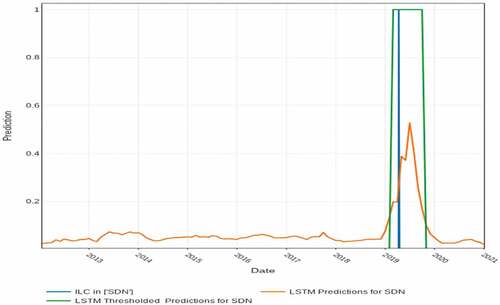
Figure 6. LSTM predictions for Sudan for the test period: 1 Jan 2012–31 Dec 2020.
Predictions for Ukraine are shown in (President Viktor Yanukovych was removed from power as a result of the Ukrainian revolution (22 Feb 2014) and fled to Russia). Our method predicted an ILC in Ukraine from February through April 2014 using the data through the end of January 2014 (one month ahead prediction).
Predictions for the United Kingdom (UK) are shown in . During the test period there were two ILCs: on 13 Jul 2016 Prime Minster (PM) David Cameron resigned immediately after the UK Brexit vote. Our method predicted an ILC for every month in the period July-November 2016, meaning one month before the event happened. The second ILC was predicted for April-December 2019. On 24 May 2019 PM Theresa May announced her resignation as leader of Britain’s Conservative Party and she resigned on 24 July 2019 (and Boris Johnson became the PM), meaning that the event was predicted 2 months before it was announced and 4 months before it happened.
shows the predictions for Sudan. On 11 April 2019 Sudan’s President Omar al-Bashir was removed from power by the Sudanese Armed Forces amid ongoing protests after holding the office for nearly 30 years. Our model predicted an ILC in Sudan for March-October 2016, meaning 2 months in advance.
To organize monthly predictions into actionable insights for the user, we show a map with the countries with the top five highest ILC prediction scores. The countries coded in green are those for which our method correctly predicted an ILC within the next 12 months. The countries in brown are those for which an ILC was predicted but ultimately did not take place (in certain cases failed coups or other unrest did occur). are examples of these top five monthly predictions.
Figure 7. LSTM forecasts for July 2015.
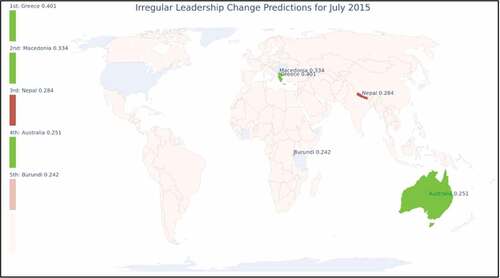
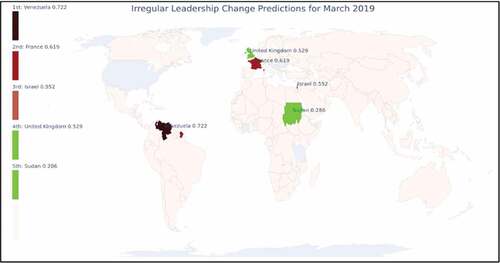
Figure 8. LSTM forecasts for March 2019.
depicts the top five countries forecast to be at risk for an ILC in July 2015. In three of those countries an ILC occurred: we forecast Greek PM Alexis Tsipras’s resignation a month early, Australian PM Tony Abbott’s removal two months early and Macedonian PM Nikola Gruevski’s resignation six months early. In the two remaining countries, protests or threats of a coup d’état took place: violence erupted and an ILC was threatened in July in both Burundi and Nepal. Additional information about these events is shown in .
Table 1. Detailed description of events forecast for July 2015
shows the LSTM’s forecast for March 2019. All five countries faced some form of political turmoil or instability. We were able to make the prediction one month in advance of Sudan’s military coup d’état against Omar al-Bashir on 11 April 2019 and the subsequent resignation of the coup leader, Lieutenant General Ahmed Awad Ibn Auf. We predicted an ILC in the UK two months in advance of PM Theresa May’s resignation announcement during ongoing Brexit disputes. Even the countries that did not experience ILC still had significant crises and political events worthy of attention: France faced rioting during protests and the government used military forces for protection; Venezuela continued to suffer from a political and humanitarian crisis; and Israel had election-related issues and on 1 November 2019, PM Benjamin Netanyahu was indicted on charges of breach of trust, bribery and fraud. As such, our top five forecasting identifies which countries warrant further evaluation of the potential effects of the turmoil and instability and examination for the possibility of ILC. Additional information about these events in shown in .
Table 2. Detailed description of events forecast for March 2019
Random Forests
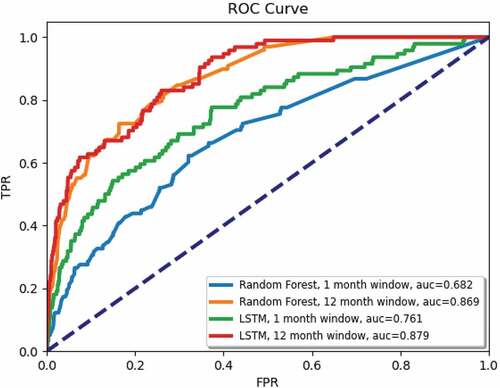
We have two methods for scoring our forecasts. In the first approach the predictions are monthly and a True Positive (TP) is achieved only when a prediction exceeded the threshold for exactly a given month (e.g., an ILC happened in May, 2018 and the prediction exceeded the threshold for May). This corresponds to the blue curve for random forests (RFs) and to the green curve for the LSTM on . In the second approach, a TP is achieved when the ILC happened in the month it was predicted or up to 11 months later (e.g., the prediction exceeded the threshold for April 2018 and the ILC happened in May 2018). This corresponds to the yellow curve for RFs and to the red one for LSTM on . For the one month window, the Area under the Curve (AUC) for LSTM (0.774) is substantially higher than for RFs (0.699) and the AUCs for a twelve month window are comparable for both methods.
Figure 9. Random forest and LSTM ROCs for forecasting 1 month and up to12 months ahead.
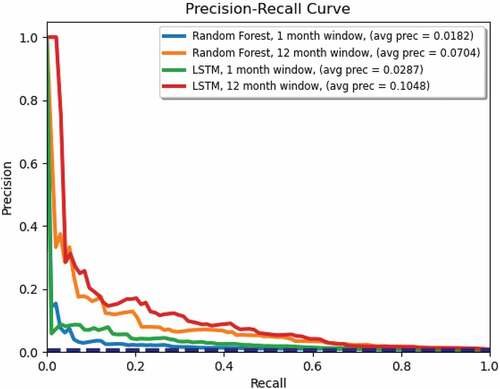
However, a ROC for forecasts is not the best way of measuring performance when the two classes are significantly imbalanced. A much better method is a Precision – Recall curve (shown in ). For both the one month and twelve month windows, LSTM results are significantly better than RF results.
Figure 10. Random forest and LSTM Precision-Recall curves for forecasting 1 month and up to 12 months ahead.
Comparison with a Random Baseline
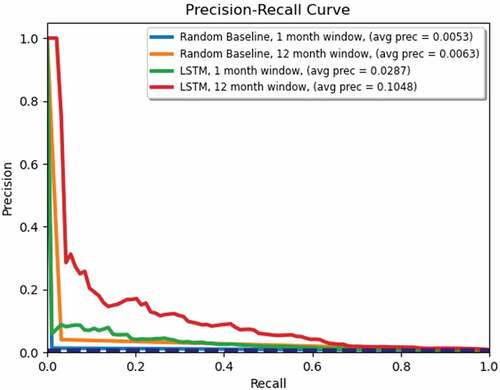
We also include a comparison between our LSTM results and a random baseline. The random baseline was created by computing the percentage of ILCs that occurred during the training period for each country and then predicting whether an ILC would occur in that country for each month of the testing period using a random number generator set to predict ILCs at the same rate that they occurred during the training period. show the ROC and the Precision-Recall curves, respectively, for this comparison. The LSTM results both for 1-month and 12-months are significantly better than the random baseline in terms of ROC and Precision-Recall.
Figure 11. Random baseline and LSTM ROCs for forecasting 1 month and up to 12 months ahead.
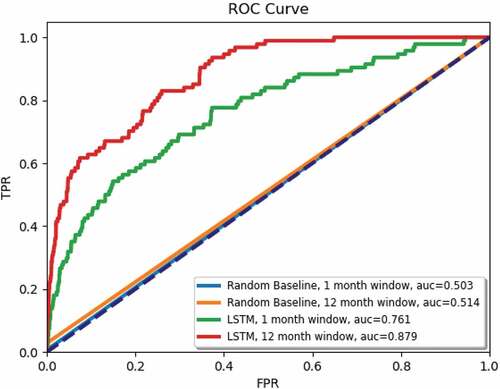
Figure 12. Random baseline and LSTM Precision-Recall curves for forecasting 1 month and up to 12 months ahead.
Comparison with Ward and Beger
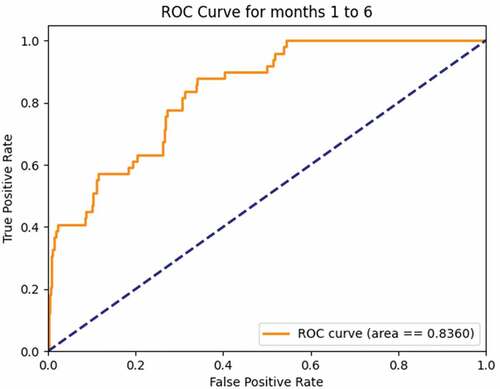
Comparison of results achieved by the Crystal Cube networks with those of Beger, Dorff, and Ward (Citation2016) and Ward and Beger (2017) on the test data is shown in . CC Model 1 achieves higher AUC and accuracy than the ensemble model of Beger, Dorff, and Ward (Citation2016). CC Model 2 achieves higher AUC and average precision (Avg PR) than the ensemble model of Ward and Beger (2017). The ROC Curves for CC Model 1 and CC Model 2 are shown in . In those figures the ROC curves for Beger, Dorff, and Ward (Citation2016) and Ward and Beger (2017) are not shown as we did not have the data to draw them, given the fact that in their papers they only show the plots of ROC curves.
Table 3. Comparison of CC forecasts with those from Beger, Dorff, and Ward (Citation2016) and Ward and Beger (2017). Avg PR was not computed in Beger, Dorff, and Ward (Citation2016), – accuracy was computed instead
Figure 13. ROC for 1 month forecast – test data from .Beger, Dorff, and Ward (Citation2016)
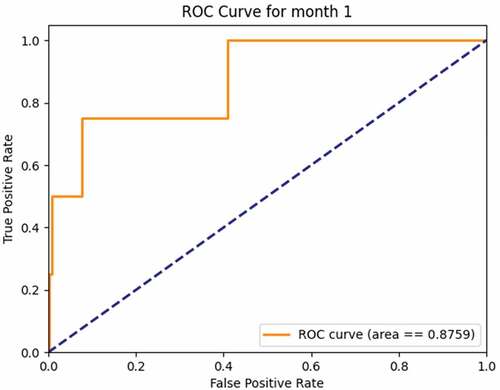
Figure 14. ROC for 6 month forecast by Crystal Cube – test data from Ward and Beger (2017).
Conclusions
Forecasting disruptive events such as ILCs is of broad interest to decision makers and leaders across a variety of domains, including military, politics and business. Foreign policy makers can incorporate forecasting models in their analysis of how to adjust foreign policy of the US to better engage other nations. National security decision makers could allocate resources before an ILC to better respond to the event. Business professionals would benefit from understanding political risks and how they might affect investments.
We consider the task of forecasting ILCs, an especially challenging example of disruptive event forecasting due to the rarity of these events and the dynamic settings under which they occur. ILCs are comparatively more challenging to forecast than other more common types of disruptive events, such as riots, protests or ethnic/religious violence. We demonstrate that, by combining a novel measure of event similarity, GDELT event tracking and World Bank economic indices in a deep learning framework based on sequence models (LSTM), we can significantly improve over previous methods for ILC prediction. Furthermore, our new dataset includes an ILC Thermometer, which allows for a more nuanced view of what constitutes an ILC. Our system can be extended to incorporate other data types and to forecast other types of disruptive events.
Future Work
In our future work, we plan to consider issues of explainability to help policy makers understand the why behind our forecasts. For example, perhaps our model predicts there is a likely ILC because of growing protests combined with weak economic data. Understanding the justifications behind a forecast can engender trust in the forecast and provide a more nuanced view of the factors involved, further supporting policy makers in their decision process. To explaining Crystal Cube forecasts, we plan to work with methods such as SHapley Additive eXplanations (SHAP) (Lundberg and Lee Citation2017) that tell which variables contributed the most to a given forecast. We also plan to include social context data as additional inputs to the Prediction Engine, such as data from social media platforms.
Disclosure Statement
No potential conflict of interest was reported by the author(s).
References
- Arva, B., J. Beieler, B. Fischer, G. Lara, P. A. Schrodt, W. Song, M. Sowell, and S. Stehle. 2013. Improving forecasts of international events of interest. EPSA.
- Beger, A., C. L. Dorff, and D. Ward. 2016. Irregular leadership changes in 2014: Forecasts using ensemble, split-population duration models. International Journal of Forecasting 32 (1):258–281. doi:10.1016/j.ijforecast.2015.01.009.
- Bell, C. 2016. The rulers, elections, and irregular governance dataset (REIGN). Accessed 2016. https://oefdatascience.github.io/REIGN.github.io.
- Brandt, P., M. Colaresi, and J. R. Freeman. 2008. The dynamics of reciprocity, accountability, and credibility. Journal of Conflict Resolution (Department of Defense) 52 (3):343–74. doi:10.1177/0022002708314221.
- Bueno de Mesquita, B. 1980. An expected utility theory of international conflict. American Political Science Review 74 (4):917–31. doi:10.2307/1954313.
- Bueno de Mesquita, B. 1983. The war trap. New Haven, CT: Yale University Press.
- Bueno de Mesquita, B. 1984. Forecasting policy decisions: An expected utility approach to post-Khomeini Iran. PS, Political Science & Politics 17 (2):226–36. doi:10.2307/418786.
- Della Porta, D. 1995. Social movements, political violence, and the state: A comparative analysis of Italy and Germany. Cambridge: Cambridge University Press.
- Della Porta, D. 2013. Meeting democracy: Power and deliberation in global justice movements. Cambridge: Cambridge University Press.
- Department of Defense. 2005. US national defense strategy. Washington.
- Diermeier, D., and T. Feddersen. 1998. Cohesion in legislatures and the vote of confidence procedure. American Political Science Review 92 (3):611–21. doi:10.2307/2585484.
- Eckstein, S., ed. 1989. Power and popular protest: Latin American social movements. Berkeley: University of California Press.
- Fritsch, F. N., and R. E. Carlson. 1980. Monotone piecewise cubic interpolation. SIAM Journal on Numerical Analysis 17 (2):238–46. doi:10.1137/0717021.
- Goemans, H. E., K. S. Gleditsch, and G. Chiozza. 2009. Introducing ARCHIGOS: A dataset of political leaders. Journal of Peace Research 46 (2):269–83. doi:10.1177/0022343308100719.
- Gurr, T. R. 1970. Why men rebel. Princeton, NJ: Princeton University Press.
- Hegre, H., H. Buhaug, K. V. Calvin, J. Nordkvelle, S. T. Waldhoff, and E. Gilmore. 2016. Forecasting civil conflict along the shared socioeconomic pathways. Environmental Research Letters 11 (5):054002. doi:10.1088/1748-9326/11/5/054002.
- Hegre, H., J. Karlsen, H. M. Nygård, H. Strand, and H. Urdal. 2013. Predicting Armed Conflict, 2010-2050. International Studies Quarterly 57 (2):250–70. doi:10.1111/isqu.12007.
- Hegre, H., M. Allanssona, M. Basedaua, M. Colaresia, M. Croicua, H. Fjeldea, F. Hoylesa, L. Hultman, S. Högbladh, R. Jansen, et al. 2019. ViEWS: A political violence early-warning system. Journal of Peace Research. 56 (2):155–74. doi:10.1177/0022343319823860.
- Hegre, H., N. W. Metternich, H. Mokleiv, and J. Wucherpfennig. 2017. Introduction: Forecasting in peace research. Journal of Peace Research 54 (2):113–24. doi:10.1177/0022343317691330.
- Herb, M. 1999. All in the family: Absolutism, revolution, and democracy in the Middle Eastern Monarchies. Albany: State University of New York Press.
- Hinton, G. E., and R. Salakhutdinov. 2006. Reducing the dimensionality of data with neural networks. Science 313 (5786):504–07. doi:10.1126/science.1127647.
- Hochreiter, S., and J. Schmidhuber. 1997. Long short-term memory. Neural Computation 9 (8):1735–80. doi:10.1162/neco.1997.9.8.1735.
- Lafferty, J., A. McCallum, and F. C. N. Pereira. 2001. Conditional random fields: Probabilistic models for segmenting and labeling sequence data. International Conference on Machine Learning, Williams College, June 28 - July 1, 2001.
- Laver, M., and N. Schofield. 1990. Multiparty government: The politics of coalition in Europe. Oxford: Oxford University Press.
- Leetaru, K. H. 2017. Global database of events, language and tone 1.0. https://www.gdeltproject.org
- Lundberg, S. M., and S.-I. Lee. 2017. A unified approach to interpreting model predictions. Advances in Neural Information Processing Systems 30 (NIPS 2017).
- Lustick, I., S. O’Brien, S. Shellman, T. Siedlecki, and M. Ward. 2015. ICEWS events of interest ground truth data set. https://dataverse.harvard.edu/dataverse/icews
- McAdam, D. L. 1982. Political process and the development of black insurgency, 1930-1970. Chicago, IL: University of Chicago Press.
- Montgomery, J. M., F. M. Hollenbach, and M. D. Ward. 2012. Improving predictions using ensemble Bayesian model averaging. Political Analysis 20 (3):271–91. doi:10.1093/pan/mps002.
- Muthiah, S., P. Butler, R. P. Khandpur, P. Saraf, and N. Self. 2016. EMBERS at 4 years: Experiences operating an open source indicators forecasting system. 22nd ACM SIGKDD International Conference on Knowledge Discovery and Data Mining, San Francisco, CA. August 13-17, 2016.
- Parrish, N. H., A. L. Buczak, J. T. Zook, J. P. Howard, B. J. Ellison, and B. D. Baugher. 2018. Crystal cube: Multidisciplinary approach to disruptive events prediction. International Conference on Applied Human Factors and Ergonomics 571–81.
- Perez-Linan, A. 2007. Presidential impeachment and the new political instability in Latin America. New York, NY: Cambridge University Press.
- Qiao, F., P. Li, X. Zhang, Z. Ding, J. Cheng, and H. Wang. 2017. Predicting social unrest events with hidden Markov models using GDELT. Discrete Dynamics in Nature and Society 2017:1–13. doi:10.1155/2017/8180272.
- Schrodt, P. A. 2012. CAMEO conflict and mediation event observations event and actor codebook. Pennsylvania State University, Event Data Project, University Park, PA.
- Schrodt, P.A. 1988. Artificial intelligence and formal models of international behavior. Am Soc 19, 71–85. https://doi.org/10.1007/BF02692375
- Schrodt, Philip A., 1991. “Prediction of Interstate Conflict Outcomes Using a Neural Network”, Social Science Computer Review 9:3.
- Stevens, J. 2012. “Political scientists are lousy forecasters.” New York Times, June 23.
- Thomson, R., T. Royed, E. Naurin, J. Artes, R. Costello, L. Ennser-Jedenastik, K. Praprotnik, P. Kostadinova, C. Moury, and F. Pétry. 2017. The fulfillment of parties’ election pledges: A comparative study on the impact of power sharing. American Journal of Political Science 61 (3):527–42. doi:10.1111/ajps.12313.
- Tilly, C. 2002. Stories, identities, and political change. Lanham, MD: Rowman & Littlefield Publishers.
- World Development Indicators. 2016. https:/data.worldbank.org/data-catalog/world-development-indicators
- World Governance Indicators. 2016. https://data.worldbank.org/data-catalog/worldwide-governance-indicators