
 ?Mathematical formulae have been encoded as MathML and are displayed in this HTML version using MathJax in order to improve their display. Uncheck the box to turn MathJax off. This feature requires Javascript. Click on a formula to zoom.
ABSTRACT
Machine learning specific scholarly full-text documents contain a number of result-figures expressing valuable data, including experimental results, evaluations, and cross-model comparisons. The scholarly search system often overlooks this vital information while indexing important terms using conventional text-based content extraction approaches. In this paper, we propose creating semantically enriched document summaries by extracting meaningful data from the results-figures specific to the evaluation metric of the area under the curve (AUC) and their associated captions from full-text documents. At first, classify the extracted figures and analyze them by parsing the figure text, legends, and data plots – using a convolutional neural network classification model with a pre-trained ResNet-50 on 1.2 million Images from ImageNet. Next, we extract information from the result figures specific to AUC by approximating the region under the function’s graph as a trapezoid and calculating its area, i.e., the trapezoidal rule. Using over 12,000 figures extracted from 1000 scholarly documents, we show that figure specialized summaries contain more enriched terms about figure semantics. Furthermore, we empirically show that the trapezoidal rule can calculate the area under the curve by dividing the curve into multiple intervals. Finally, we measure the quality of specialized summaries using ROUGE, Edit distance, and Jaccard Similarity metrics. Overall, we observed that figure specialized summaries are more comprehensive and semantically enriched. The applications of our research are enormous, including improved document searching, figure searching, and figure focused plagiarism. The data and code used in this paper can be accessed at the following URL: https://github.com/slab-itu/fig-ir/.
Introduction
In recent years, scientific publications in digital libraries have shown a tremendous increase, thus, creating a challenge for the end-users to access and search for the relevant content using traditional Information Retrieval (IR) techniques (Iqbal et al. Citation2019; Hassan et al., Citation2018; Safder, Hassan, and Aljohani Citation2018; Said et al. Citation2019; Iqbal et al. Citation2021). Digital libraries such as Google Scholar, Citeseerx, Scopus, Web of Science and DBLP, etc., are the prominent places to look for while searching scholarly documents (Mutlu, Sezer, and Akcayol Citation2019; Zhu et al. Citation2014). The number of documents in these repositories is enormously high. For example, Google Scholar has reached up to 170–175 million documents. Thus, it has become critical to mine this ever-increasing data and understand the semantics of the scholarly documents (Rahi et al. Citation2019). Primarily the scholarly full-text documents consist of textual and non-textual contents. Generally, traditional IR systems are only limited to tapping the textual contents of scholarly documents and lack to tap non-textual contents for providing results against user queries (Safder et al. Citation2020). Therefore, understanding the different non-textual contents (figure, tables, and graphs) and developing a relationship between them is essential to cater to user search needs.
Notably, scholarly articles contain many tables and figures that are enriched with helpful knowledge. A recent study, conducted over 10,000 articles randomly selected from top computer science conference proceedings from the year 2004 to 2014, shows that over 70% of publications contained a minimum of one figure, around 43% had one table, and almost 36% contained at least one table and one figure (Choudhury, Wang, and Giles Citation2015). Additionally, researchers use result-figures (bar charts, line graphs) to present their data and compare the findings of different experimental studies, summarize the experimental results, etc. Therefore, a knowledge gap will remain if result-figures from scholarly documents are not parsed and analyzed in IR systems to provide efficient results against user queries across scientific disciplines (Hassan et al. Citation2012).A number of studies have been done on developing IR systems for textual data, but only a few works have used non-textual contents to improve IR results (Hassan et al. Citation2018b; Hassan et al. Citation2018a; Hassan et al., Citation2017; Safder et al. Citation2017). Quite a few studies have used figure metadata such as text lines near the figures or the text lines mentioning the figures and their figure captions, from within the textual content of the documents to generate enriched descriptions of the figures (Bhatia and Mitra Citation2012; Moraes et al. Citation2014). Additionally, parsing and understanding of figure contents to understand figure semantics have also gained less attention. Recently, FigureSeer is one of the prominent frameworks established by Siegel et al. (Citation2016) that has localized scientific result-figures (line graphs) from scholarly documents, extracted and classified them and later parsed them to improve IR systems. However, none of the studies has focused on designing specialized result-figures based summaries for an article by parsing both result-figures semantic contents (figure text, plotted data, area under the curve) and figures metadata (figure captions and similar sentence) from full-text of a scholarly document (Hassan et al., Citation2017).
We formulate our problem into the following sets. Let be the collection of full-text scholarly documents. Let
be the set of all result-figures present in scholarly documents
Let
be the set of all captions against each
found in collection
, let
be the set of summaries generated for each d in D, using
. Furthermore, we merge figure semantics by parsing
and information from
together, to form a tuple such that
is the result-figures specialized summary for a document
.
In this paper, we present a technique to identify, extract and parse result-figure generate specialized summaries to improve searching results of IR system. Following are the two main contributions of this study:
This research’s first and foremost contribution is to parse scientific result-figures to extract figure semantics from research documents. Firstly, we extracted result-figures such as bar charts, line charts, and node graphs from pdf documents. Secondly, we parse these figures to extract textual and plotted data. Furthermore, we design an approach to compute the area under the value of the curve for the precision-recall (PR) graph plots found in full-text documents. The designed approach shows encouraging results when employed over a collection of result-figures that contains 17,950 figures extracted from 1,000 research papers indexed by the semantic scholar.Footnote1
The second contribution of this study is to generate result-figures specialized summaries with the addition of figure semantics extracted from each figure image and figure metadata mined from the full text of a document. Firstly, we captured figure caption sentences against each figure using regular expressions. Secondly, we extracted similar sentences matched to caption sentences from the whole document, using Okapi BM25 (Beaulieu et al. Citation1997). Furthermore, we combined figure metadata (caption sentences and similar sentences) and figure semantics extracted by our designed figure parsing technique to build enhanced figures specialized summaries for each scholarly document. Lastly, the specialized summaries are evaluated against human-generated summaries using ROUGE-N, ROUGE-L, Jaccard Similarity and Edit Distance metrics (Lin Citation2004).
The rest of the paper is organized as follows: Section 2 focuses on the previous research that has been carried out in figure parsing and summarization. Section 3 discusses the entire approach, including the steps involved in specialized summary generation. Section 4 discusses the experimental results for figure parsing and also presents metrics for summary evaluation. Finally, Section 5 concludes the paper.
Related work
Many recent studies were focused on mining knowledge from figures and full-text to understand the text and figure semantics efficiently (Unar et al. Citation2019; Zhao et al. Citation2019). We categorize the related work into three sections; the first section presents prominent studies on figure classification and parsing. The second one is concerned with generating documents summaries using figures and full-text. The last section aims to cover the research work on specialized scholarly search systems that have been developed over the years.
Review of figure classification & parsing
Extracting information from figures has gained much attention from the last few years (Qian et al. Citation2019). A number of studies have been presented to extract figures, classify them and my figure contents (Saba et al. Citation2014; Takimoto, Omori, and Kanagawa Citation2021; Thepade and Chaudhari Citation2021; Xu et al. Citation2019). Recently, a machine learning-based heuristic independent approach has been designed that extracts figures from PDF documents (Ray Choudhury, Mitra, and Giles Citation2015). Clark and Divvala (Citation2016) presented PDFfigures, an advanced system to capture images from pdf articles along with figure titles, captions, and body text. The designed technique decomposed pages into different parts such as graphics, figure texts, body text, and captions. Then it locates figures by analyzing the empty regions within the text that takes a pdf document as input and separate figures, tables, and captions from pdf. Generally, figures found in the scientific literature are often complex and composed of many different subfigures. In order to understand these figures, it is important to separate these multiple subfigures. However, PDFFigures cannot divide figures into relevant subfigures. Later, a data-driven approach is proposed to separate subfigures from pdf documents using deep convolutional neural networks (Tsutsui and Crandall Citation2017).
Moreover, Choudhury, Wang, and Giles (Citation2015) proposed an architecture that automatically extracts figures and their metadata such as captions, headings, etc. Additionally, the proposed system also utilized a Natural Language Processing (NLP) module to understand the intended content and knowledge from figures and designed a search engine to index the extracted figures and their related metadata. Choudhury, Wang, and Giles (Citation2016) claimed that if an image is extracted by rasterizing (PNG, JPEG) a PDF page, all information is lost. At the same time, all characters in the original image can be restored if images are converted into SVG vectors. Likewise, neural network-based page segmentation techniques are also explored to segregate text blocks, figures, and tables from scholarly pdf documents (Chen et al. Citation2015; He et al. Citation2017).
Classification of figures has also become an exciting area of research from the last few years. Choudhury, Wang, and Giles (Citation2015) designed an unsupervised technique for figure classification that outperformed the traditional feature learning methods such as SIFT and HoG. Additionally, the authors also developed figure parsing modules as sub-components of the system and performed different analyses on colored line graph extraction to highlight the easy and hard cases. Moreover, OverFeat (Sermanet et al., Citation2013), an integrated framework, has recently been proposed that is trained by a convolutional network to detect, classify and locate objects in images simultaneously. This convolutional-based approach localizes and detects the figure by accumulating bounding boxes.
A state-of-the-art approach for figure extraction and parsing is FigureSeer (Siegel et al. Citation2016) that deployed a deep neural network to classify result-figures into bar charts, line graphs, node diagrams and scatter plots. The system also designed a figure parsing technique for line graphs. Al-Zaidy and Giles (Citation2015) automatically extract text and graphical components from bar charts by using different heuristics and image-processing techniques. A number of machine learning approaches have been proposed for the semantic structuring of charts by computing features from both graphic and text components of graphs (Al-Zaidy and Giles Citation2017; Siegel et al. Citation2018).
Among the notable figure extraction systems, ChartSense (Jung et al. Citation2017) is a semi-automatic system that extracts data from charts. It uses a deep learning approach to classify the type of charts. However, it requires user interaction to complete the extraction task effectively. Likewise, Scatteract (Cliche et al. Citation2017) is a fully automated system that deals with scattered plots with a linear scale. This system uses deep learning for identifying the components of the charts and maps the pixels to the chart coordinates with the help of OCR and robust regression. They also focused on text detection, recognition and data extraction from scatterplots. To calculate the area under a curve, the trapezoidal rule has long been used. The trapezoidal rule is simply integral of the function, where the function is divided into small intervals, each representing a trapezoid (Tallarida and Murray Citation1987). A lot of work has been done using the trapezoidal rule to calculate the area under the curves for different fields. For example author states about using the Trapezoidal rule to calculate the area under discrete and continuous curves. The area under the curve approach is used in medicine, for instance, to calculate the magnitude of pain experienced by the patients or to compute the area for plasma level-time curve. However, to our knowledge, no work has been done to find the area under the curve of parsed result figures.
Review on document summarization using figure metadata
Generating summaries for documents has been explored extensively for the last many years (Barros et al. Citation2019; Liu et al. Citation2021; Mohamed and Oussalah Citation2019; Sinoara et al. Citation2019). However, generating customized summaries for figures by analyzing figure contents and figure metadata has received relatively less focus. Moraes et al. (Citation2014) proposed a system that generates a high-level description for images from the textual contents that is found near to the image in the document. Moreover, generating summaries of document elements such as figures, tables and algorithms may assist users in grasping the critical details about a document element (figure, table, and algorithm) quickly, instead of reading and understating the whole document. Bhatia and Mitra (Citation2012) designed specialized document element based summaries by deploying rule-based and machine learning-based techniques. It extracts sentences based on similarity and proximity with the captions and from within the document text that states about the specific document element. Recently, Chen et al. (Citation2019) designed an LSTM based label maps attention model to generate accurate descriptions for line and bar charts using the FigureQA dataset (Kahou et al. Citation2017).
Review on specialized scholarly search systems
The practical significance of searching the most relevant research articles has motived the development of advanced scholarly search systems (Li et al. Citation2013; Safder and Hassan Citation2018). Recently, Safder and Hassan (Citation2019) presented a prototype system for algorithm metadata searching is designed. The proposed system supports the users for searching an algorithm based on the evaluation results such as precision-recall and f-measure etc., reported in the text of a paper, using deep learning-based techniques. AlgorithmSeer (Tuarob et al. Citation2016), a customized system to search for an algorithm from full-text articles. They designed rule-based and machine learning-based techniques to identify and extract algorithms written in full-text publications. Furthermore, the presented system has been integrated along with the CiteSeerx repository. Hassan, Akram, and Haddawy (Citation2017) used textual elements from full text to improve IR results.
TableSeer (Liu et al. Citation2007), a specialized tool to identify, extract and index tables from documents. They implemented a custom-made TableRank algorithm to tweak the searching results. FigureSeer (Siegel et al. Citation2016), a system that identifies, parse, and indexes result from figures. AckSeer (Khabsa, Treeratpituk, and Giles Citation2012), an acknowledgment repository that extracts acknowledgments and identifies entities from CiteSeerx data. Furthermore, Choudhury et al. (Citation2013) designed a tailed search engine for figures from chemistry publications.
Despite the availability of these advanced systems, there is a need to design more tailed techniques to search for results figures from articles. Since the non-textual content of a document is as much important as the textual content. In particular, result figures such as graphs contain important information which is often not found in the running text. Unfortunately, this information is ignored, leaving behind a gap in extensively conveying the idea of the document. Hence, getting the gist out of the figures, it is important to parse these images.
Lee, West, and Howe (Citation2017) use techniques from computer vision and machine learning to classify more than 8 million figures from PubMed into five-figure types and study the resulting patterns of visual information as they relate to scholarly impact. They found that the distribution of figures and figure types in the literature has remained relatively constant over time but can vary widely across fields and topics. They also found a significant correlation between scientific impact and the use of visual information, where higher impact papers tend to include more diagrams, and to a lesser extent, more plots.
Zha et al. (Citation2019)_ define a new problem called mining algorithm roadmap in scientific publications and then propose a new weakly supervised method to build the roadmap. The algorithm roadmap describes the evolutionary relationships between different algorithms and sketches the undergoing research and the dynamics of the area. It is a tool for analysts and researchers to locate the successors and families of algorithms when analyzing and surveying a research field. They proposed abbreviated words as candidates for algorithms and then used tables as weak supervision to extract these candidates and labels. Next, they propose a new method called Cross-sentence Attention NeTwork for cOmparative Relation (CANTOR) to extract comparative algorithms from the text. Finally, they derived order for individual algorithm pairs with time and frequency to construct the algorithm roadmap. Through comprehensive experiments, their proposed algorithm shows its superiority over the baseline methods on the proposed task.
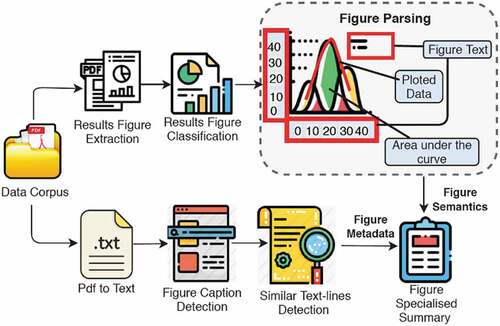
System’s architecture
This section explains the details of our dataset and proposed approach. shows the detailed architecture of our designed technique. Firstly, we mined the figure semantics by extracting, classifying and parsing result-figures. Our designed parsing technique extract curves and calculates their area under the curve value from line graphs. Secondly, we extracted figure metadata from the article. Specifically, we convert the pdf to text, detect captions of the figures and similar text lines. Lastly, we combined figure semantics and result-figures metadata to generate a specialized summary.
Figure 1. Overview of the proposed system from data processing to figure based document search.
Data
Our dataset is a subset of data corpus used by FiguresSeer (Siegel et al. Citation2016) that contained over 22,000 full-text documents belonging from top computer science conferences; CVPR, ICML, ACL, CHI, and AAAI, indexed by Semantic Scholar. From among these, we randomly selected 1000 documents and obtained around 12,146 figures belonging to different classes (graph plots, bar charts, flow charts, etc.). We also extracted 5,804 subfigures from these documents. Later, we used a random sample of 1000 line graphs for parsing that yields 1272 axes, 2183 legend entries, and plots.
Figure extraction & classification
Digital documents follow standard formats for writing the text and presenting figures. Generally, full-text documents follow a similar format, where no blank spaces are left inside the body text, except surrounding the figures. Figures are mentioned with captions. This idea is used for detecting figures from documents for extraction. We identified caption words like ‘Figure |Fig | FIGURE | FIG’ from full-text. Next, bounding boxes are used for region identification, such as body text, captions, and figures. Once captions and figures are identified, each caption is assigned to the figure it belongs to. Figures sometimes contain within them another figure. For instance, a figure on one side can be a graph plot and on the other side is a table, representing results from that graph. Therefore, each figure is then decomposed into subfigures using an existing iterative approach that identifies splits between the figures (Siegel et al. Citation2016).
Generally, graph plots are the standard form of figures representing experimental results. Once we had extracted figures, we performed a classification mechanism to find the type of extracted figures. For this purpose, we deployed an existing state of the art model for figure classification (Siegel et al. Citation2016). A CNN classification model using ResNet-50 (He et al. Citation2017) was pre-trained on 1.2 million Images from ImageNet (Deng et al. Citation2009) and fine-tuned for figure classification.
Parsing result-figures
Figure Parsing is a complex task, especially when it comes to result from figures. They have strict requirements. Minor variations while parsing plot data can change the results and affect the overall output. Moreover, figures take different designs structures and formatting styles while being created. This also makes it hard for establishing a common ground between them. Color is a helpful feature for identifying different parts of the figure, however sometimes the same color is reused for different plots, or most of the time, a figure is displayed in grayscale, making it hard to distinguish the figure plotted parts. Also, noise such as heavy clutter, deformation, and occlusion, hinder in truly parsing the plotted data. Algorithm 1 presents the detailed pseudo code to parse a line graph figure.3.3.1 Textual Parsing
We have used OpenCV with its deep-learning-based OCR, Pytesseract,Footnote2 for figure parsing. For each text, it extracts associated bounding box in the form of [x,y,w,h] where “x” and “y” are points in the cartesian coordinates of the figure, “w” is the width and “h” is the height of the bounding boxes. Width and height are later used to find the rotation of text, i.e. either vertical or horizontal. In this way, it extracts figure text, axes labels, axes scale and legend texts. This information is then saved in a JSON file.
Curve separation
Figures containing only one curve are easy to parse as compared to the figures containing multiple curves. The case gets harder if the curves intersect each other or if the curves are in grayscale. Therefore, the approach taken here is to separate the curves based on colors. This is done by transforming the figure into an HSV color-space. Every single curve is saved into a separate file. However, we came across the problem of color variation within the single curve and across multiple curves. We tackled this issue by observing the HSV value within the curve and across the curves and then setting a range for the popular colors. We extracted points on the curves by using Hough transformation. This gave us the end-points of small lines on the curves that are then sorted in increasing order on the horizontal axis.

Algorithm 1: Pseudo code to parse line graph image

Algorithm 2: Pseudo code to calculate area under the curve of a line graph.
Extracting area under the curve
In order to compute the area under the curve (AUC) in line graphs, we applied the trapezoidal rule (Pavičić et al. Citation2018) that divides the curve into multiple small intervals in the shape of a trapezoid and computes the area for each small trapezoid. The trapezoidal rules for computing area under the curves with multiple points on the curves are given below in EquationEq. 1(1)
(1) :
where
and h is the distance between two points on the curve as shown in .
Figure 2. Trapezoidal rule showing a curve divided into multiple intervals.
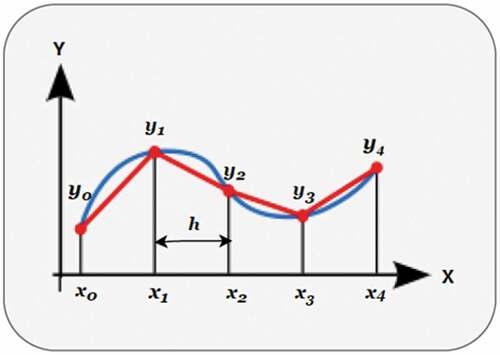
Note that each trapezoid contributes to the computation of AUC. We computed AUC for all the curves of a line graph as they might represent results corresponding to different models or to the same model with different parameter settings. Furthermore, we generated a figure semantic summary by parsing figure details. Algorithm 2 presents the pseudo-code to calculate the area under the curve from a line graph. Firstly, we identified the x-axis label and the y-axis label. Next, we identify each curve legends label and their symbols based on the legends symbol color. We separated each curve and calculated AUC for each curve. Furthermore, we sorted the curves based on the area in descending order and picked the curve that has greater AUC among all. Lastly, we generated a description for the parsed line graph as follows: [X-axis Label] versus [Y-axis Label] [Name of the curve that has a higher value of AUC] performed better than [Name of all other curves].
Extracting figure metadata from full-text
General summaries provide a different idea of a full-text document. Here, information about specific document elements might be lost. Whereas a specialized summary may help to find a particular knowledge from the full text. The amount of detail to be shown in a specialized summary is proportional to the user’s need, as it should not be too long or too short. They were inspired by the work of (Safder et al. Citation2020) where the author first generated a synopsis of full-text documents and then enriched it with algorithmic–specific sentences to get a more meaningful summarization of full-text documents generated specialized summaries for the figures (Safder and Hassan Citation2018). Following are the preprocessing step carried out in a specialized summary generation.
Hierarchal segmentation of document
A full-text document is composed of different sections such as Abstract, Introduction, Literature review, Methodology, Experiments and Results, Conclusion and References. These sections are organized hierarchically. The possibility that the result-figures will occur in the Experiments and Results section is high. Therefore, we need to segment this section and ignore the rest of the paper. Therefore, we extracted the plain text from the PDF document by using the PDFBox libraryFootnote3 moreover, performed a documents segmentation mechanism to divide a document into its standard sections.
Figure caption detection
In order to extract figure metadata, we extracted figure captions from full text. Generally, figure captions are mentioned under the figures and follow a specific pattern, as mentioned below:
Where figure caption words “Figure|Fig|FIGURE|FIG” are followed by some integer value which keeps track of the number of the specific figure, followed by some delimiter which can be of the type “:” or “.” In the end, it has some text explaining the figure.
Average line length
Line length is the count of words in a line. Average line length is the sum of a number of words in each line divided by the total number of lines. All those lines having lengths lesser than the average line length are discarded. In this way, we filter out the section headings, titles, etc. As captions are already being detected, hence they are not removed. Furthermore, Sparse lines often are created when converting from PDF to text. These lines can be associated with author name, table data, equations, etc. These lines are removed using word density measure as shown in EquationEq. 2(2)
(2) :
Similarity to caption
In order to generate figure metadata, we parse the text document and find the similarity of each line with the caption. Each line is then given a score, and we pick top lines. For this purpose, we adapt Okapi BM25 (Beaulieu et al. Citation1997) similarity matching measure, as shown in EquationEq. 3(3)
(3) . The motivation behind using Okapi BM25 as a similarity measure is that it is more efficient than other similarity measures and performs well in many ad-hoc retrieval tasks.
where N = # of lines in the D, = line frequency,
= frequency of term t in line L,
= frequency of term t in caption
,
= length of line
,
= average length of line in D, and the
,
and
are set to 2, 2 and 0.75.
Specialized summary generation
We generated a specialized summary by combining two sub summaries: (a) figure semantics that we generated by parsing figure and computing AUC (b) figure metadata. We also proposed a query search mechanism, however developing it is beyond the scope of this paper. The proposed query search mechanism will work according to the following ranking formula:
Where n = total no of result-figures in a full-text document ,
is the query,
is tf-idf based summary of full-text document,
is the specialized figure-based summary including figure semantics and figure metadata, against result-figure
and λ is the weighting parameter which is set to 0.5, hence equal weight is given to both summaries.
Results and discussion
In this section, we discuss the results against figure extraction, classification, figure parsing and empirical results for a summary generation. Furthermore, figure parsing results are divided into three subsections: parsing figure text, curve separation and finding the area under the curves.
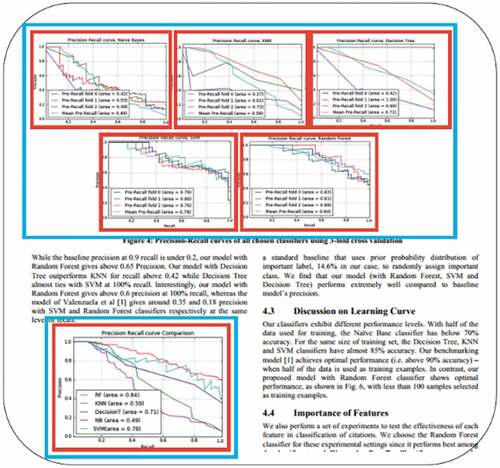
Figure extraction & classification
In order to extract and classify figures from PDF documents, we deployed some existing state of the art techniques (Clark and Divvala Citation2016; Siegel et al. Citation2016). shows the results of our dataset (described in Section 3.1) from the existing approach for figure extraction. The blue bounding box highlights the figure on the PDF document page whereas, the red bounding box highlights the subfigures within the figure.
Figure 3. Figure Extraction from the PDF page. Blue bounding boxes to extract the whole figure and Red bounding box to extract subfigures within a figure.
Moreover, illustrates the classification results with the existing state of the art approach (Siegel et al. Citation2016). The deployed approach achieved an accuracy of 86% using ResNet-50. The model classifies figures into different classes such as graph plots, node diagrams, bar charts, and scatter plots. is sample classification results for graph plot (line graph) and bar chart, respectively.
Figure 4. Figure classification results.
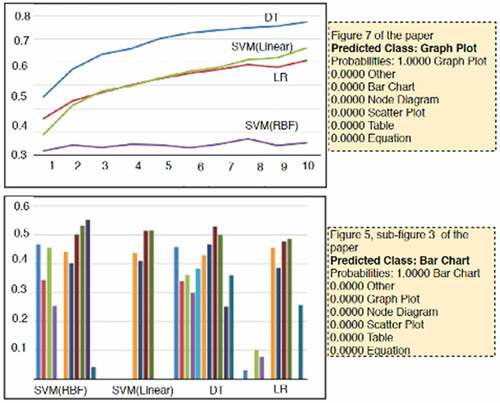
Figure parsing
Figure parsing is divided into three subsections; (i) Textual parsing, where figure’s text is extracted using bounding boxes. (ii) Curve separation where we showed that colors separated curves and Hough transformation helps in drawing contours surrounding (iii) Area under the curve computed results.
Textual parsing
The designed approach draws the bounding boxes against the axes labels, axes scale, legend text and figure text found in the figure. The bounding box is in the form [x,y,w,h] . Using width ‘w’ and height ‘h,’ we can find the angle of rotation. shows the bounding boxes identifying the text in the figure. However, we can see that not all the text is identified; our parser omits two scale marks from the y-axis. Such minor errors are likely to occur.
Figure 5. Text parsing results: figure text is identified by drawing bounding boxes around the text.
Curve Separation
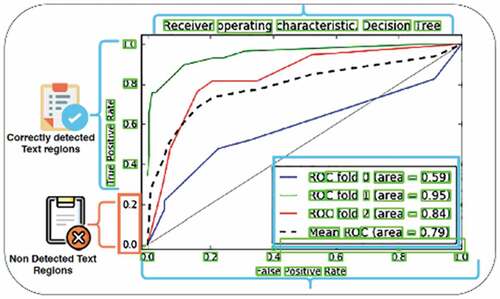
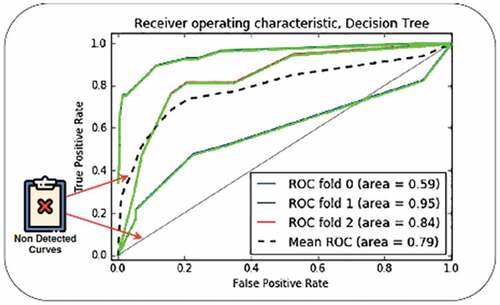
The curve separation process is divided into two steps; firstly, curves are separated by color. Secondly, the transformation is applied to extract plotted data. It first finds end-points of small lines on the curve that are then joined to form contours surrounding the curves. represents that not all curves are identified, two out of 5 curves are black, and our parser did not pick them up, which is the limitation of our current model.
Figure 6. Contours drawn surrounding curves to pick the plotted data.
Area under the curve
For finding AUC, we used the trapezoidal rule (Pavičić et al. Citation2018), it divided the curve into multiple small intervals and calculated the area covered by those intervals. Furthermore, we performed an empirical evaluation of the computed AUC value against the mentioned AUC results in the respective paper. Among 12,146 figures, we chose a random sample of over 1000 figures. Furthermore, for the empirical evaluation of AUC approach, we randomly selected 55 precision-recall curves from our dataset and computed their AUC value. Next, we cross-matched computed AUC with the AUC in full-text, and the results are shown in . Every blue dot on represents the value of either computed AUC or reported AUC. The red line is the ideal straight line on this plot. Closer the value of blue dots to the red line lesser the probability of error between computed AUC and reported AUC and vice versa. indicates that the bluer dots are closer to the red line that is clearly shows the encouraging performance of our designed AUC computation approach. AUC formula using trapezoidal rule has a few limitations, such as that it is error-prone; however, if the curve is divided into more segmentations, the value of error will be smaller.
Figure 7. Evaluation of Area under the curve calculation approach.
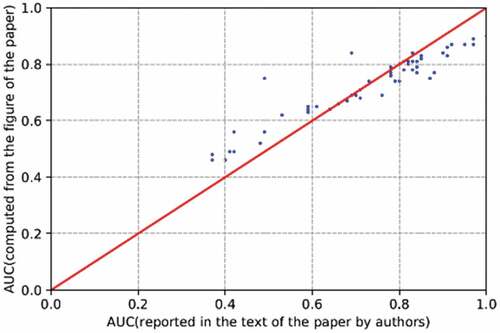
Figure 8. System generated summary against human-generated summary.
Summary generation
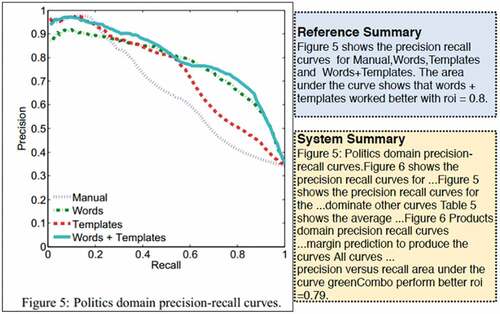
In order to evaluate the specialized summary, we generated a human-generated summary to work as a reference summary. For the human-generated summary, we allocated three human annotators. These summaries varied from three to five lines long and at least had 12 keywords. shows a sample of a human-generated summary (reference summary) and system-generated summary for a line chart extracted from this research paper (Goldberg et al. Citation2009). It is observed that system summaries are longer in length and provide a more detailed description of the given line chart as compared to the human-generated summaries.
Moreover, in order to measure the quality of system generated summaries against reference summaries, we applied four standard and commonly used metrics, ROUGE-1, ROUGE-L, Jaccard Similarity and, Edit Distance (Lin Citation2004). Firstly, we performed some pre-processing, e.g. lemmatization and stop word removal, on both summaries. Then we computed the values for all four-evaluation metrics. Following are the brief details of summary evaluation metrics:
ROUGE-1
ROUGE-N (N =1) is a 1-gram recall, calculated between the system summary and reference summary by finding the overlapping words between them
whereas, is calculated by dividing with the sum of words in system summaries.
Note that numerator sums over the overlapping keywords and provides more weight to the matched words. Therefore, ROUGE – N favors a system summary that shares more words with a reference summary.
ROUGE-L
The ROUFE-L is a measure to find the longest common overlapping subsequence between the system summary and reference summary. The basic intuition is that the longer the length of an overlapping subsequence is, the more similar the two summaries are.
Edit distance
The Edit Distance is a well-known measure to find the dissimilarity between two strings by counting a minimum number of operations required to transform one string into another. In our case, we computed the number of operations (removal, insertion or substitution) performed in order to convert human-generated summary to system summary. The larger the value for edit distance, the more dissimilar the summaries are.
Jaccard similarity
The Jaccard Similarity is a well-known matching algorithm to measure the similarity between two summaries. It ranges from 0 to,1 and the value closer to one shows the higher similarity between the summaries. If X is the reference summary and Y is the system summary.
represents the number of common words in both summarie,s and |X|,|Y| denotes the length of respective summaries.
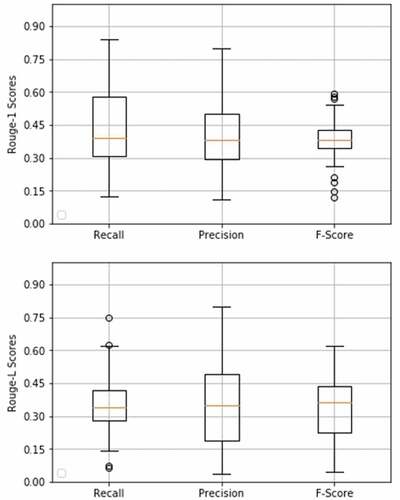
summarizes the results for all evaluation metrics against five summaries. We observed high values of recall ane slightly low values of precision for ROUGE-1 (R1) and ROUGE-L (RL) (see ). Similarly, in case of the Jaccard Similarity, we achieved approx. ~ 40% similarity between system and reference summary. For Edit Distance, a relatively low score is being observed. Overall, it shows that the system summaries consist of most of the keywords used in human-generated summaries plus some more information. Therefore, system summaries are more detailed.
Table 1. Comparison of Figure Specialized Summaries with Reference summaries using Rouge-1, Rouge-L, Jaccard Similarity and Edit distance
Figure 9. Box Plots representing ROUGE-1 and ROUGE-L scores.
Concluding remarks
We presented a system that first extract result-figures from scholarly documents, classify them and then parse them in order to extract figure semantics such as text, plotted data and area under the curve. On the other hand, our system detects captions from full-text scholarly document. Using those captions, it generates figure specific summaries. Finally, it combines the figure semantics from parsing figures and figure metadata from the summaries to generate specialized summaries. We also propose a query search mechanism where a document ranking approach is suggested for the future using the semantic meta-data of result-figures. One of the limitations of this work is the dependency of system summary on extracting the original reference summary from the paper. In future, we need a better way to make the evaluation stronger keeping in the view that low precision may not be bad, since the system enriches the summary by incorporating more words to original summary. Our work can be extended to create an automated figure evaluation mechanism where we can review the area under the curves or other similar shapes. Another important application of this work can be semantic plagiarism detection of figures in scholarly documents.
Disclosure statement
No potential conflict of interest was reported by the author(s).
Notes
References
- Al-Zaidy, R. A., and C. L. Giles. 2015. Automatic extraction of data from bar charts. In Proceedings of the 8th International Conference on Knowledge Capture, 323. ACM, Palisades, NY, USA. October.
- Al-Zaidy, R. A., and C. L. Giles (2017, February). A machine learning approach for semantic structuring of scientific charts in scholarly documents. In Twenty-Ninth IAAI Conference, San Francisco, California, USA.
- Barros, C., E. Lloret, E. Saquete, and B. Navarro-Colorado. 2019. NATSUM: Narrative abstractive summarization through cross-document timeline generation. Information Processing & Management 56 (5):1775–349. doi:10.1016/j.ipm.2019.02.010.
- Beaulieu, M., M. Gatford, X. Huang, S. Robertson, S. Walker, and P. Williams. 1997. Okapi at TREC-5. In NIST SPECIAL PUBLICATION SP, Netherlands, 143–66.
- Bhatia, S., and P. Mitra. 2012. Summarizing figures, tables, and algorithms in scientific publications to augment search results. ACM Transactions on Information Systems (TOIS) 30:3.
- Chen, C., R. Zhang, E. Koh, S. Kim, S. Cohen, T. Yu, R. Rossi, and R. Bunescu (2019) Neural Caption Generation over Figures. In Adjunct Proceedings of the 2019 ACM International Joint Conference on Pervasive and Ubiquitous Computing and the 2019 International Symposium on Wearable Computers (UbiComp/ISWC ‘19 Adjunct), September 9–13,2019, London, United Kingdom. ACM, New York, NY, USA
- Chen, K., M. Seuret, M. Liwicki, J. Hennebert, and R. Ingold (2015, August). Page segmentation of historical document images with convolutional autoencoders. In 2015 13th International Conference on Document Analysis and Recognition (ICDAR) (pp. 1011–15). IEEE, Nancy, France.
- Choudhury, P. S., S. Wang, and L. Giles (2015). Automated data extraction from scholarly line graphs. In GREC, Nancy, France
- Choudhury, S. R., S. Tuarob, P. Mitra, L. Rokach, A. Kirk, S. Szep, …, and C. L. Giles (2013, July). A figure search engine architecture for a chemistry digital library. In Proceedings of the 13th ACM/IEEE-CS joint conference on Digital libraries (pp. 369–70). ACM, Indianapolis, IN, USA.
- Choudhury, S. R., S. Wang, and C. L. Giles (2016, June). Curve separation for line graphs in scholarly documents. In 2016 IEEE/ACM Joint Conference on Digital Libraries (JCDL) (pp. 277–78). IEEE, Newark, NJ, USA.
- Clark, C., and S. Divvala, 2016. PDFFigures 2.0: Mining figures from research papers, in: Digital Libraries (JCDL), 2016 IEEE/ACM Joint Conference On. IEEE, pp. 143–52, Newark, NJ, USA.
- Cliche, M., D. Rosenberg, D. Madeka, and C. Yee (2017, September). Scatteract: Automated extraction of data from scatter plots. In Joint European Conference on Machine Learning and Knowledge Discovery in Databases (pp. 135–50). Springer, Cham, Skopje, Macedonia.
- Deng, J., W. Dong, R. Socher, L.-J. Li, K. Li, and L. Fei-Fei, 2009. Imagenet: A large-scale hierarchical image database, in: Computer Vision and Pattern Recognition, 2009. CVPR 2009. IEEE Conference On. Ieee, pp. 248–55, Miami, Florida, USA.
- Goldberg, A. B., N. Fillmore, D. Andrzejewski, Z. Xu, B. Gibson, and X. Zhu (2009, May). May all your wishes come true: A study of wishes and how to recognize them. In Proceedings of Human Language Technologies: The 2009 Annual Conference of the North American Chapter of the Association for Computational Linguistics (pp. 263–71). Association for Computational Linguistics, Boulder, Colorado, USA.
- Hassan, S. U., A. Akram, and P. Haddawy (2017, June). Identifying important citations using contextual information from full text. In 2017 ACM/IEEE Joint Conference on Digital Libraries (JCDL) (pp. 1–8). IEEE, Toronto, ON, Canada.
- Hassan, S. U., I. Safder, A. Akram, and F. Kamiran. 2018b. A novel machine-learning approach to measuring scientific knowledge flows using citation context analysis. Scientometrics 116 (2):973–96. doi:10.1007/s11192-018-2767-x.
- Hassan, S. U., M. Imran, S. Iqbal, N. R. Aljohani, and R. Nawaz. 2018a. Deep context of citations using machine-learning models in scholarly full-text articles. Scientometrics 117 (3):1645–62. doi:10.1007/s11192-018-2944-y.
- Hassan, S. U., M. Imran, T. Iftikhar, I. Safder, and M. Shabbir (2017, November). Deep stylometry and lexical & syntactic features based author attribution on PLoS digital repository. In International conference on Asian digital libraries (pp. 119–27). Springer, Cham, Bangkok, Thailand.
- Hassan, S. U., P. Haddawy, P. Kuinkel, A. Degelsegger, and C. Blasy. 2012. A bibliometric study of research activity in ASEAN related to the EU in FP7 priority areas. Scientometrics 91 (3):1035–51. doi:10.1007/s11192-012-0665-1.
- He, D., S. Cohen, B. Price, D. Kifer, and C. L. Giles (2017, November). Multi-scale multi-task fcn for semantic page segmentation and table detection. In 2017 14th IAPR International Conference on Document Analysis and Recognition (ICDAR) (Vol.1, pp. 254–61). IEEE, Kyoto, Japan.
- Iqbal, S., S. U. Hassan, N. R. Aljohani, S. Alelyani, R. Nawaz, and L. Bornmann. 2021. A decade of in-text citation analysis based on natural language processing and machine learning techniques: An overview of empirical studies. Scientometrics 126 (8):6551–99. doi:10.1007/s11192-021-04055-1.
- Iqbal, W., J. Qadir, G. Tyson, A. N. Mian, S. U. Hassan, and J. Crowcroft. 2019. A bibliometric analysis of publications in computer networking research. Scientometrics 119 (2):1121–55. doi:10.1007/s11192-019-03086-z.
- Jung, D., W. Kim, H. Song, J. I. Hwang, B. Lee, B. Kim, and J. Seo (2017, May). ChartSense: Interactive data extraction from chart images. In Proceedings of the 2017 CHI Conference on Human Factors in Computing Systems (pp. 6706–17). ACM, Denver, CO, USA.
- Kahou, S. E., V. Michalski, A. Atkinson, Á. Kádár, A. Trischler, and Y. Bengio. 2017. Figureqa: An annotated figure dataset for visual reasoning. ICLR, Vancouver, BC, Canada.
- Khabsa, M., P. Treeratpituk, and C. L. Giles (2012, June). Ackseer: A repository and search engine for automatically extracted acknowledgments from digital libraries. In Proceedings of the 12th ACM/IEEE-CS joint conference on Digital Libraries (pp. 185–94). ACM, Washington, DC, USA.
- Lee, P. S., J. D. West, and B. Howe. 2017. Viziometrics: Analyzing visual information in the scientific literature. IEEE Transactions on Big Data 4 (1):117–29. doi:10.1109/TBDATA.2017.2689038.
- Li, Z., M. Stagitis, S. Carberry, and K. F. McCoy (2013, July). Towards retrieving relevant information graphics. In Proceedings of the 36th international ACM SIGIR conference on research and development in information retrieval (pp. 789–92). ACM, Dublin, Ireland.
- Lin, C. Y. 2004. Rouge: A package for automatic evaluation of summaries. In Text summarization branches out, 74–81, Spain.
- Liu, X., K. H. Ghazali, F. Han, and I. I. Mohamed. 2021. Automatic detection of oil palm tree from UAV images based on the deep learning method. Applied Artificial Intelligence 35 (1):13–24. doi:10.1080/08839514.2020.1831226.
- Liu, Y., K. Bai, P. Mitra, and C. L. Giles (2007, June). Tableseer: Automatic table metadata extraction and searching in digital libraries. In Proceedings of the 7th ACM/IEEE-CS joint conference on Digital libraries (pp. 91–100). ACM, Vancouver, BC, Canada.
- Mohamed, M., and M. Oussalah. 2019. SRL-ESA-TextSum: A text summarization approach based on semantic role labeling and explicit semantic analysis. Information Processing & Management 56 (4):1356–72. doi:10.1016/j.ipm.2019.04.003.
- Moraes, P., G. Sina, K. McCoy, and S. Carberry, 2014. Generating summaries of line graphs, in: Proceedings of the 8th International Natural Language Generation Conference (INLG). pp. 95–98, Philadelphia, Pennsylvania, USA.
- Mutlu, B., E. A. Sezer, and M. A. Akcayol. 2019. Multi-document extractive text summarization: A comparative assessment on features. Knowledge-Based Systems, Amsterdam.
- Pavičić, J., Ž. Andreić, T. Malvić, R. Rajić, and J. Velić, 2018. Application of Simpson\’ s and trapezoidal formulas for volume calculation of subsurface structures-recommendations, in: 2nd Croatian Scientific Congress from Geomathematics and Terminology in Geology, Croatia.
- Qian, X., M. Li, Y. Ren, and S. Jiang. 2019. Social media based event summarization by user–text–image co-clustering. Knowledge-Based Systems 164:107–21. doi:10.1016/j.knosys.2018.10.028.
- Rahi, S., I. Safder, S. Iqbal, S. U. Hassan, and R. Nawaz (2019) Citation classification using natural language processing and machine learning models. In proceedings of Conference on Smart Information & Communication Technologies (SmartICT’19), Oujda Morocco.
- Ray Choudhury, S., P. Mitra, and C. L. Giles (2015, September). Automatic extraction of figures from scholarly documents. In Proceedings of the 2015 ACM Symposium on Document Engineering (pp. 47–50). ACM.
- Saba, T., A. Rehman, A. Al-Dhelaan, and M. Al-Rodhaan. 2014. Evaluation of current documents image denoising techniques: A comparative study. Applied Artificial Intelligence 28 (9):879–87. doi:10.1080/08839514.2014.954344.
- Safder, I., J. Sarfraz, S. U. Hassan, M. Ali, and S. Tuarob (2017, November). Detecting target text related to algorithmic efficiency in scholarly big data using recurrent convolutional neural network model. In International conference on Asian digital libraries (pp. 30–40). Springer, Cham, Bangkok, Thailand.
- Safder, I., and S. U. Hassan (2018, November). DS4A: Deep search system for algorithms from full-text scholarly big data. In 2018 IEEE International Conference on Data Mining Workshops (ICDMW) (pp. 1308–15). IEEE, Singapore.
- Safder, I., and S. U. Hassan. 2019. Bibliometric-enhanced information retrieval: A novel deep feature engineering approach for algorithm searching from full-text publications. Scientometrics 119 (1):257–77. doi:10.1007/s11192-019-03025-y.
- Safder, I., S. U. Hassan, A. Visvizi, T. Noraset, R. Nawaz, and S. Tuarob. 2020. Deep learning-based extraction of algorithmic metadata in full-text scholarly documents. Information Processing & Management 57 (6):102269. doi:10.1016/j.ipm.2020.102269.
- Safder, I., S. U. Hassan, and N. R. Aljohani (2018, April). AI cognition in searching for relevant knowledge from scholarly big data, using a multi-layer perceptron and recurrent convolutional neural network model. In Companion Proceedings of the The Web Conference 2018 (pp. 251–58). International World Wide Web Conferences Steering Committee, Lyon , France.
- Said, A., T. D. Bowman, R. A. Abbasi, N. R. Aljohani, S. U. Hassan, and R. Nawaz. 2019. Mining network-level properties of Twitter altmetrics data. Scientometrics 120 (1):217–35. doi:10.1007/s11192-019-03112-0.
- Sermanet, P., D. Eigen, X. Zhang, M. Mathieu, R. Fergus, and Y. LeCun (2013). Overfeat: Integrated recognition, localization and detection using convolutional networks. In International Conference on Learning Representations (ICLR), pp. 1312.6229, Banff, AB, Canada.
- Siegel, N., N. Lourie, R. Power, and W. Ammar (2018, May). Extracting scientific figures with distantly supervised neural networks. In Proceedings of the 18th ACM/IEEE on joint conference on digital libraries (pp. 223–32). ACM, Fort Worth, TX, USA.
- Siegel, N., Z. Horvitz, R. Levin, S. Divvala, and A. Farhadi, 2016. FigureSeer: Parsing result-figures in research papers, in: European Conference on Computer Vision. Springer, pp. 664–80, Amsterdam, The Netherlands.
- Sinoara, R. A., J. Camacho-Collados, R. G. Rossi, R. Navigli, and S. O. Rezende. 2019. Knowledge-enhanced document embeddings for text classification. Knowledge-Based Systems 163:955–71. doi:10.1016/j.knosys.2018.10.026.
- Takimoto, H., F. Omori, and A. Kanagawa. 2021. Image aesthetics assessment based on multi-stream CNN architecture and saliency features. Applied Artificial Intelligence 35 (1):25–40. doi:10.1080/08839514.2020.1839197.
- Tallarida, R. J., and R. B. Murray (1987). Area under a curve: Trapezoidal and Simpson’s rules. In Manual of Pharmacologic Calculations (pp. 77–81). Springer, New York, NY.
- Thepade, S. D., and P. R. Chaudhari. 2021. Land usage identification with fusion of thepade SBTC and sauvola thresholding features of aerial images using ensemble of machine learning algorithms. Applied Artificial Intelligence 35 (2):154–70. doi:10.1080/08839514.2020.1842627.
- Tsutsui, S., and D. J. Crandall (2017, November). A data driven approach for compound figure separation using convolutional neural networks. In 2017 14th IAPR International Conference on Document Analysis and Recognition (ICDAR) (Vol.1, pp. 533–40). IEEE, Kyoto, Japan.
- Tuarob, S., S. Bhatia, P. Mitra, and C. L. Giles. 2016. AlgorithmSeer: A system for extracting and searching for algorithms in scholarly big data. IEEE Transactions on Big Data 2 (1):3–17. doi:10.1109/TBDATA.2016.2546302.
- Unar, S., X. Wang, C. Wang, and Y. Wang. 2019. A decisive content based image retrieval approach for feature fusion in visual and textual images. Knowledge-Based Systems 179:8–20. doi:10.1016/j.knosys.2019.05.001.
- Xu, J., F. Huang, X. Zhang, S. Wang, C. Li, Z. Li, and Y. He. 2019. Visual-textual sentiment classification with bi-directional multi-level attention networks. Knowledge-Based Systems 178:61–73. doi:10.1016/j.knosys.2019.04.018.
- Zha, H., W. Chen, K. Li, and X. Yan (2019, July). Mining algorithm roadmap in scientific publications. In Proceedings of the 25th ACM SIGKDD International Conference on Knowledge Discovery & Data Mining (pp. 1083–92), Anchorage, AK, USA.
- Zhao, Z., H. Zhu, Z. Xue, Z. Liu, J. Tian, M. C. H. Chua, and M. Liu. 2019. An image-text consistency driven multimodal sentiment analysis approach for social media. Information Processing & Management 56 (6):102097. doi:10.1016/j.ipm.2019.102097.
- Zhu, J., Y. Yang, Q. Xie, L. Wang, and S. U. Hassan. 2014. Robust hybrid name disambiguation framework for large databases. Scientometrics 98 (3):2255–74. doi:10.1007/s11192-013-1151-0.